
PUBLISHER: Global Market Insights Inc. | PRODUCT CODE: 1666526

PUBLISHER: Global Market Insights Inc. | PRODUCT CODE: 1666526
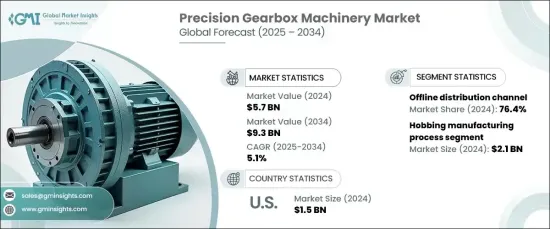
Precision Gearbox Machinery Market Opportunity, Growth Drivers, Industry Trend Analysis, and Forecast 2025 - 2034
The Global Precision Gearbox Machinery Market reached USD 5.7 billion in 2024 and is projected to expand at a CAGR of 5.1% from 2025 to 2034. This growth reflects the rising demand for high-performance gear systems across key sectors, including automotive, aerospace, energy, and robotics. As industries continue to advance technologically, the need for precision gearbox solutions has surged to ensure the efficient and reliable operation of complex machinery. In particular, the automotive and aerospace sectors emphasize safety and accuracy, driving the adoption of advanced gearboxes that meet stringent performance and reliability standards.
The market is also benefiting from the rapid adoption of automation and robotics in manufacturing and industrial processes. Businesses are integrating cutting-edge technologies such as IoT and smart sensors into gear systems to enable real-time monitoring, predictive maintenance, and enhanced operational efficiency. These innovations not only optimize power transmission but also support sustainability goals by reducing energy losses. The growing focus on energy efficiency and minimizing environmental impact further fuels the development of advanced gearbox solutions, reinforcing their role as a cornerstone of modern industrial operations.
| Market Scope | |
|---|---|
| Start Year | 2024 |
| Forecast Year | 2025-2034 |
| Start Value | $5.7 Billion |
| Forecast Value | $9.3 Billion |
| CAGR | 5.1% |
The hobbing manufacturing process contributed USD 2.1 billion in 2024 and is forecasted to grow at a robust CAGR of 5.5% during the next decade. Industries favor hobbing for its unparalleled ability to produce gears with intricate shapes and fine-tooth profiles, which are essential for high-performance applications. This manufacturing technique ensures exceptional accuracy, consistency, and cost efficiency, making it the go-to choice for large-scale production of precision gears across industries.
In 2024, offline distribution channels accounted for 76.4% of the market share and are projected to grow at a CAGR of 5% over the forecast period. Offline channels remain a preferred choice due to the need for personalized service, technical consultations, and direct interactions. These channels are particularly vital for sectors such as automotive, aerospace, and manufacturing, where businesses prioritize hands-on evaluations of technical specifications to ensure the reliability of gearbox solutions before purchase.
The US precision gearbox machinery market generated USD 1.5 billion in 2024, driven by the country's robust manufacturing base and leadership in automation and robotics. Home to leading machinery and equipment manufacturers, the US fosters continuous innovation and ensures a steady supply of cutting-edge gearbox technologies. The nation's focus on industrial automation and precision engineering further amplifies the demand for high-performance gear systems, solidifying its position as a key contributor to global market growth.
Table of Contents
Chapter 1 Methodology & Scope
- 1.1 Market scope & definition
- 1.2 Base estimates & calculations
- 1.3 Forecast parameters
- 1.4 Data sources
- 1.4.1 Primary
- 1.4.2 Secondary
- 1.4.2.1 Paid sources
- 1.4.2.2 Public sources
Chapter 2 Executive Summary
- 2.1 Industry 3600 synopsis, 2021 - 2034
Chapter 3 Industry Insights
- 3.1 Industry ecosystem analysis
- 3.1.1 Factors affecting the value chain
- 3.1.2 Profit margin analysis
- 3.1.3 Disruptions
- 3.1.4 Future outlook
- 3.1.5 Manufacturers
- 3.1.6 Distributors
- 3.1.7 Retailers
- 3.2 Impact forces
- 3.2.1 Growth drivers
- 3.2.1.1 Growing preference for modular kitchens
- 3.2.1.2 Innovation and product development
- 3.2.1.3 Demand for organized kitchens
- 3.2.1.4 Rise in disposable income
- 3.2.2 Industry pitfalls & challenges
- 3.2.2.1 Durability concerns in low-quality products
- 3.2.2.2 Lack of standardization
- 3.2.1 Growth drivers
- 3.3 Technology & innovation landscape
- 3.4 Consumer buying behavior analysis
- 3.4.1 Demographic trends
- 3.4.2 Factors affecting buying decision
- 3.4.3 Consumer product adoption
- 3.4.4 Preferred distribution channel
- 3.5 Growth potential analysis
- 3.6 Regulatory landscape
- 3.7 Pricing analysis
- 3.8 Porter’s analysis
- 3.9 PESTEL analysis
Chapter 4 Competitive Landscape, 2024
- 4.1 Introduction
- 4.2 Company market share analysis
- 4.3 Competitive positioning matrix
- 4.4 Strategic outlook matrix
Chapter 5 Market Estimates & Forecast, By Manufacturing Process, 2021 – 2034, (USD Billion) (Million Units)
- 5.1 Key trends
- 5.2 Hobbing
- 5.3 Grinding
- 5.4 Turning
- 5.5 Honing
Chapter 6 Market Estimates & Forecast, By Product, 2021 – 2034, (USD Billion) (Million Units)
- 6.1 Key trends
- 6.2 Planetary
- 6.3 Right angle
- 6.4 Parallel
Chapter 7 Market Estimates & Forecast, By Application, 2021 – 2034, (USD Billion) (Million Units)
- 7.1 Key trends
- 7.2 Machine tools
- 7.3 Material handling
- 7.4 Packaging
- 7.5 Robotics
- 7.6 Automobile
- 7.7 Off-road vehicles
- 7.8 Wind towers
- 7.9 Agriculture
- 7.10 Railways
- 7.11 Marine
- 7.12 Others
Chapter 8 Market Estimates & Forecast, By Distribution Channel, 2021 – 2034, (USD Billion) (Million Units)
- 8.1 Key trends
- 8.2 Online
- 8.2.1 E-commerce website
- 8.3 Offline
- 8.3.1 OEM (Original equipment manufacturer)
- 8.3.2 Specialty stores / showrooms
Chapter 9 Market Estimates & Forecast, By Region, 2021 – 2034, (USD Billion) (Million Units)
- 9.1 Key trends
- 9.2 North America
- 9.2.1 U.S.
- 9.2.2 Canada
- 9.3 Europe
- 9.3.1 Germany
- 9.3.2 UK
- 9.3.3 France
- 9.3.4 Italy
- 9.3.5 Spain
- 9.4 Asia Pacific
- 9.4.1 China
- 9.4.2 India
- 9.4.3 Japan
- 9.4.4 South Korea
- 9.4.5 Australia
- 9.4.6 Malaysia
- 9.4.7 Indonesia
- 9.5 Latin America
- 9.5.1 Brazil
- 9.5.2 Mexico
- 9.6 MEA
- 9.6.1 Saudi Arabia
- 9.6.2 UAE
- 9.6.3 South Africa
Chapter 10 Company Profiles (Business Overview, Financial Data, Product Landscape, Strategic Outlook, SWOT Analysis)
- 10.1 DANOBAT
- 10.2 DMG MORI
- 10.3 DVS Technology Group
- 10.4 EMAG
- 10.5 Gleason Corporation
- 10.6 Lagun Engineering
- 10.7 Liebherr-International Deutschland
- 10.8 Matrix Precision
- 10.9 Nidec
- 10.10 Reishauer
- 10.11 Samputensili Cutting Tools
- 10.12 J.G. WEISSER SOHNE
- 10.13 Starrag Group

