
PUBLISHER: Global Market Insights Inc. | PRODUCT CODE: 1665376

PUBLISHER: Global Market Insights Inc. | PRODUCT CODE: 1665376
OLED-on-Silicon (OLEDoS) Market Opportunity, Growth Drivers, Industry Trend Analysis, and Forecast 2025 - 2034
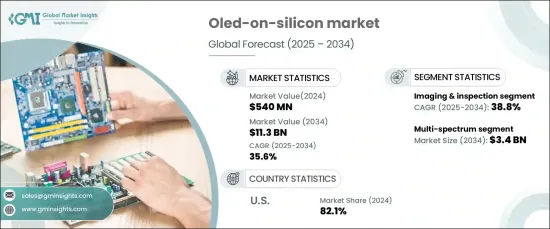
The Global OLED-On-Silicon Market achieved a valuation of USD 540 million in 2024 and is projected to experience remarkable growth, registering a CAGR of 35.6% from 2025 to 2034. This surge is propelled by the escalating demand for high-performance displays that deliver exceptional clarity, vibrant colors, and sharp visuals. OLEDoS technology is gaining widespread adoption across diverse applications, including smartphones, wearable devices, and AR/VR products, thanks to its superior pixel density and outstanding image quality.
The growing trend toward miniaturization and integration in consumer electronics is further accelerating the market's expansion. As devices become increasingly compact, lightweight, and portable, OLEDoS emerges as an ideal display solution, offering unparalleled performance without compromising quality. Its ultra-thin and compact design is perfectly suited for modern consumer gadgets, where space-saving components are paramount.
| Market Scope | |
|---|---|
| Start Year | 2024 |
| Forecast Year | 2025-2034 |
| Start Value | $540 Million |
| Forecast Value | $11.3 Billion |
| CAGR | 35.6% |
Segmented by light spectrum, the OLED-on-Silicon market encompasses near-infrared, infrared, ultraviolet, multi-spectrum, and others. The multi-spectrum segment is anticipated to reach a valuation of USD 3.4 billion by 2034. Meanwhile, the visible spectrum segment is set to dominate the market, driven by its extensive use in high-resolution displays for virtual and augmented reality devices, as well as consumer electronics. These displays deliver superior brightness, color accuracy, and visual performance, meeting the needs of industries such as gaming, automotive, and healthcare, where vibrant and detailed visuals are critical.
In terms of application, the market is divided into display systems, sensing and detection, imaging and inspection, optical communication, and others. Among these, the imaging and inspection segment is poised for impressive growth, projected to achieve a CAGR of 38.8% through 2034, making it the fastest-growing category. Display systems, however, continue to hold a significant share of the market, fueled by the rising demand for energy-efficient and high-performance displays in consumer electronics and AR/VR devices. OLEDoS technology distinguishes itself by delivering rich colors, enhanced brightness, and low power consumption, making it the go-to solution for compact and high-resolution display systems.
The U.S. OLED-on-Silicon market claimed an impressive 82.1% share in 2024, underscoring its dominant position. This leadership is bolstered by strong demand for state-of-the-art consumer electronics and AR/VR devices. Robust investments in research and development, coupled with government initiatives supporting sustainable and energy-efficient technologies, are further driving the adoption of OLEDoS in the U.S., solidifying its status as a key player in the global market.
Table of Contents
Chapter 1 Methodology & Scope
- 1.1 Market scope & definitions
- 1.2 Base estimates & calculations
- 1.3 Forecast calculations
- 1.4 Data sources
- 1.4.1 Primary
- 1.4.2 Secondary
- 1.4.2.1 Paid sources
- 1.4.2.2 Public sources
Chapter 2 Executive Summary
- 2.1 Industry synopsis, 2021-2034
Chapter 3 Industry Insights
- 3.1 Industry ecosystem analysis
- 3.1.1 Factor affecting the value chain
- 3.1.2 Profit margin analysis
- 3.1.3 Disruptions
- 3.1.4 Future outlook
- 3.1.5 Manufacturers
- 3.1.6 Distributors
- 3.2 Supplier landscape
- 3.3 Profit margin analysis
- 3.4 Key news & initiatives
- 3.5 Regulatory landscape
- 3.6 Impact forces
- 3.6.1 Growth drivers
- 3.6.1.1 Rising demand for high-resolution displays
- 3.6.1.2 Miniaturization and integration in consumer electronics
- 3.6.1.3 Enhanced performance and cost efficiency
- 3.6.1.4 Advancements in flexible and transparent display technologies
- 3.6.1.5 Support from industry leaders and technological partnerships
- 3.6.2 Industry pitfalls & challenges
- 3.6.2.1 High manufacturing costs and complexity
- 3.6.2.2 Limited market penetration and consumer awareness
- 3.6.1 Growth drivers
- 3.7 Growth potential analysis
- 3.8 Porter’s analysis
- 3.9 PESTEL analysis
Chapter 4 Competitive Landscape, 2024
- 4.1 Introduction
- 4.2 Company market share analysis
- 4.3 Competitive positioning matrix
- 4.4 Strategic outlook matrix
Chapter 5 Market Estimates & Forecast, By Light Spectrum, 2021-2034 (USD Billion) (Units)
- 5.1 Key trends
- 5.2 Visible spectrum (RGB, Full-Color Displays)
- 5.3 Near-infrared (NIR, 700-1400 nm)
- 5.4 Infrared (IR, 700-3000 nm)
- 5.5 Ultraviolet (UV, <400 nm)
- 5.6 Multi-spectrum (Visible + IR + NIR)
- 5.7 Others
Chapter 6 Market Estimates & Forecast, By Application, 2021-2034 (USD Billion) (Units)
- 6.1 Key trends
- 6.2 Display systems
- 6.3 Sensing & detection
- 6.4 Imaging & inspection
- 6.5 Optical communication
- 6.6 Others
Chapter 7 Market Estimates & Forecast, By End Use, 2021-2034 (USD Billion) (Units)
- 7.1 Key trends
- 7.2 Aerospace & defense
- 7.3 Consumer electronics
- 7.4 Industrial & manufacturing
- 7.5 Healthcare & medical
- 7.6 Automotive
- 7.7 Others
Chapter 8 Market Estimates & Forecast, By Region, 2021-2034 (USD Billion) (Units)
- 8.1 Key trends
- 8.2 North America
- 8.2.1 U.S.
- 8.2.2 Canada
- 8.3 Europe
- 8.3.1 UK
- 8.3.2 Germany
- 8.3.3 France
- 8.3.4 Italy
- 8.3.5 Spain
- 8.3.6 Russia
- 8.4 Asia Pacific
- 8.4.1 China
- 8.4.2 India
- 8.4.3 Japan
- 8.4.4 South Korea
- 8.4.5 Australia
- 8.5 Latin America
- 8.5.1 Brazil
- 8.5.2 Mexico
- 8.6 MEA
- 8.6.1 South Africa
- 8.6.2 Saudi Arabia
- 8.6.3 UAE
Chapter 9 Company Profiles
- 9.1 China Star Optoelectronics Technology (CSOT)
- 9.2 eMagin Corporation
- 9.3 Himax Technologies, Inc.
- 9.4 HOLOEYE Photonics AG
- 9.5 Innolux Corporation
- 9.6 JDI (Japan Display Inc.)
- 9.7 Kopin Corporation
- 9.8 LG Display Co., Ltd.
- 9.9 Olightek
- 9.10 Pixelligent Technologies LLC
- 9.11 Raystar Optronics Inc.
- 9.12 Ritek Corporation
- 9.13 Samsung Electronics Co., Ltd.
- 9.14 SeeYA Technology
- 9.15 SiliconCore Technology Inc.
- 9.16 Sony Corporation
- 9.17 Tridonic GmbH & Co. KG
- 9.18 Visionox
- 9.19 Winstar Display Co., Ltd.
- 9.20 WiseChip Semiconductor Inc.

