
PUBLISHER: Global Market Insights Inc. | PRODUCT CODE: 1665317

PUBLISHER: Global Market Insights Inc. | PRODUCT CODE: 1665317
Virtual Power Plant Market Opportunity, Growth Drivers, Industry Trend Analysis, and Forecast 2025 - 2034
The Global Virtual Power Plant Market is anticipated to reach USD 4.6 billion in 2024 and is projected to experience a remarkable growth rate of 21.6% CAGR from 2025 to 2034. VPPs are revolutionizing the energy sector by integrating decentralized, small-scale power generation units into a cohesive network managed by a central system. By aggregating energy from distributed resources, these advanced systems optimize production, consumption, and distribution, operating seamlessly as a single entity. This innovative approach boosts grid stability, enhances energy efficiency, and simplifies resource management, contributing to a more reliable and sustainable energy ecosystem.
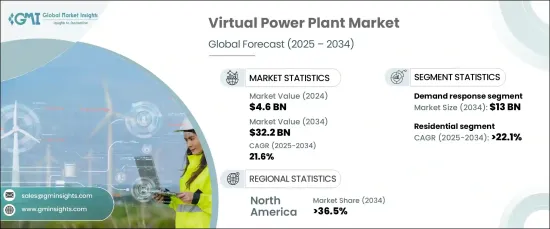
The VPP market is divided into key technological segments, including distributed energy resources, demand response, and mixed asset systems. Among these, the demand response segment is poised to generate USD 13 billion by 2034. This growth is driven by its capability to enhance grid reliability, prevent outages, and enable more cost-effective energy management. Demand response systems help reduce strain on existing infrastructure, minimizing the need for additional power generation capacity and promoting energy efficiency. As the demand for affordable and efficient energy solutions rises, demand response systems have become a vital component of VPPs, enabling a more dynamic and sustainable energy grid.
| Market Scope | |
|---|---|
| Start Year | 2024 |
| Forecast Year | 2025-2034 |
| Start Value | $4.6 Billion |
| Forecast Value | $32.2 Billion |
| CAGR | 21.6% |
When it comes to end users, the VPP market is categorized into residential, industrial, and commercial applications. The industrial segment is projected to grow at an impressive CAGR of 20.5% through 2034. Rising energy demands within industrial operations are driving the need for solutions that can lower costs by shifting energy loads, reducing peak demand, and providing real-time energy management. Additionally, the growing focus on sustainability goals and carbon emission reductions is accelerating the adoption of VPPs in industries. As industrial sectors increasingly prioritize reliable and energy-efficient systems to support continuous operations, VPPs have become an essential part of their energy strategies.
In the U.S., the virtual power plant market is forecast to generate USD 9.2 billion by 2034. The challenges of maintaining grid stability due to aging infrastructure, extreme weather events, and increasing energy demand are spurring the adoption of VPPs to ensure resilience. Federal policies, such as tax credits and grants for renewable energy and storage technologies, are creating a favorable environment for VPP deployment. These policies not only enhance energy security but also promote the widespread adoption of advanced power management systems in both residential and industrial sectors.
Table of Contents
Chapter 1 Methodology & Scope
- 1.1 Market definitions
- 1.2 Base estimates & calculations
- 1.3 Forecast calculation
- 1.4 Primary research & validation
- 1.4.1 Primary sources
- 1.4.2 Data mining sources
- 1.5 Market definitions
Chapter 2 Executive Summary
- 2.1 Industry synopsis, 2021 – 2034
Chapter 3 Industry Insights
- 3.1 Industry ecosystem
- 3.2 Regulatory landscape
- 3.3 Industry impact forces
- 3.3.1 Growth drivers
- 3.3.2 Industry pitfalls & challenges
- 3.4 Growth potential analysis
- 3.5 Porter's analysis
- 3.5.1 Bargaining power of suppliers
- 3.5.2 Bargaining power of buyers
- 3.5.3 Threat of new entrants
- 3.5.4 Threat of substitutes
- 3.6 PESTEL analysis
Chapter 4 Competitive landscape, 2024
- 4.1 Introduction
- 4.2 Strategic dashboard
- 4.3 Innovation & sustainability landscape
Chapter 5 Market Size and Forecast, By Technology, 2021 – 2034 (USD Billion)
- 5.1 Key trends
- 5.2 Distributed energy resource
- 5.3 Demand response
- 5.4 Mixed asset
Chapter 6 Market Size and Forecast, By End Use, 2021 – 2034 (USD Billion)
- 6.1 Key trends
- 6.2 Residential
- 6.3 Industrial
- 6.4 Commercial
Chapter 7 Market Size and Forecast, By Region, 2021 – 2034 (USD Billion)
- 7.1 Key trends
- 7.2 North America
- 7.2.1 U.S.
- 7.2.2 Canada
- 7.3 Europe
- 7.3.1 Germany
- 7.3.2 France
- 7.3.3 UK
- 7.3.4 Italy
- 7.4 Asia Pacific
- 7.4.1 China
- 7.4.2 Japan
- 7.4.3 South Korea
- 7.4.4 India
- 7.5 Rest of World
Chapter 8 Company Profiles
- 8.1 AGL Energy
- 8.2 Bosch Global
- 8.3 Enel X
- 8.4 Enbala Power Networks
- 8.5 Hitachi
- 8.6 Tesla
- 8.7 Statkraft
- 8.8 Shell
- 8.9 Siemens
- 8.10 Schneider Electric

