
PUBLISHER: Global Market Insights Inc. | PRODUCT CODE: 1665197

PUBLISHER: Global Market Insights Inc. | PRODUCT CODE: 1665197
Sodium Cyanide Market Opportunity, Growth Drivers, Industry Trend Analysis, and Forecast 2025 - 2034
The Global Sodium Cyanide Market reached USD 2.8 billion in 2024 and is projected to expand at a robust CAGR of 5.5% from 2025 to 2034. This growth is being fueled by increasing demand across various industries, with precious metal mining being a major contributor. The compound's versatility and effectiveness in industrial processes, particularly in gold and silver extraction, make it a key player in global markets. Sodium cyanide is highly valued for its ability to efficiently extract metals, driving its widespread use in mining operations worldwide. Furthermore, as global markets continue to emphasize sustainability, the demand for sodium cyanide is also being supported by improvements in production methods that focus on reducing environmental impact.
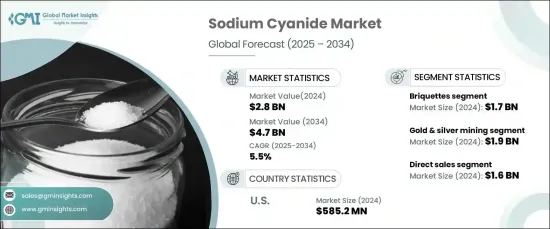
The briquettes segment leads the sodium cyanide market, valued at USD 1.7 billion in 2024. This form is expected to maintain a steady growth rate of 5.7% CAGR throughout the forecast period. Briquettes are favored for their ease of handling, storage, and transportation, making them ideal for large-scale mining operations. The solid form of briquettes minimizes the risks of spillage and contamination, ensuring safer and more efficient usage in critical mining processes. Pellets are also gaining traction, particularly in industries where precise dosing is crucial. Their uniform size and compatibility with automated systems make them an attractive choice for applications requiring high levels of accuracy. While powdered sodium cyanide holds a smaller market share, it remains an essential component for laboratory experiments and specialized tasks like organic synthesis, highlighting the diverse applications of this compound.
| Market Scope | |
|---|---|
| Start Year | 2024 |
| Forecast Year | 2025-2034 |
| Start Value | $2.8 Billion |
| Forecast Value | $4.7 Billion |
| CAGR | 5.5% |
The demand for sodium cyanide is primarily driven by its role in gold and silver mining, which represented a significant portion of the market at USD 1.9 billion in 2024. This segment is expected to experience a CAGR of 5.7% over the next decade. Sodium cyanide is indispensable in the cyanidation process, enabling the extraction of precious metals with high efficiency. As global demand for gold continues to grow, driven by its role in investments, electronics, and jewelry production, mining activities are expanding, particularly in emerging markets. The increasing extraction of these metals is expected to sustain the rising demand for sodium cyanide in the years ahead.
In the U.S., the sodium cyanide market was valued at USD 585.2 million in 2024 and is projected to grow at a steady CAGR of 5.7% through 2034. Strong mining operations across various states contribute to this market growth, particularly in the extraction of gold and silver, which remains the primary use of sodium cyanide in the country. Additionally, industrial applications in chemical processing further support the growth trajectory of the market. A growing emphasis on environmental sustainability is also driving innovation in cleaner production technologies, which is expected to enhance the safety and efficiency of sodium cyanide use in the future.
Table of Contents
Chapter 1 Methodology & Scope
- 1.1 Market scope & definitions
- 1.2 Base estimates & calculations
- 1.3 Forecast calculations
- 1.4 Data sources
- 1.4.1 Primary
- 1.4.2 Secondary
- 1.4.2.1 Paid sources
- 1.4.2.2 Public sources
Chapter 2 Executive Summary
- 2.1 Industry synopsis, 2021-2034
Chapter 3 Industry Insights
- 3.1 Industry ecosystem analysis
- 3.1.1 Factor affecting the value chain
- 3.1.2 Profit margin analysis
- 3.1.3 Disruptions
- 3.1.4 Future outlook
- 3.1.5 Manufacturers
- 3.1.6 Distributors
- 3.2 Supplier landscape
- 3.3 Profit margin analysis
- 3.4 Key news & initiatives
- 3.5 Regulatory landscape
- 3.6 Impact forces
- 3.6.1 Growth drivers
- 3.6.1.1 Growth of gold mining industry
- 3.6.1.2 Technological advancements
- 3.6.1.3 Emerging economies
- 3.6.2 Industry pitfalls & challenges
- 3.6.2.1 Environmental concerns and regulatory constraints
- 3.6.2.2 Toxicity and safety risks
- 3.6.1 Growth drivers
- 3.7 Growth potential analysis
- 3.8 Porter’s analysis
- 3.9 PESTEL analysis
Chapter 4 Competitive Landscape, 2024
- 4.1 Introduction
- 4.2 Company market share analysis
- 4.3 Competitive positioning matrix
- 4.4 Strategic outlook matrix
Chapter 5 Market Estimates & Forecast, By Form, 2021-2034 (USD Million) (Tons)
- 5.1 Key trends
- 5.2 Briquettes
- 5.3 Pellets
- 5.4 Powder
Chapter 6 Market Estimates & Forecast, By End Use Industry, 2021-2034 (USD Million) (Tons)
- 6.1 Key trends
- 6.2 Gold & silver mining
- 6.3 Jewelry manufacturing
- 6.4 Rodenticide
- 6.5 Rubber processing chemicals
- 6.6 Dyes and pigments
- 6.7 Others
Chapter 7 Market Estimates & Forecast, By Distribution Channel, 2021-2034 (USD Million) (Tons)
- 7.1 Key trends
- 7.2 Direct sales
- 7.3 Distributors & wholesalers
- 7.4 Online sales
Chapter 8 Market Estimates & Forecast, By Region, 2021-2034 (USD Million) (Tons)
- 8.1 Key trends
- 8.2 North America
- 8.2.1 U.S.
- 8.2.2 Canada
- 8.3 Europe
- 8.3.1 UK
- 8.3.2 Germany
- 8.3.3 France
- 8.3.4 Italy
- 8.3.5 Spain
- 8.3.6 Russia
- 8.4 Asia Pacific
- 8.4.1 China
- 8.4.2 India
- 8.4.3 Japan
- 8.4.4 South Korea
- 8.4.5 Australia
- 8.5 Latin America
- 8.5.1 Brazil
- 8.5.2 Mexico
- 8.6 MEA
- 8.6.1 South Africa
- 8.6.2 Saudi Arabia
- 8.6.3 UAE
Chapter 9 Company Profiles
- 9.1 Australian Gold Reagents
- 9.2 AnQore
- 9.3 Asahi Kasei
- 9.4 Changsha Hekang Chemical
- 9.5 Cyanco International
- 9.6 Draslovka
- 9.7 Evonik Industries
- 9.8 Gujarat Alkalies and Chemicals
- 9.9 LUKOIL
- 9.10 Orica
- 9.11 Taekwang Industrial
- 9.12 Wesfarmers

