
PUBLISHER: Global Market Insights Inc. | PRODUCT CODE: 1665061

PUBLISHER: Global Market Insights Inc. | PRODUCT CODE: 1665061
Gas Station Equipment Market Opportunity, Growth Drivers, Industry Trend Analysis, and Forecast 2024 - 2032
The Global Gas Station Equipment Market was valued at USD 7.1 billion in 2023 and is expected to experience steady growth, expanding at a CAGR of 4.7% from 2024 to 2032. This growth is being driven by the increasing demand for advanced fueling systems and energy-efficient technologies. As the focus on reducing carbon emissions intensifies, there has been a marked shift toward alternative fuels such as compressed natural gas (CNG), hydrogen, and electric vehicle (EV) charging stations. This transition is prompting gas station operators to modernize their infrastructure with cutting-edge dispensing equipment, innovative storage systems, and integrated software solutions to meet the changing preferences of consumers.
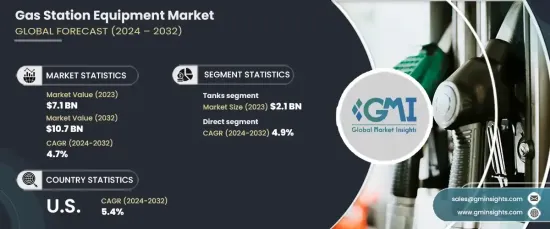
The market is segmented by type into tanks, fuel dispensers, nozzles, pumps, hoses, tire inflators, convenience store (C-store) equipment, and other related products. Among these, tanks hold the largest share, contributing USD 2.1 billion in 2023. They are projected to grow at a CAGR of 4.6% over the forecast period. Tanks are crucial for fuel storage and safety, making them an essential part of any gas station operation. Their ability to ensure compliance with regulations and minimize environmental risks reinforces their dominance in the market.
| Market Scope | |
|---|---|
| Start Year | 2023 |
| Forecast Year | 2024-2032 |
| Start Value | $7.1 Billion |
| Forecast Value | $10.7 Billion |
| CAGR | 4.7% |
In terms of distribution channels, the market is divided into direct and indirect segments. The direct segment led the market in 2023, holding a 52.6% share, and is expected to grow at a CAGR of 4.9% through 2032. Direct distribution channels are favored due to their ability to create stronger relationships between manufacturers and end-users. This approach allows for tailored solutions, faster delivery, and better after-sales service. Additionally, it provides manufacturers with real-time feedback, allowing for continuous improvement and enhanced customer satisfaction.
The U.S. gas station equipment market generated USD 1.4 billion in 2023 and is forecast to grow at a robust CAGR of 5.4% through 2032. The country's well-established fueling infrastructure and high vehicle ownership rates contribute to its dominant market position. Ongoing investments in cutting-edge fueling technologies, along with the expansion of EV charging networks, will further boost its market growth.
Table of Contents
Chapter 1 Methodology & Scope
- 1.1 Market scope & definition
- 1.2 Base estimates & calculations
- 1.3 Forecast parameters
- 1.4 Data sources
- 1.4.1 Primary
- 1.5 Secondary
- 1.5.1 Paid sources
- 1.5.2 Public sources
Chapter 2 Executive Summary
- 2.1 Industry synopsis, 2021 - 2032
Chapter 3 Industry Insights
- 3.1 Industry ecosystem analysis
- 3.1.1 Factor affecting the value chain
- 3.1.2 Profit margin analysis
- 3.1.3 Disruptions
- 3.1.4 Future outlook
- 3.1.5 Manufacturers
- 3.1.6 Distributors
- 3.2 Supplier landscape
- 3.3 Profit margin analysis
- 3.4 Key news & initiatives
- 3.5 Regulatory landscape
- 3.6 Technological landscape
- 3.7 Impact forces
- 3.7.1 Growth drivers
- 3.7.1.1 Increasing adoption of alternative fuels and EV charging infrastructure.
- 3.7.1.2 Technological advancements in fuel dispensing and automation systems.
- 3.7.1.3 Rising demand for energy-efficient and eco-friendly equipment.
- 3.7.1.4 Expanding transportation networks and urbanization
- 3.7.2 Industry pitfalls & challenges
- 3.7.2.1 High initial investment and maintenance costs.
- 3.7.2.2 Regulatory compliance and environmental concerns
- 3.7.1 Growth drivers
- 3.8 Growth potential analysis
- 3.9 Porter’s analysis
- 3.10 PESTEL analysis
Chapter 4 Competitive Landscape, 2023
- 4.1 Introduction
- 4.2 Company market share analysis
- 4.3 Competitive positioning matrix
- 4.4 Strategic outlook matrix
Chapter 5 Market Estimates and Forecast, By Type, 2021 – 2032 (USD Billion) (Thousand units)
- 5.1 Key trends
- 5.2 Tanks
- 5.3 Fuel dispensers
- 5.4 Nozzles
- 5.5 Pumps
- 5.6 Hoses
- 5.7 Tire inflators
- 5.8 C-Store equipment
- 5.9 Others (pump filters, etc.)
Chapter 6 Market Estimates and Forecast, By Fuel Type, 2021 – 2032 (USD Billion) (Thousand units)
- 6.1 Key trends
- 6.2 Gasoline
- 6.3 Diesel
- 6.4 Biofuel
- 6.5 Compressed Natural Gas (CNG)
- 6.6 Liquefied Natural Gas (LNG)
- 6.7 Hydrogen fueling
- 6.8 Others
Chapter 7 Market Estimates and Forecast, By End Use, 2021 – 2032 (USD Billion) (Thousand units)
- 7.1 Key trends
- 7.2 Retail gas stations
- 7.3 Commercial fleets
- 7.4 Aviation
- 7.5 Marine
- 7.6 Military
Chapter 8 Market Estimates & Forecast, By Distribution Channel, 2021 – 2032, (USD Billion) (Thousand units)
- 8.1 Key trends
- 8.2 Direct
- 8.3 Indirect
Chapter 9 Market Estimates & Forecast, By Region, 2021 – 2032, (USD Billion) (Thousand units)
- 9.1 Key trends
- 9.2 North America
- 9.2.1 U.S.
- 9.2.2 Canada
- 9.3 Europe
- 9.3.1 UK
- 9.3.2 Germany
- 9.3.3 France
- 9.3.4 Italy
- 9.3.5 Spain
- 9.4 Asia Pacific
- 9.4.1 China
- 9.4.2 Japan
- 9.4.3 India
- 9.4.4 Australia
- 9.5 Latin America
- 9.5.1 Brazil
- 9.5.2 Mexico
- 9.6 MEA
- 9.6.1 South Africa
- 9.6.2 Saudi Arabia
- 9.6.3 UAE
Chapter 10 Company Profiles (Business Overview, Financial Data, Product Landscape, Strategic Outlook, SWOT Analysis)
- 10.1 Beijing Sanki Petroleum Technology
- 10.2 Bennett Pump Company
- 10.3 Censtar Science and Technology Corp. Ltd.
- 10.4 China Hongyang
- 10.5 Dover Corporation
- 10.6 Franklin Fueling Systems
- 10.7 Gilbarco Veeder-Root
- 10.8 Jiangsu Furen Group
- 10.9 Korea EnE Co. Ltd.
- 10.10 Peltek
- 10.11 Tatsuno Corporation
- 10.12 Tokheim Group
- 10.13 U-Fuel Corporate HongYang Group
- 10.14 VeriFone
- 10.15 Wayne Fueling Systems

