
PUBLISHER: Global Market Insights Inc. | PRODUCT CODE: 1699338

PUBLISHER: Global Market Insights Inc. | PRODUCT CODE: 1699338
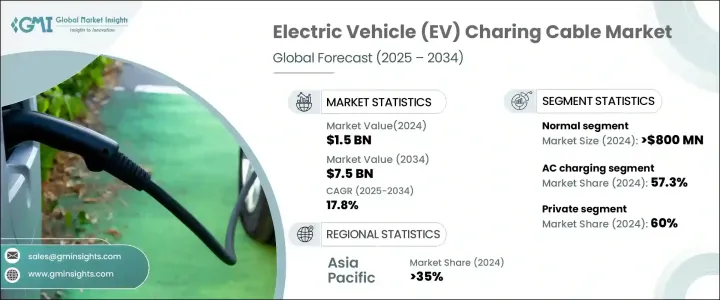
Electric Vehicle (EV) Charging Cable Market Opportunity, Growth Drivers, Industry Trend Analysis, and Forecast 2025-2034
The Global Electric Vehicle Charging Cable Market was valued at USD 1.5 billion in 2024 and is projected to grow at a CAGR of 17.8% between 2025 and 2034. The rapid expansion of the electric vehicle sector, driven by increasing consumer adoption and strong governmental support, is fueling the demand for reliable charging infrastructure. As nations worldwide push for greener transportation solutions, the need for high-quality charging cables is becoming more critical than ever.
Automakers are ramping up EV production, leading to a greater need for efficient charging solutions that support various charging speeds and vehicle types. Governments and private sector players are making significant investments in expanding public and private charging networks, further amplifying demand for EV charging cables. With advancements in battery technology and the shift toward fast-charging capabilities, the industry is witnessing a growing preference for high-power and liquid-cooled cables. Innovations in cable materials, improved durability, and enhanced safety features are also driving adoption, making charging cables a crucial component in the future of sustainable transportation.
| Market Scope | |
|---|---|
| Start Year | 2024 |
| Forecast Year | 2025-2034 |
| Start Value | $1.5 Billion |
| Forecast Value | $7.5 Billion |
| CAGR | 17.8% |
The electric vehicle charging cable market is categorized into normal, high-power, and liquid-cooled high-power cables. In 2024, the normal cable segment led the market, generating USD 800 million in revenue. This dominance can be attributed to the affordability and ease of manufacturing associated with these cables, making them a preferred choice for both automakers and consumers. Meanwhile, high-power cables are emerging as the fastest-growing segment, with a projected CAGR of approximately 19% from 2025 to 2034. These cables are increasingly essential in supporting ultra-fast charging stations, enabling EVs to recharge in significantly less time and improving user convenience.
Asia-Pacific held a 35% share of the EV charging cable market in 2024, with China leading the region by generating USD 249.9 million in revenue. The country's robust push for electric mobility, supported by favorable government policies and aggressive investments in charging infrastructure, has solidified its position as a key market driver. As the largest EV market in the world, China continues to set benchmarks in charging technology, influencing global trends in charging cable demand. The country's extensive EV adoption rates and rapid infrastructure development highlight the critical role of charging cables in enabling the widespread transition to electric transportation.
Table of Contents
Chapter 1 Methodology & Scope
- 1.1 Research design
- 1.1.1 Research approach
- 1.1.2 Data collection methods
- 1.2 Base estimates & calculations
- 1.2.1 Base year calculation
- 1.2.2 Key trends for market estimation
- 1.3 Forecast model
- 1.4 Primary research and validation
- 1.4.1 Primary sources
- 1.4.2 Data mining sources
- 1.5 Market scope & definition
Chapter 2 Executive Summary
- 2.1 Industry synopsis, 2021 - 2034
Chapter 3 Industry Insights
- 3.1 Industry ecosystem analysis
- 3.1.1 Raw material suppliers
- 3.1.2 Component suppliers
- 3.1.3 Manufacturers
- 3.1.4 Technology providers
- 3.1.5 End use
- 3.2 Supplier landscape
- 3.3 Profit margin analysis
- 3.4 Technology & innovation landscape
- 3.5 Patent analysis
- 3.6 Key news & initiatives
- 3.7 Regulatory landscape
- 3.8 Price trends
- 3.9 Cost breakdown analysis
- 3.10 Impact forces
- 3.10.1 Growth drivers
- 3.10.1.1 Rise of EVs
- 3.10.1.2 Government support
- 3.10.1.3 Demand for fast charging solutions
- 3.10.2 Industry pitfalls & challenges
- 3.10.2.1 High infrastructure costs
- 3.10.2.2 Market competition and pricing
- 3.10.1 Growth drivers
- 3.11 Growth potential analysis
- 3.12 Porter's analysis
- 3.13 PESTEL analysis
Chapter 4 Competitive Landscape, 2024
- 4.1 Introduction
- 4.2 Company market share analysis
- 4.3 Competitive positioning matrix
- 4.4 Strategic outlook matrix
Chapter 5 Market Estimates & Forecast, By Cable, 2021 - 2034 ($Bn, Units)
- 5.1 Key trends
- 5.2 Normal
- 5.3 High power
- 5.4 Liquid-cooled high power
Chapter 6 Market Estimates & Forecast, By Power, 2021 - 2034 ($Bn, Units)
- 6.1 Key trends
- 6.2 AC charging
- 6.3 DC charging
Chapter 7 Market Estimates & Forecast, By Cable Length, 2021 - 2034 ($Bn, Units)
- 7.1 Key trends
- 7.2 Below 5 meters
- 7.3 6-10 meters
- 7.4 Above 10 meters
Chapter 8 Market Estimates & Forecast, By Shape, 2021 - 2034 ($Bn, Units)
- 8.1 Key trends
- 8.2 Straight
- 8.3 Coiled
Chapter 9 Market Estimates & Forecast, By Charging Level, 2021 - 2034 ($Bn, Units)
- 9.1 Key trends
- 9.2 Level 1
- 9.3 Level 2
- 9.4 Level 3
Chapter 10 Market Estimates & Forecast, By Application, 2021 - 2034 ($Bn, Units)
- 10.1 Key trends
- 10.2 Public
- 10.3 Private
Chapter 11 Market Estimates & Forecast, By Jacket Material, 2021 - 2034 ($Bn, Units)
- 11.1 Key trends
- 11.2 All rubber
- 11.3 Thermoplastic Elastomer (TPE)
- 11.4 Polyvinyle Chlroide (PVC)
Chapter 12 Market Estimates & Forecast, By Connector, 2021 - 2034 ($Bn, Units)
- 12.1 Key trends
- 12.2 Type 1
- 12.3 Type 2
- 12.4 CCS1
- 12.5 CCS2
- 12.6 CHAdeMO
- 12.7 GB/T
- 12.8 NACS/TESLA Connectors
Chapter 13 Market Estimates & Forecast, By Diameter, 2021 - 2034 ($Bn, Units)
- 13.1 Key trends
- 13.2 10 mm
- 13.3 10-20 mm
- 13.4 >20mm
Chapter 14 Market Estimates & Forecast, By Mode, 2021 - 2034 ($Bn, Units)
- 14.1 Key trends
- 14.2 Mode 1 & 2
- 14.3 Mode 3
- 14.4 Mode 4
Chapter 15 Market Estimates & Forecast, By Region, 2021 - 2034 ($Bn, Units)
- 15.1 Key trends
- 15.2 North America
- 15.2.1 U.S.
- 15.2.2 Canada
- 15.3 Europe
- 15.3.1 UK
- 15.3.2 Germany
- 15.3.3 France
- 15.3.4 Italy
- 15.3.5 Spain
- 15.3.6 Russia
- 15.3.7 Nordics
- 15.4 Asia Pacific
- 15.4.1 China
- 15.4.2 India
- 15.4.3 Japan
- 15.4.4 Australia
- 15.4.5 South Korea
- 15.4.6 Southeast Asia
- 15.5 Latin America
- 15.5.1 Brazil
- 15.5.2 Mexico
- 15.5.3 Argentina
- 15.6 MEA
- 15.6.1 UAE
- 15.6.2 South Africa
- 15.6.3 Saudi Arabia
Chapter 16 Company Profiles
- 16.1 AG Electrical
- 16.2 Aptiv
- 16.3 Besen International
- 16.4 Brugg eConnect
- 16.5 Chengdu Khons
- 16.6 Coroplast
- 16.7 Dyden
- 16.8 Eland Cable
- 16.9 EV Cable
- 16.10 General Cable Technologies
- 16.11 Guangdong OMG
- 16.12 HUBER+SUHNER
- 16.13 Leoni AG
- 16.14 Mennekes Elektrotechnik
- 16.15 Phoenix Contact
- 16.16 Sinbon Electronics
- 16.17 Suzlon Cable
- 16.18 Systems Wire Cables
- 16.19 TE Connectivity
- 16.20 Teison Energy Technology

