PUBLISHER: Global Market Insights Inc. | PRODUCT CODE: 1699398

PUBLISHER: Global Market Insights Inc. | PRODUCT CODE: 1699398
Floating Offshore Wind Energy Market Opportunity, Growth Drivers, Industry Trend Analysis, and Forecast 2025-2034
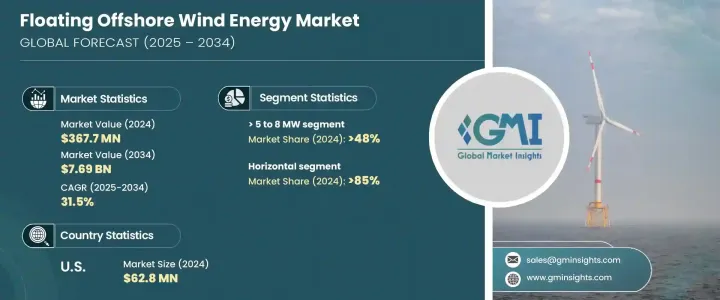
The Global Floating Offshore Wind Energy Market was valued at USD 367.7 million in 2024 and is projected to expand at a robust CAGR of 31.5% from 2025 to 2034. The market's rapid growth is fueled by favorable government policies, including technology-specific quotas, set tariffs, and competitive auctions designed to strengthen the industry. Many countries are actively implementing strategies to accelerate the deployment of floating offshore wind projects, recognizing their potential in addressing the world's increasing demand for renewable energy solutions. With the global shift toward clean energy, investments in offshore wind technology are gaining momentum as nations strive to meet ambitious carbon neutrality goals.

Floating offshore wind technology presents a viable solution to several challenges associated with traditional fixed-bottom wind farms, particularly in regions with deep waters where conventional installations are not feasible. The ability to harness stronger and more consistent wind resources in deep-sea locations is a significant advantage, making floating wind farms an attractive option for large-scale power generation. Continuous advancements in material sciences, turbine efficiency, and floating platform designs are expected to drive down costs, making the technology more accessible to developers worldwide. Additionally, as energy security concerns grow, governments and corporations are increasingly looking toward offshore wind as a long-term solution to diversify energy sources and reduce dependency on fossil fuels.
| Market Scope | |
|---|---|
| Start Year | 2024 |
| Forecast Year | 2025-2034 |
| Start Value | $367.7 Million |
| Forecast Value | $7.69 Billion |
| CAGR | 31.5% |
In 2024, the horizontal floating offshore wind turbine segment accounted for a dominant market share of 85%. This segment's leadership can be attributed to its high efficiency, streamlined production processes, and ease of maintenance, making it a preferred choice for developers. The sector is witnessing significant investment in research and development to enhance floating platform design and performance. With continuous improvements in materials and manufacturing techniques, floating wind turbines are becoming more cost-effective and durable, driving further demand for these systems.
The floating offshore wind energy market is categorized based on turbine capacity, with segments ranging from >2 MW to >12 MW. The >10 to 12 MW category is expected to register the fastest growth, projected at a CAGR of 54% through 2034. The industry's focus on increasing turbine size and efficiency is critical in lowering overall energy production costs. By developing higher-capacity turbines, companies can generate more electricity with fewer units, leading to substantial cost reductions. Significant investments in cutting-edge turbine designs, advanced control systems, and innovative materials are further propelling this market segment's growth.
North America floating offshore wind energy market generated USD 62.8 million in 2024. The sector is experiencing accelerated expansion due to supportive government regulations and incentives promoting renewable energy projects. As turbine prices decline and industry capacity expands, demand for floating offshore wind energy continues to rise. The United States is emerging as a key player in the global energy transition, investing heavily in offshore wind energy to meet its renewable energy targets and strengthen its position in the clean energy landscape.
Table of Contents
Chapter 1 Methodology & Scope
- 1.1 Research design
- 1.2 Base estimates & calculations
- 1.3 Forecast model
- 1.4 Primary research & validation
- 1.4.1 Primary sources
- 1.4.2 Data mining sources
- 1.5 Market definitions
Chapter 2 Executive Summary
- 2.1 Industry 3600 synopsis, 2021 – 2034
Chapter 3 Industry Insights
- 3.1 Industry ecosystem
- 3.2 Regulatory landscape
- 3.3 Industry impact forces
- 3.3.1 Growth drivers
- 3.3.2 Industry pitfalls & challenges
- 3.4 Growth potential analysis
- 3.5 Price trend analysis
- 3.6 Porter's analysis
- 3.6.1 Bargaining power of suppliers
- 3.6.2 Bargaining power of buyers
- 3.6.3 Threat of new entrants
- 3.6.4 Threat of substitutes
- 3.7 PESTEL analysis
Chapter 4 Competitive landscape, 2024
- 4.1 Introduction
- 4.2 Strategic dashboard
- 4.3 Innovation & technology landscape
Chapter 5 Market Size and Forecast, By Turbine Rating, 2021 – 2034 (USD Million & MW)
- 5.1 Key trends
- 5.2 ≤ 2 MW
- 5.3 >2 to 5 MW
- 5.4 >5 to 8 MW
- 5.5 >8 to 10 MW
- 5.6 >10 to 12 MW
- 5.7 > 12 MW
Chapter 6 Market Size and Forecast, By Axis, 2021 – 2034 (USD Million & MW)
- 6.1 Key trends
- 6.2 Horizontal
- 6.2.1 Up-wind
- 6.2.2 Downwind
- 6.3 Vertical
Chapter 7 Market Size and Forecast, By Component, 2021 – 2034 (USD Million & MW)
- 7.1 Key trends
- 7.2 Blade
- 7.3 Tower
- 7.4 Others
Chapter 8 Market Size and Forecast, By Depth, 2021 – 2034 (USD Million & MW)
- 8.1 Key trends
- 8.2 ≤ 30 m
- 8.3 >30 m to ≤ 50 m
- 8.4 > 50 m
Chapter 9 Market Size and Forecast, By Region, 2021 – 2034 (USD Million & MW)
- 9.1 Key trends
- 9.2 North America
- 9.2.1 U.S.
- 9.2.2 Canada
- 9.3 Europe
- 9.3.1 Germany
- 9.3.2 UK
- 9.3.3 France
- 9.3.4 Sweden
- 9.3.5 Poland
- 9.3.6 Denmark
- 9.3.7 Portugal
- 9.3.8 Ireland
- 9.3.9 Belgium
- 9.4 Asia Pacific
- 9.4.1 China
- 9.4.2 India
- 9.4.3 Japan
- 9.4.4 South Korea
- 9.4.5 Vietnam
- 9.5 Rest of World
Chapter 10 Company Profiles
- 10.1 Equinor ASA
- 10.2 General Electric
- 10.3 Global Energy (Group) Limited
- 10.4 Hexicon
- 10.5 Nexans
- 10.6 Ørsted
- 10.7 Prysmian Group
- 10.8 RWE
- 10.9 Sumitomo Electric Industries
- 10.10 Simply Blue Group
- 10.11 Siemens Gamesa Renewable Energy
- 10.12 Vattenfall AB
- 10.13 Vestas


