
PUBLISHER: Global Market Insights Inc. | PRODUCT CODE: 1885922

PUBLISHER: Global Market Insights Inc. | PRODUCT CODE: 1885922
Green Ammonia Market Opportunity, Growth Drivers, Industry Trend Analysis, and Forecast 2024 - 2032
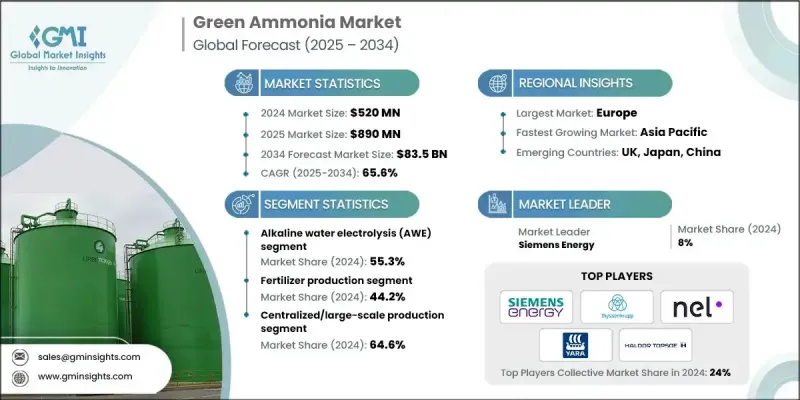
The Global Green Ammonia Market was valued at USD 520 million in 2024 and is estimated to grow at a CAGR of 65.6% to reach USD 83.5 billion by 2034.
Green ammonia is rapidly emerging as a cornerstone of the global energy transition, playing a critical role in energy-chemical value chains by enabling hydrogen storage, coupling with renewable energy, and serving as a zero-carbon fuel for hard-to-decarbonize sectors such as shipping. Its strategic importance lies in leveraging existing ammonia infrastructure to accelerate scale-up while meeting decarbonization targets. Market growth is propelled by supportive policy frameworks, climate neutrality goals, and certification schemes for green energy. Technological advancements, particularly in electrolysis-based hydrogen production powered by renewables, are improving cost efficiency and operational performance. Corporate commitments from energy majors, fertilizer producers, and maritime operators are further driving investment, positioning green ammonia as a key element of long-term sustainability strategies. Regional trends indicate Asia-Pacific leading in renewable capacity and export projects, while Europe benefits from regulatory support and established green hydrogen corridors.
| Market Scope | |
|---|---|
| Start Year | 2024 |
| Forecast Year | 2025-2034 |
| Start Value | $520 Million |
| Forecast Value | $83.5 Billion |
| CAGR | 65.6% |
The alkaline water electrolysis (AWE) segment held a 55.3% share in 2024 and is expected to grow at a CAGR of 60.3% through 2034. AWE remains the most cost-effective and mature technology for large-scale renewable energy-linked projects. Proton exchange membrane (PEM) electrolysis offers operational flexibility and rapid response to variable renewable electricity, making it ideal for grid-tied and hybrid energy systems.
The fertilizer production segment held a 44.2% share in 2024 and is projected to grow at a CAGR of 56.2% by 2034. Fermentation-based approaches are well-established for producing bio-platform chemicals, offering high selectivity, mild operating conditions, and efficient production of complex molecules at scale.
North America Green Ammonia Market accounted for a 25.9% share in 2024. The region is emerging as a key production hub due to abundant renewable energy resources, supportive policies, and existing ammonia infrastructure that facilitates rapid adoption of low-carbon alternatives.
Major companies in the Global Green Ammonia Market include Yara International, Siemens Energy, BASF SE, Air Products Inc., Haldor Topsoe, MAN Energy Solutions, Starfire Energy, Technip Energies NV, ThyssenKrupp AG, Nel ASA (Hydrogenics), Hydrogenics, Kapsom, Hiringa Energy, and Uniper ENGIE. Market players are strengthening their position by investing in R&D to improve electrolysis efficiency and reduce production costs. They are forming strategic partnerships with renewable energy providers and industrial consumers to secure long-term offtake agreements. Companies are also exploring modular and large-scale production facilities to optimize logistics and infrastructure utilization. Integration of digital monitoring and advanced control systems is enhancing operational performance and reliability. Additionally, mergers, acquisitions, and joint ventures are being employed to expand geographic footprint, accelerate commercialization, and capture growing demand in both established and emerging green ammonia markets.
Table of Contents
Chapter 1 Methodology & Scope
- 1.1 Market scope and definition
- 1.2 Research design
- 1.2.1 Research approach
- 1.2.2 Data collection methods
- 1.3 Data mining sources
- 1.3.1 Global
- 1.3.2 Regional/Country
- 1.4 Base estimates and calculations
- 1.4.1 Base year calculation
- 1.4.2 Key trends for market estimation
- 1.5 Primary research and validation
- 1.5.1 Primary sources
- 1.6 Forecast model
- 1.7 Research assumptions and limitations
Chapter 2 Executive Summary
- 2.1 Industry 360° synopsis
- 2.2 Key market trends
- 2.2.1 Regional
- 2.2.2 Technology type
- 2.2.3 Application
- 2.2.4 Production mode
- 2.3 TAM Analysis, 2025-2034
- 2.4 CXO perspectives: Strategic imperatives
- 2.4.1 Executive decision points
- 2.4.2 Critical success factors
- 2.5 Future Outlook and Strategic Recommendations
Chapter 3 Industry Insights
- 3.1 Industry ecosystem analysis
- 3.1.1 Supplier landscape
- 3.1.2 Profit margin
- 3.1.3 Value addition at each stage
- 3.1.4 Factor affecting the value chain
- 3.1.5 Disruptions
- 3.2 Industry impact forces
- 3.2.1 Growth drivers
- 3.2.1.1 Global decarbonization targets & net-zero commitments
- 3.2.1.2 Maritime industry's transition to zero-carbon fuels
- 3.2.1.3 Government incentives & subsidy programs
- 3.2.2 Industry pitfalls and challenges
- 3.2.2.1 High capital investment requirements
- 3.2.2.2 Technological maturity & scale-up challenges
- 3.2.3 Market opportunities
- 3.2.3.1 Retrofitting existing ammonia production facilities
- 3.2.3.2 Small-scale distributed production systems
- 3.2.1 Growth drivers
- 3.3 Growth potential analysis
- 3.4 Regulatory landscape
- 3.4.1 North America
- 3.4.2 Europe
- 3.4.3 Asia Pacific
- 3.4.4 Latin America
- 3.4.5 Middle East & Africa
- 3.5 Porter's analysis
- 3.6 PESTEL analysis
- 3.7 Price trends
- 3.7.1 By region
- 3.7.2 By electrolyzer technology type
- 3.8 Future market trends
- 3.9 Technology and Innovation landscape
- 3.9.1 Current technological trends
- 3.9.2 Emerging technologies
- 3.10 Patent Landscape
- 3.11 Trade statistics (HS code) ( Note: the trade statistics will be provided for key countries only)
- 3.11.1 Major importing countries
- 3.11.2 Major exporting countries
- 3.12 Sustainability and environmental aspects
- 3.12.1 Sustainable practices
- 3.12.2 Waste reduction strategies
- 3.12.3 Energy efficiency in production
- 3.12.4 Eco-friendly initiatives
- 3.13 Carbon footprint consideration
Chapter 4 Competitive Landscape, 2024
- 4.1 Introduction
- 4.2 Company market share analysis
- 4.2.1 By region
- 4.2.1.1 North America
- 4.2.1.2 Europe
- 4.2.1.3 Asia Pacific
- 4.2.1.4 LATAM
- 4.2.1.5 MEA
- 4.2.1 By region
- 4.3 Company matrix analysis
- 4.4 Competitive analysis of major market players
- 4.5 Competitive positioning matrix
- 4.6 Key developments
- 4.6.1 Mergers & acquisitions
- 4.6.2 Partnerships & collaborations
- 4.6.3 New Product Launches
- 4.6.4 Expansion Plans
Chapter 5 Market Estimates and Forecast, By Technology Type, 2021-2034 (USD Million)
- 5.1 Key trends
- 5.2 Alkaline water electrolysis (AWE)
- 5.3 Proton exchange membrane (PEM) electrolysis
- 5.4 Solid oxide electrolyzer cell (SOEC)
- 5.5 Anion exchange membrane (AEM)
Chapter 6 Market Estimates and Forecast, By Application, 2021-2034 (USD Million)
- 6.1 Key trends
- 6.2 Fertilizer production
- 6.3 Maritime fuel & shipping
- 6.4 Hydrogen carrier & storage
- 6.5 Industrial feedstock & chemicals
- 6.6 Power generation & energy storage
Chapter 7 Market Estimates and Forecast, By Production Mode, 2021-2034 (USD Million)
- 7.1 Key trends
- 7.2 On-site/distributed production
- 7.3 Centralized/large-scale production
Chapter 8 Market Estimates and Forecast, By Region, 2021-2034 (USD Million)
- 8.1 Key trends
- 8.2 North America
- 8.2.1 U.S.
- 8.2.2 Canada
- 8.3 Europe
- 8.3.1 Germany
- 8.3.2 UK
- 8.3.3 France
- 8.3.4 Spain
- 8.3.5 Italy
- 8.3.6 Rest of Europe
- 8.4 Asia Pacific
- 8.4.1 China
- 8.4.2 India
- 8.4.3 Japan
- 8.4.4 Australia
- 8.4.5 South Korea
- 8.4.6 Rest of Asia Pacific
- 8.5 Latin America
- 8.5.1 Brazil
- 8.5.2 Mexico
- 8.5.3 Argentina
- 8.5.4 Rest of Latin America
- 8.6 Middle East and Africa
- 8.6.1 Saudi Arabia
- 8.6.2 South Africa
- 8.6.3 UAE
- 8.6.4 Rest of Middle East and Africa
Chapter 9 Company Profiles
- 9.1 Siemens Energy
- 9.2 ThyssenKrupp AG
- 9.3 Nel ASA (Hydrogenics)
- 9.4 Yara International
- 9.5 Haldor Topsoe
- 9.6 Air Products Inc
- 9.7 BASF SE
- 9.8 Hiringa Energy
- 9.9 Hydrogenics
- 9.10 Kapsom
- 9.11 MAN Energy Solutions
- 9.12 Starfire Energy
- 9.13 Technip Energies NV
- 9.14 Uniper ENGIE

