
PUBLISHER: Global Market Insights Inc. | PRODUCT CODE: 1716692

PUBLISHER: Global Market Insights Inc. | PRODUCT CODE: 1716692
Onshore Wind Energy Market Opportunity, Growth Drivers, Industry Trend Analysis, and Forecast 2025 - 2034
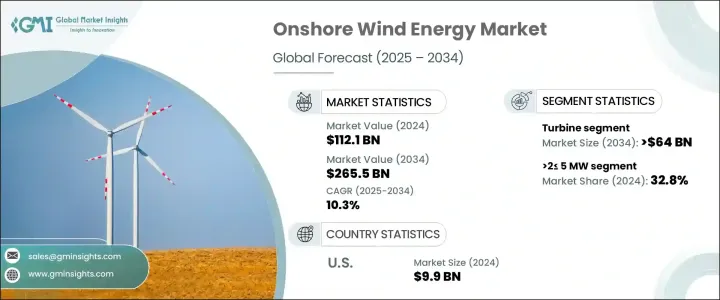
The Global Onshore Wind Energy Market was valued at USD 112.1 billion in 2024 and is projected to grow at a CAGR of 10.3% between 2025 and 2034. This growth is largely fueled by a surge in demand for clean, renewable energy sources, combined with government-backed initiatives aimed at reducing carbon emissions and supporting sustainable development goals. Countries worldwide are ramping up efforts to transition away from fossil fuels, and onshore wind energy stands out as one of the most cost-effective and scalable solutions. As economies worldwide face increasing pressure to meet their renewable energy targets, onshore wind projects are gaining momentum, driven by favorable regulatory frameworks, declining technology costs, and improved efficiency of modern wind turbines.
Policymakers are introducing streamlined permitting processes, offering tax credits, and deploying incentive programs to foster wind energy development, creating a highly conducive environment for market players to expand their portfolios. In addition, technological innovations in turbine design and control systems are significantly improving capacity factors and reducing the levelized cost of energy (LCOE), making onshore wind projects more financially viable. As climate goals tighten and energy demand soars, particularly across emerging economies, the global market is on track to witness substantial capacity additions over the next decade.
| Market Scope | |
|---|---|
| Start Year | 2024 |
| Forecast Year | 2025-2034 |
| Start Value | $112.1 Billion |
| Forecast Value | $265.5 Billion |
| CAGR | 10.3% |
The steady implementation of federal and state-level incentives, robust government mandates, and aggressive renewable energy targets are acting as strong growth catalysts for the onshore wind energy market. Rapid urbanization, industrial expansion, and increasing energy consumption, especially in developing regions, are further accelerating the deployment of onshore wind projects. Countries such as Brazil, Mexico, and Argentina are emerging as promising markets, offering not only abundant wind resources but also proactive government support and attractive investment frameworks. These countries are witnessing a growing number of project announcements and foreign investments aimed at expanding their wind energy infrastructure. Parallel investments in modernizing grid infrastructure are facilitating better integration of wind power into national energy systems, enhancing the reliability and efficiency of wind-generated electricity.
The onshore wind energy market is segmented into turbines, support structures, electrical infrastructure, and others, with turbines dominating as the leading component. The turbine segment alone is anticipated to generate USD 64 billion by 2034, propelled by the increasing demand for high-capacity, efficient turbines that align with stringent renewable energy mandates. Advancements in turbine technology, including taller towers, longer blades, and sophisticated grid integration capabilities, are enabling higher energy outputs and greater adaptability to diverse wind conditions, making onshore wind installations more attractive for investors and utilities alike.
In terms of turbine rating, systems ranging from 2 MW to 5 MW held 32.8% of the market share in 2024, owing to their optimal balance between capacity, cost, and grid compatibility. These turbines are particularly favored for projects requiring moderate output with spatial or technical constraints. Enhanced control systems and advanced software integrations are also boosting turbine performance, improving energy yields, and minimizing downtime.
North America accounted for 8.6% of the global onshore wind energy market share in 2024, backed by long-term federal incentives and advancements in wind power technology cost-effectiveness. With continuous policy support and technology improvements, North America remains a pivotal region driving future market growth.
Table of Contents
Chapter 1 Methodology & Scope
- 1.1 Research Design
- 1.2 Base estimates & calculations
- 1.3 Forecast model
- 1.4 Primary research & validation
- 1.4.1 Primary sources
- 1.4.2 Data mining sources
- 1.5 Market Definitions
Chapter 2 Executive Summary
- 2.1 Industry synopsis, 2021 – 2034
Chapter 3 Industry Insights
- 3.1 Industry ecosystem
- 3.2 Regulatory landscape
- 3.3 Industry impact forces
- 3.3.1 Growth drivers
- 3.3.2 Industry pitfalls & challenges
- 3.4 Growth potential analysis
- 3.5 Porter's analysis
- 3.5.1 Bargaining power of suppliers
- 3.5.2 Bargaining power of buyers
- 3.5.3 Threat of new entrants
- 3.5.4 Threat of substitutes
- 3.6 PESTEL analysis
Chapter 4 Competitive landscape, 2024
- 4.1 Introduction
- 4.2 Strategic dashboard
- 4.3 Innovation & technology landscape
Chapter 5 Market Size and Forecast, By Component, 2021 – 2034 (USD Million)
- 5.1 Key trends
- 5.2 Turbine
- 5.2.1 Tower
- 5.2.2 Blades
- 5.2.3 Others
- 5.3 Support structure
- 5.3.1 Substructure steel
- 5.3.2 Foundation
- 5.3.3 Others
- 5.4 Electrical infrastructure
- 5.4.1 Wires & Cables
- 5.4.2 Substation
- 5.4.3 Others
- 5.5 Others
Chapter 6 Market Size and Forecast, By Turbine Rating, 2021 – 2034 (USD Million & MW)
- 6.1 Key trends
- 6.2 ≤ 2 MW
- 6.3 >2≤ 5 MW
- 6.4 >5≤ 8 MW
- 6.5 >8≤10 MW
- 6.6 >10≤ 12 MW
- 6.7 > 12 MW
Chapter 7 Market Size and Forecast, By Region, 2021 – 2034 (USD Million & MW)
- 7.1 Key trends
- 7.2 North America
- 7.2.1 U.S.
- 7.2.2 Canada
- 7.3 Europe
- 7.3.1 Germany
- 7.3.2 Netherlands
- 7.3.3 Sweden
- 7.3.4 France
- 7.3.5 UK
- 7.3.6 Finland
- 7.3.7 Poland
- 7.3.8 Spain
- 7.3.9 Italy
- 7.3.10 Austria
- 7.3.11 Ireland
- 7.3.12 Belgium
- 7.4 Asia Pacific
- 7.4.1 China
- 7.4.2 India
- 7.4.3 Japan
- 7.4.4 Australia
- 7.5 Rest of World
Chapter 8 Company Profiles
- 8.1 CRRC
- 8.2 CSSC Haizhuang Wind Power
- 8.3 Envision Group
- 8.4 Goldwind
- 8.5 GE Vernova
- 8.6 Iberdrola
- 8.7 Nordex
- 8.8 Siemens Gamesa Renewable Energy
- 8.9 United Power
- 8.10 Vestas
- 8.11 Windey Energy Technology Group

