
PUBLISHER: Global Market Insights Inc. | PRODUCT CODE: 1833645

PUBLISHER: Global Market Insights Inc. | PRODUCT CODE: 1833645
Oil Filled Power Transformer Market Opportunity, Growth Drivers, Industry Trend Analysis, and Forecast 2025 - 2034
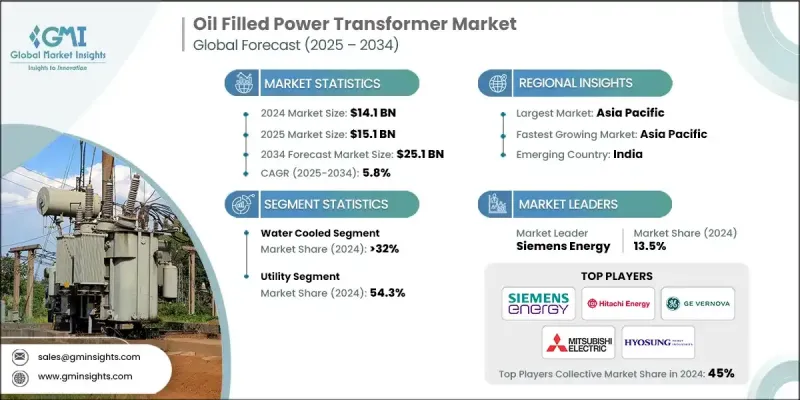
The oil filled power transformer market was estimated at USD 14.1 billion in 2024 and is expected to grow from USD 15.1 billion in 2025 to USD 25.1 billion by 2034, at a CAGR of 5.8%, as per the latest report published by Global Market Insights Inc.
The increasing global reliance on electricity, driven by rapid urbanization, industrial development, and digital infrastructure, has placed enormous pressure on existing power grids. In both developed and emerging economies, the need for a consistent, uninterrupted power supply has become critical, particularly in sectors like manufacturing, transportation, data centers, and healthcare.
| Market Scope | |
|---|---|
| Start Year | 2024 |
| Forecast Year | 2025-2034 |
| Start Value | $14.1 Billion |
| Forecast Value | $25.1 Billion |
| CAGR | 5.8% |
Rising Adoption of Water-Cooled Transformers
The water-cooled segment held a significant share in 2024, particularly in applications that demand high-capacity cooling and space optimization. These systems use water as a secondary cooling medium alongside oil, allowing for superior thermal management in compact installations or hot climates. Utilities and heavy industries prefer water-cooled transformers where air circulation is limited or where noise restrictions apply. To capitalize on this segment, manufacturers are enhancing cooling efficiency, integrating smart sensors for thermal monitoring, and offering modular designs that simplify installation and maintenance.
Utility to Gain Traction
The utility segment held a sustainable share in 2024, driven by the constant need to expand, upgrade, and stabilize national transmission and distribution networks. Power utilities rely on oil-filled transformers for their proven reliability, load-handling capacity, and long operational life-especially in high-voltage applications. With the rising integration of renewable energy sources and aging infrastructure in many countries, the utility sector is investing heavily in transformer upgrades.
Asia Pacific to Emerge as a Lucrative Region
Asia Pacific oil-filled power transformer market held a sizeable share in 2024, fueled by rapid industrialization, population growth, and massive investments in power infrastructure. Countries like China, India, and Indonesia are expanding their grid networks to meet rising electricity demand, while also modernizing outdated systems to reduce losses and improve efficiency. The market in this region is highly dynamic, with local manufacturing, government-backed electrification projects, and strong public-private partnerships driving momentum.
Major players in the oil filled power transformer market are KPRS, Siemens Energy, LS ELECTRIC, Daelim Transformer, Fuji Electric, CG Power & Industrial Solutions, Hitachi Energy, Ormazabal, Bharat Heavy Electricals Limited (BHEL), SGB SMIT, GE Vernova, Toshiba Energy Systems & Solutions Corporation, Bharat Bijlee Limited, Elsewedy Electric, Mitsubishi Electric, Kirloskar Electric Company, Celme, Hyosung Heavy Industries, Eaton, Schneider Electric.
To solidify their presence, leading manufacturers in oil-filled power transformer market is pursuing a multi-pronged strategy focused on innovation, regional expansion, and digital integration. Many are investing in R&D to develop high-efficiency cores, advanced insulation materials, and compact designs that cater to evolving grid demands. Strategic collaborations with utility providers and EPC contractors are enabling turnkey project capabilities and long-term service agreements.
Table of Contents
Chapter 1 Methodology & Scope
- 1.1 Research design
- 1.1.1 Research approach
- 1.1.2 Data Collection methods
- 1.2 Base estimates & calculations
- 1.2.1 Base year calculations
- 1.2.2 Key trends for market estimation
- 1.3 Forecast model
- 1.4 Primary research and validation
- 1.4.1 Primary sources
- 1.4.2 Data mining sources
- 1.5 Market definitions
Chapter 2 Executive Summary
- 2.1 Industry synopsis, 2021 - 2034
- 2.1.1 Business trends
- 2.1.2 Technology trends
- 2.1.3 Rating trends
- 2.1.4 Application trends
- 2.1.5 Regional trends
Chapter 3 Industry Insights
- 3.1 Industry ecosystem analysis
- 3.2 Regulatory landscape
- 3.3 Import export trade analysis
- 3.3.1 Key importing countries
- 3.3.2 Key exporting countries
- 3.4 Price trend analysis, (USD/Unit)
- 3.4.1 By technology
- 3.5 Cost analysis of oil filled power transformers
- 3.6 Industry impact forces
- 3.6.1 Growth drivers
- 3.6.2 Industry pitfalls & challenges
- 3.7 Growth potential analysis
- 3.8 Porter's analysis
- 3.8.1 Bargaining power of suppliers
- 3.8.2 Bargaining power of buyers
- 3.8.3 Threat of new entrants
- 3.8.4 Threat of substitutes
- 3.9 PESTEL analysis
Chapter 4 Competitive landscape, 2025
- 4.1 Introduction
- 4.2 Company market share analysis, by region, 2024
- 4.2.1 North America
- 4.2.2 Europe
- 4.2.3 Asia Pacific
- 4.2.4 Middle East & Africa
- 4.2.5 Latin America
- 4.3 Strategic dashboard
- 4.4 Strategic initiatives
- 4.5 Competitive benchmarking
- 4.6 Innovation & technology landscape
Chapter 5 Market Size and Forecast, By Technology, 2021 - 2034 (Units & USD Million)
- 5.1 Key trends
- 5.2 Self-Cooled
- 5.3 Water Cooled
- 5.4 Forced Oil
- 5.5 Others
Chapter 6 Market Size and Forecast, By Rating, 2021 - 2034 (Units & USD Million)
- 6.1 Key trends
- 6.2 ≤ 100 MVA
- 6.3 > 100 MVA to ≤ 500 MVA
- 6.4 > 500 MVA to ≤ 800 MVA
- 6.5 > 800 MVA
Chapter 7 Market Size and Forecast, By Application, 2021 - 2034 (Units & USD Million)
- 7.1 Key trends
- 7.2 Residential
- 7.3 Commercial & industrial
- 7.4 Utility
Chapter 8 Market Size and Forecast, By Region, 2021 - 2034 (Units & USD Million)
- 8.1 Key trends
- 8.2 North America
- 8.2.1 U.S.
- 8.2.2 Canada
- 8.2.3 Mexico
- 8.3 Europe
- 8.3.1 Germany
- 8.3.2 France
- 8.3.3 Russia
- 8.3.4 UK
- 8.3.5 Italy
- 8.3.6 Spain
- 8.3.7 Netherlands
- 8.4 Asia Pacific
- 8.4.1 China
- 8.4.2 Japan
- 8.4.3 South Korea
- 8.4.4 India
- 8.4.5 Australia
- 8.5 Middle East & Africa
- 8.5.1 Saudi Arabia
- 8.5.2 UAE
- 8.5.3 Qatar
- 8.5.4 Egypt
- 8.5.5 South Africa
- 8.5.6 Nigeria
- 8.6 Latin America
- 8.6.1 Brazil
- 8.6.2 Peru
- 8.6.3 Argentina
Chapter 9 Company Profiles
- 9.1 Bharat Heavy Electricals Limited (BHEL)
- 9.2 Bharat Bijlee Limited
- 9.3 Celme
- 9.4 CG Power & Industrial Solutions
- 9.5 Daelim Transformer
- 9.6 Eaton
- 9.7 Elsewedy Electric
- 9.8 Fuji Electric
- 9.9 GE Vernova
- 9.10 Hitachi Energy
- 9.11 Hyosung Heavy Industries
- 9.12 Kirloskar Electric Company
- 9.13 KPRS
- 9.14 LS ELECTRIC
- 9.15 Mitsubishi Electric
- 9.16 Ormazabal
- 9.17 Schneider Electric
- 9.18 SGB SMIT
- 9.19 Siemens Energy
- 9.20 Toshiba Energy Systems & Solutions Corporation

