
PUBLISHER: Global Market Insights Inc. | PRODUCT CODE: 1859017

PUBLISHER: Global Market Insights Inc. | PRODUCT CODE: 1859017
Ammonium Nitrate Market Opportunity, Growth Drivers, Industry Trend Analysis, and Forecast 2025 - 2034
The Global Ammonium Nitrate Market was valued at USD 16.2 billion in 2024 and is estimated to grow at a CAGR of 3.8% to reach USD 23.5 billion by 2034.
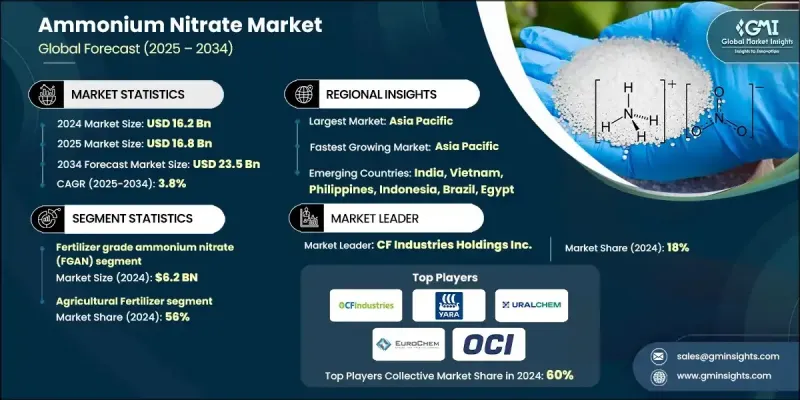
Market growth is driven by ammonium nitrate's dual use as a key agricultural fertilizer and an essential component in industrial explosives. Various macroeconomic factors, including the stabilization of natural gas prices, which directly affect nitrogen production costs, are influencing the trajectory of the industry. In addition, the market is experiencing a surge in technological advancements that focus on improving safety and sustainability. For instance, artificial intelligence is being integrated into automated systems for loading and blast optimization, enhancing both efficiency and safety. The industry is also responding to rapidly evolving regulations, particularly those related to safety and security, which are shaping operational procedures. Another major trend is the restructuring of supply chains, with Asian producers expanding rapidly and European producers facing capacity constraints. As a result, the Asia-Pacific region has now overtaken Europe, capturing a 35% share of the market. This shift is largely due to high demand from both the agricultural sector, particularly in countries like India and China, and from major mining and construction projects.
| Market Scope | |
|---|---|
| Start Year | 2024 |
| Forecast Year | 2025-2034 |
| Start Value | $16.2 Billion |
| Forecast Value | $23.5 Billion |
| CAGR | 3.8% |
The fertilizer-grade ammonium nitrate (FGAN) segment generated USD 6.2 billion in 2024, expected to reach USD 8.9 billion by 2034, growing at a CAGR of 3.9%. This segment is the largest in the ammonium nitrate market, accounting for approximately 38% of the global market share. The significant demand for FGAN can be attributed to its essential role in increasing crop yields, especially in developing nations where nitrogenous fertilizers are vital to agricultural productivity. As global food demand continues to rise alongside population growth, the demand for fertilizers like FGAN is expected to grow, particularly as the need for efficient farming techniques intensifies.
The agricultural fertilizers segment held a 56% share in 2024, driven by the essential role ammonium nitrate plays in nitrogen-based farming systems, where it is a primary source of nitrogen, a critical nutrient for plant growth. Nitrogen fertilizers, particularly Fertilizer Grade Ammonium Nitrate (FGAN) and Calcium Ammonium Nitrate (CAN), are widely used to enhance soil fertility and increase crop yields, especially in regions with limited arable land.
China Ammonium Nitrate Market generated USD 3.2 billion in 2024 and is projected to grow at a CAGR of 4.1% to reach USD 4.9 billion by 2034. This growth is driven by modernization efforts in agriculture and ongoing food security programs in the country. Additionally, infrastructure projects across Southeast Asia are expected to contribute to the long-term demand for industrial explosives, which will, in turn, boost the ammonium nitrate market in the region.
Key players in the Global Ammonium Nitrate Market include OCI N.V., CF Industries Holdings Inc., EuroChem Group AG, URALCHEM JSC, and Yara International ASA. In the ammonium nitrate market, companies focus on a variety of strategies to strengthen their market presence and maintain competitiveness. These strategies include expanding their production capacities, especially in emerging markets, to meet rising demand. Many companies are also investing heavily in technological innovations to enhance production efficiency and improve safety standards. Additionally, companies are pursuing mergers and acquisitions to diversify their product portfolios and expand their market reach. They are also forming strategic partnerships to integrate sustainability into their operations, ensuring regulatory compliance while meeting growing environmental standards.
Table of Contents
Chapter 1 Methodology & Scope
- 1.1 Market scope and definition
- 1.2 Research design
- 1.2.1 Research approach
- 1.2.2 Data collection methods
- 1.3 Data mining sources
- 1.3.1 Global
- 1.3.2 Regional/Country
- 1.4 Base estimates and calculations
- 1.4.1 Base year calculation
- 1.4.2 Key trends for market estimation
- 1.5 Primary research and validation
- 1.5.1 Primary sources
- 1.6 Forecast model
- 1.7 Research assumptions and limitations
Chapter 2 Executive Summary
- 2.1 Industry 3600 synopsis
- 2.2 Key market trends
- 2.2.1 Regional
- 2.2.2 Product type
- 2.2.3 Application
- 2.2.4 End use industry
- 2.3 TAM Analysis, 2025-2034
- 2.4 CXO perspectives: Strategic imperatives
- 2.4.1 Executive decision points
- 2.4.2 Critical success factors
- 2.5 Future Outlook and Strategic Recommendations
Chapter 3 Industry Insights
- 3.1 Industry ecosystem analysis
- 3.1.1 Supplier Landscape
- 3.1.2 Profit Margin
- 3.1.3 Value addition at each stage
- 3.1.4 Factor affecting the value chain
- 3.1.5 Disruptions
- 3.2 Industry impact forces
- 3.2.1 Growth drivers
- 3.2.2 Industry pitfalls and challenges
- 3.2.3 Market opportunities
- 3.3 Growth potential analysis
- 3.4 Regulatory landscape
- 3.4.1 North America
- 3.4.2 Europe
- 3.4.3 Asia Pacific
- 3.4.4 Latin America
- 3.4.5 Middle East & Africa
- 3.5 Porter's analysis
- 3.6 PESTEL analysis
- 3.7 Price trends
- 3.7.1 By region
- 3.7.2 By product type
- 3.8 Future market trends
- 3.9 Technology and Innovation landscape
- 3.9.1 Current technological trends
- 3.9.2 Emerging technologies
- 3.10 Patent Landscape
- 3.11 Trade statistics
- 3.11.1 Major importing countries
- 3.11.2 Major exporting countries ( Note: the trade statistics will be provided for key countries only)
- 3.12 Sustainability and Environmental Aspects
- 3.12.1 Sustainable Practices
- 3.12.2 Waste Reduction Strategies
- 3.12.3 Energy Efficiency in Production
- 3.12.4 Eco-friendly Initiatives
- 3.13 Carbon Footprint Considerations
Chapter 4 Competitive Landscape, 2024
- 4.1 Introduction
- 4.2 Company market share analysis
- 4.2.1 By region
- 4.2.1.1 North America
- 4.2.1.2 Europe
- 4.2.1.3 Asia Pacific
- 4.2.1.4 LATAM
- 4.2.1.5 MEA
- 4.2.1 By region
- 4.3 Company matrix analysis
- 4.4 Competitive analysis of major market players
- 4.5 Competitive positioning matrix
- 4.6 Key developments
- 4.6.1 Mergers & acquisitions
- 4.6.2 Partnerships & collaborations
- 4.6.3 New Product Launches
- 4.7 Expansion Plans
Chapter 5 Market Estimates and Forecast, By Product Type, 2021 - 2034 (USD Billion) (Tons)
- 5.1 Key trends
- 5.2 Fertilizer grade ammonium nitrate (FGAN)
- 5.3 Technical grade ammonium nitrate (TGAN)
- 5.4 Industrial grade ammonium nitrate (IGAN)
- 5.5 Calcium ammonium nitrate (CAN)
- 5.6 Ammonium nitrate solutions
Chapter 6 Market Estimates and Forecast, By Application, 2021 - 2034 (USD Billion) (Tons)
- 6.1 Key trends
- 6.2 Agricultural fertilizers
- 6.2.1 Crop-specific application analysis
- 6.2.2 Fertigation system integration
- 6.2.3 Precision agriculture adoption
- 6.2.4 Seasonal demand patterns
- 6.3 Mining & quarrying explosives
- 6.3.1 ANFO market dynamics
- 6.3.2 Surface mining applications
- 6.3.3 Coal mining sector demand
- 6.3.4 Metal ore extraction uses
- 6.4 Construction explosives
- 6.4.1 Infrastructure development projects
- 6.4.2 Demolition & excavation applications
- 6.4.3 Tunneling & road construction
- 6.5 Industrial applications
- 6.5.1 Cold pack manufacturing
- 6.5.2 Chemical synthesis intermediate
- 6.5.3 Pharmaceutical applications
- 6.5.4 Other industrial uses
Chapter 7 Market Estimates and Forecast, By End Use Industry, 2021 - 2034 (USD Billion) (Tons)
- 7.1 Key trends
- 7.2 Agriculture & horticulture
- 7.2.1 Large-scale farming operations
- 7.2.2 Greenhouse & controlled environment
- 7.2.3 Specialty crop production
- 7.2.4 Organic vs. Conventional farming impact
- 7.3 Mining industry
- 7.3.1 Coal mining sector
- 7.3.2 Metal ore mining
- 7.3.3 Quarrying operations
- 7.3.4 Aggregate production
- 7.4 Construction industry
- 7.4.1 Residential construction
- 7.4.2 Commercial & industrial projects
- 7.4.3 Infrastructure development
- 7.4.4 Government construction programs
- 7.5 Chemical manufacturing
- 7.5.1 Downstream chemical production
- 7.5.2 Catalyst & intermediate uses
- 7.5.3 Process chemical applications
- 7.6 Pharmaceutical & medical
- 7.6.1 Medical device manufacturing
- 7.6.2 Pharmaceutical synthesis
- 7.6.3 Emergency medical applications
Chapter 8 Market Estimates and Forecast, By Region, 2021 - 2034 (USD Billion) (Tons)
- 8.1 Key trends
- 8.2 North America
- 8.2.1 U.S.
- 8.2.2 Canada
- 8.3 Europe
- 8.3.1 Germany
- 8.3.2 UK
- 8.3.3 France
- 8.3.4 Spain
- 8.3.5 Italy
- 8.3.6 Rest of Europe
- 8.4 Asia Pacific
- 8.4.1 China
- 8.4.2 India
- 8.4.3 Japan
- 8.4.4 Australia
- 8.4.5 South Korea
- 8.4.6 Rest of Asia Pacific
- 8.5 Latin America
- 8.5.1 Brazil
- 8.5.2 Mexico
- 8.5.3 Argentina
- 8.5.4 Rest of Latin America
- 8.6 Middle East and Africa
- 8.6.1 Saudi Arabia
- 8.6.2 South Africa
- 8.6.3 UAE
- 8.6.4 Rest of Middle East and Africa
Chapter 9 Company Profiles
- 9.1 Acron Group
- 9.2 CF Industries Holdings Inc.
- 9.3 EuroChem Group AG
- 9.4 Fertiberia S.A.
- 9.5 Green Ammonia Solutions Inc.
- 9.6 Incitec Pivot Limited
- 9.7 LSB Industries Inc.
- 9.8 Nutrien Ltd.
- 9.9 OCI N.V.
- 9.10 Profertil S.A.
- 9.11 Rashtriya Chemicals & Fertilizers Ltd.
- 9.12 SAFCO (Saudi Arabian Fertilizer Company)
- 9.13 Smart Agriculture Chemicals
- 9.14 URALCHEM JSC
- 9.15 Yara International ASA
- 9.16 Others

