Picture
SEARCH
What are you looking for?
Need help finding what you are looking for? Contact Us
Compare

PUBLISHER: Global Market Insights Inc. | PRODUCT CODE: 1411257

Cover Image

PUBLISHER: Global Market Insights Inc. | PRODUCT CODE: 1411257

Asia Pacific Cast Resin Transformer Market Size - By Winding (Two Winding, Auto Transformer), By Application (Industries, Inner-City Substations, Indoor/Underground Substations, Renewable Generation), Rating & Forecast, 2023 - 2032

PUBLISHED:
PAGES: 150 Pages
DELIVERY TIME: 2-3 business days
SELECT AN OPTION
PDF & Excel (Single User License)
USD 3250
PDF & Excel (Multi User License)
USD 3750
PDF & Excel (Enterprise User License)
USD 5750

Add to Cart

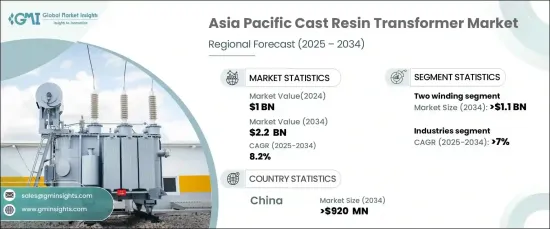
Asia Pacific Cast Resin Transformer Market is estimated to attain a CAGR of over 10.3% during 2023 and 2032, driven by rapid industrialization and urbanization. For instance, UN.org reports projected that 43.2% of the population in India at mid-year would reside in urban areas by 2035. Cast resin transformers, known for their durability and efficient performance in diverse environments, are meeting the evolving energy needs of growing urban centers and industrial hubs.

Continuous improvements in insulation materials, cooling systems, and overall efficiency enhance the performance and reliability of cast resin transformers. Industries seeking modern and resilient power distribution solutions, are shifting towards these transformers to address their evolving energy requirements.

Asia Pacific cast resin transformer industry is segmented based on winding, rating, application, and region.

The transformers with 30 MVA or more rating is poised for substantial growth in the forecast period, owing to escalating energy demands of large-scale industrial and infrastructural projects. The need for robust and high-capacity transformers with >30 MVA rating caters to industries and utilities, ensuring efficient power distribution in mega-scale operations.

Inner-city substations segment will generate notable revenues for the market during 2023-2032, backed by specific energy needs of densely populated urban areas. These substations help in ensuring efficient power distribution within cities, addressing the unique challenges posed by limited space and proximity to residential and commercial zones. The compact and eco-friendly nature of cast resin transformers makes them particularly suitable for inner-city substations, aligning with the region's emphasis on sustainable and space-efficient energy infrastructure.

India cast resin transformer industry is slated to witness a significant growth rate through 2032, favored by burgeoning renewable energy sector, emphasizing the integration of sustainable power sources into the grid. Additionally, the country's commitment to enhancing power infrastructure resilience, particularly in regions prone to extreme weather conditions will favor the product adoption. The ability of cast resin transformers to withstand environmental challenges while offering high reliability, significantly contribute to the regional market growth.

Product Code: 7288

Table of Contents

Chapter 1 Methodology & Scope

  • 1.1 Market scope and definitions
  • 1.2 Base estimates & calculations
  • 1.3 Forecast calculations
  • 1.4 Data sources
    • 1.4.1 Primary
    • 1.4.2 Secondary
      • 1.4.2.1 Paid sources
      • 1.4.2.2 Public sources

Chapter 2 Asia Pacific Cast Resin Transformer Industry Insights

  • 2.1 Industry ecosystemanalysis
    • 2.1.1 Vendor matrix
  • 2.2 Regulatory landscape
  • 2.3 Industry impact forces
    • 2.3.1 Growth drivers
    • 2.3.2 Industry pitfalls & challenges
  • 2.4 Growth potentialanalysis
  • 2.5 Porter'sanalysis
    • 2.5.1 Bargaining power of suppliers
    • 2.5.2 Bargaining power of buyers
    • 2.5.3 Threat of new entrants
    • 2.5.4 Threat of substitutes
  • 2.6 PESTELanalysis

Chapter 3 Competitive Benchmarking

  • 3.1 Innovation & sustainability landscape
  • 3.2 Competitive landscape, 2022
    • 3.2.1 Strategy dashboard

Chapter 4 Asia Pacific Cast Resin Transformer Market, By Winding

  • 4.1 Key winding trends
  • 4.2 Two winding
  • 4.3 Auto transformer

Chapter 5 Asia Pacific Cast Resin Transformer Market, By Rating

  • 5.1 Key rating trends
  • 5.2 < 5 MVA
  • 5.3 > 5 MVA to < 30 MVA
  • 5.4 > 30 MVA

Chapter 6 Asia Pacific Cast Resin Transformer Market, By Application

  • 6.1 Key application trends
  • 6.2 Industries
  • 6.3 Inner-City Substations
  • 6.4 Indoor/Underground Substations
  • 6.5 Renewable generation
  • 6.6 Others

Chapter 7 Asia Pacific Cast Resin Transformer Market, By Country

  • 7.1 Key country trends
  • 7.2 China
  • 7.3 Japan
  • 7.4 South Korea
  • 7.5 India
  • 7.6 Australia

Chapter 8 Company Profiles

  • 8.1 ABB
  • 8.2 GE
  • 8.3 Eaton
  • 8.4 Schneider Electric
  • 8.5 Siemens Energy
  • 8.6 Hitachi Energy Ltd.
  • 8.7 CG Power & Industrial Solutions Ltd.
  • 8.8 Toshiba Energy Systems & Solutions Corporation
  • 8.9 Bharat Heavy Electricals Limited (BHEL)
  • 8.10 Raychem RPG Private Limited
  • 8.11 Fuji Electric Co., Ltd.
  • 8.12 WEG
  • 8.13 URJA Techniques
  • 8.14 SGB SMIT
Product Code: 7288

Data Tables

  • TABLE 1 Industry impact forces
  • TABLE 2 Asia Pacific market from two winding, 2019 - 2022 (Volume & Revenue)
  • TABLE 3 Asia Pacific market from two winding, 2023 - 2027 (Volume & Revenue)
  • TABLE 4 Asia Pacific market from two winding, 2028 - 2032 (Volume & Revenue)
  • TABLE 5 Asia Pacific market from two winding, by region, 2019 - 2022 ('000 Units)
  • TABLE 6 Asia Pacific market from two winding, by region, 2023 - 2027 ('000 Units)
  • TABLE 7 Asia Pacific market from two winding, by region, 2028 - 2032 ('000 Units)
  • TABLE 8 Asia Pacific market from two winding, by region, 2019 - 2022 (USD Million)
  • TABLE 9 Asia Pacific market from two winding, by region, 2023 - 2027 (USD Million)
  • TABLE 10 Asia Pacific market from two winding, by region, 2028 - 2032 (USD Million)
  • TABLE 11 Asia Pacific market from auto-transformer, 2019 - 2022 (Volume & Revenue)
  • TABLE 12 Asia Pacific market from auto-transformer, 2023 - 2027 (Volume & Revenue)
  • TABLE 13 Asia Pacific market from auto-transformer, 2028 - 2032 (Volume & Revenue)
  • TABLE 14 Asia Pacific market from auto-transformer, by region, 2019 - 2022 ('000 Units)
  • TABLE 15 Asia Pacific market from auto-transformer, by region, 2023 - 2027 ('000 Units)
  • TABLE 16 Asia Pacific market from auto-transformer, by region, 2028 - 2032 ('000 Units)
  • TABLE 17 Asia Pacific market from auto-transformer, by region, 2019 - 2022 (USD Million)
  • TABLE 18 Asia Pacific market from auto-transformer, by region, 2023 - 2027 (USD Million)
  • TABLE 19 Asia Pacific market from auto-transformer, by region, 2028 - 2032 (USD Million)
  • TABLE 20 Asia Pacific market from < 5 MVA, 2019 - 2022 (Volume & Revenue)
  • TABLE 21 Asia Pacific market from < 5 MVA, 2023 - 2027 (Volume & Revenue)
  • TABLE 22 Asia Pacific market from < 5 MVA, 2028 - 2032 (Volume & Revenue)
  • TABLE 23 Asia Pacific market from < 5 MVA, by region, 2019 - 2022 ('000 Units)
  • TABLE 24 Asia Pacific market from < 5 MVA, by region, 2023 - 2027 ('000 Units)
  • TABLE 25 Asia Pacific market from < 5 MVA, by region, 2028 - 2032 ('000 Units)
  • TABLE 26 Asia Pacific market from < 5 MVA, by region, 2019 - 2022 (USD Million)
  • TABLE 27 Asia Pacific market from < 5 MVA, by region, 2023 - 2027 (USD Million)
  • TABLE 28 Asia Pacific market from < 5 MVA, by region, 2028 - 2032 (USD Million)
  • TABLE 29 Asia Pacific market from > 5 MVA to < 30 MVA, 2019 - 2022 (Volume & Revenue)
  • TABLE 30 Asia Pacific market from > 5 MVA to < 30 MVA, 2023 - 2027 (Volume & Revenue)
  • TABLE 31 Asia Pacific market from > 5 MVA to < 30 MVA, 2028 - 2032 (Volume & Revenue)
  • TABLE 32 Asia Pacific market from > 5 MVA to < 30 MVA, by region, 2019 - 2022 ('000 Units)
  • TABLE 33 Asia Pacific market from > 5 MVA to < 30 MVA, by region, 2023 - 2027 ('000 Units)
  • TABLE 34 Asia Pacific market from > 5 MVA to < 30 MVA, by region, 2028 - 2032 ('000 Units)
  • TABLE 35 Asia Pacific market from > 5 MVA to < 30 MVA, by region, 2019 - 2022 (USD Million)
  • TABLE 36 Asia Pacific market from > 5 MVA to < 30 MVA, by region, 2023 - 2027 (USD Million)
  • TABLE 37 Asia Pacific market from > 5 MVA to < 30 MVA, by region, 2028 - 2032 (USD Million)
  • TABLE 38 Asia Pacific market from > 30 MVA, 2019 - 2022 (Volume & Revenue)
  • TABLE 39 Asia Pacific market from > 30 MVA, 2023 - 2027 (Volume & Revenue)
  • TABLE 40 Asia Pacific market from > 30 MVA, 2028 - 2032 (Volume & Revenue)
  • TABLE 41 Asia Pacific market from > 30 MVA, by region, 2019 - 2022 ('000 Units)
  • TABLE 42 Asia Pacific market from > 30 MVA, by region, 2023 - 2027 ('000 Units)
  • TABLE 43 Asia Pacific market from > 30 MVA, by region, 2028 - 2032 ('000 Units)
  • TABLE 44 Asia Pacific market from > 30 MVA, by region, 2019 - 2022 (USD Million)
  • TABLE 45 Asia Pacific market from > 30 MVA, by region, 2023 - 2027 (USD Million)
  • TABLE 46 Asia Pacific market from > 30 MVA, by region, 2028 - 2032 (USD Million)
  • TABLE 47 Asia Pacific market from industries, 2019 - 2022 (Volume & Revenue)
  • TABLE 48 Asia Pacific market from industries, 2023 - 2027 (Volume & Revenue)
  • TABLE 49 Asia Pacific market from industries, 2028 - 2032 (Volume & Revenue)
  • TABLE 50 Asia Pacific market from industries, by region, 2019 - 2022 ('000 Units)
  • TABLE 51 Asia Pacific market from industries, by region, 2023 - 2027 ('000 Units)
  • TABLE 52 Asia Pacific market from industries, by region, 2028 - 2032 ('000 Units)
  • TABLE 53 Asia Pacific market from industries, by region, 2019 - 2022 (USD Million)
  • TABLE 54 Asia Pacific market from industries, by region, 2023 - 2027 (USD Million)
  • TABLE 55 Asia Pacific market from industries, by region, 2028 - 2032 (USD Million)
  • TABLE 56 Asia Pacific market from inner-city substations, 2019 - 2022 (Volume & Revenue)
  • TABLE 57 Asia Pacific market from inner-city substations, 2023 - 2027 (Volume & Revenue)
  • TABLE 58 Asia Pacific market from inner-city substations, 2028 - 2032 (Volume & Revenue)
  • TABLE 59 Asia Pacific market from inner-city substations, by region, 2019 - 2022 ('000 Units)
  • TABLE 60 Asia Pacific market from inner-city substations, by region, 2023 - 2027 ('000 Units)
  • TABLE 61 Asia Pacific market from inner-city substations, by region, 2028 - 2032 ('000 Units)
  • TABLE 62 Asia Pacific market from inner-city substations, by region, 2019 - 2022 (USD Million)
  • TABLE 63 Asia Pacific market from inner-city substations, by region, 2023 - 2027 (USD Million)
  • TABLE 64 Asia Pacific market from inner-city substations, by region, 2028 - 2032 (USD Million)
  • TABLE 65 Asia Pacific market from indoor/underground substations, 2019 - 2022 (Volume & Revenue)
  • TABLE 66 Asia Pacific market from indoor/underground substations, 2023 - 2027 (Volume & Revenue)
  • TABLE 67 Asia Pacific market from indoor/underground substations, 2028 - 2032 (Volume & Revenue)
  • TABLE 68 Asia Pacific market from indoor/underground substations, by region, 2019 - 2022 ('000 Units)
  • TABLE 69 Asia Pacific market from indoor/underground substations, by region, 2023 - 2027 ('000 Units)
  • TABLE 70 Asia Pacific market from indoor/underground substations, by region, 2028 - 2032 ('000 Units)
  • TABLE 71 Asia Pacific market from indoor/underground substations, by region, 2019 - 2022 (USD Million)
  • TABLE 72 Asia Pacific market from indoor/underground substations, by region, 2023 - 2027 (USD Million)
  • TABLE 73 Asia Pacific market from indoor/underground substations, by region, 2028 - 2032 (USD Million)
  • TABLE 74 Asia Pacific market from renewable generation, 2019 - 2022 (Volume & Revenue)
  • TABLE 75 Asia Pacific market from renewable generation, 2023 - 2027 (Volume & Revenue)
  • TABLE 76 Asia Pacific market from renewable generation, 2028 - 2032 (Volume & Revenue)
  • TABLE 77 Asia Pacific market from renewable generation, by region, 2019 - 2022 ('000 Units)
  • TABLE 78 Asia Pacific market from renewable generation, by region, 2023 - 2027 ('000 Units)
  • TABLE 79 Asia Pacific market from renewable generation, by region, 2028 - 2032 ('000 Units)
  • TABLE 80 Asia Pacific market from renewable generation, by region, 2019 - 2022 (USD Million)
  • TABLE 81 Asia Pacific market from renewable generation, by region, 2023 - 2027 (USD Million)
  • TABLE 82 Asia Pacific market from renewable generation, by region, 2028 - 2032 (USD Million)
  • TABLE 83 Asia Pacific market from others, 2019 - 2022 (Volume & Revenue)
  • TABLE 84 Asia Pacific market from others, 2023 - 2027 (Volume & Revenue)
  • TABLE 85 Asia Pacific market from others, 2028 - 2032 (Volume & Revenue)
  • TABLE 86 Asia Pacific market from others, by region, 2019 - 2022 ('000 Units)
  • TABLE 87 Asia Pacific market from others, by region, 2023 - 2027 ('000 Units)
  • TABLE 88 Asia Pacific market from others, by region, 2028 - 2032 ('000 Units)
  • TABLE 89 Asia Pacific market from others, by region, 2019 - 2022 (USD Million)
  • TABLE 90 Asia Pacific market from others, by region, 2023 - 2027 (USD Million)
  • TABLE 91 Asia Pacific market from others, by region, 2028 - 2032 (USD Million)
  • TABLE 92 China market, 2019 - 2022 (Volume & Revenue)
  • TABLE 93 China market, 2023 - 2027 (Volume & Revenue)
  • TABLE 94 China market, 2028 - 2032 (Volume & Revenue)
  • TABLE 95 China market by winding, 2019 - 2022 ('000 Units)
  • TABLE 96 China market by winding, 2023 - 2027 ('000 Units)
  • TABLE 97 China market by winding, 2028 - 2032 ('000 Units)
  • TABLE 98 China market by winding, 2019 - 2022 (USD Million)
  • TABLE 99 China market by winding, 2023 - 2027 (USD Million)
  • TABLE 100 China market by winding, 2028 - 2032 (USD Million)
  • TABLE 101 China market by rating, 2019 - 2022 ('000 Units)
  • TABLE 102 China market by rating, 2023 - 2027 ('000 Units)
  • TABLE 103 China market by rating, 2028 - 2032 ('000 Units)
  • TABLE 104 China market by rating, 2019 - 2022 (USD Million)
  • TABLE 105 China market by rating, 2023 - 2027 (USD Million)
  • TABLE 106 China market by rating, 2028 - 2032 (USD Million)
  • TABLE 107 China market by application, 2019 - 2022 ('000 Units)
  • TABLE 108 China market by application, 2023 - 2027 ('000 Units)
  • TABLE 109 China market by application, 2028 - 2032 ('000 Units)
  • TABLE 110 China market by application, 2019 - 2022 (USD Million)
  • TABLE 111 China market by application, 2023 - 2027 (USD Million)
  • TABLE 112 China market by application, 2028 - 2032 (USD Million)
  • TABLE 113 Japan market, 2019 - 2022 (Volume & Revenue)
  • TABLE 114 Japan market, 2023 - 2027 (Volume & Revenue)
  • TABLE 115 Japan market, 2028 - 2032 (Volume & Revenue)
  • TABLE 116 Japan market by winding, 2019 - 2022 ('000 Units)
  • TABLE 117 Japan market by winding, 2023 - 2027 ('000 Units)
  • TABLE 118 Japan market by winding, 2028 - 2032 ('000 Units)
  • TABLE 119 Japan market by winding, 2019 - 2022 (USD Million)
  • TABLE 120 Japan market by winding, 2023 - 2027 (USD Million)
  • TABLE 121 Japan market by winding, 2028 - 2032 (USD Million)
  • TABLE 122 Japan market by rating, 2019 - 2022 ('000 Units)
  • TABLE 123 Japan market by rating, 2023 - 2027 ('000 Units)
  • TABLE 124 Japan market by rating, 2028 - 2032 ('000 Units)
  • TABLE 125 Japan market by rating, 2019 - 2022 (USD Million)
  • TABLE 126 Japan market by rating, 2023 - 2027 (USD Million)
  • TABLE 127 Japan market by rating, 2028 - 2032 (USD Million)
  • TABLE 128 Japan market by application, 2019 - 2022 ('000 Units)
  • TABLE 129 Japan market by application, 2023 - 2027 ('000 Units)
  • TABLE 130 Japan market by application, 2028 - 2032 ('000 Units)
  • TABLE 131 Japan market by application, 2019 - 2022 (USD Million)
  • TABLE 132 Japan market by application, 2023 - 2027 (USD Million)
  • TABLE 133 Japan market by application, 2028 - 2032 (USD Million)
  • TABLE 134 South Korea market, 2019 - 2022 (Volume & Revenue)
  • TABLE 135 South Korea market, 2023 - 2027 (Volume & Revenue)
  • TABLE 136 South Korea market, 2028 - 2032 (Volume & Revenue)
  • TABLE 137 South Korea market by winding, 2019 - 2022 ('000 Units)
  • TABLE 138 South Korea market by winding, 2023 - 2027 ('000 Units)
  • TABLE 139 South Korea market by winding, 2028 - 2032 ('000 Units)
  • TABLE 140 South Korea market by winding, 2019 - 2022 (USD Million)
  • TABLE 141 South Korea market by winding, 2023 - 2027 (USD Million)
  • TABLE 142 South Korea market by winding, 2028 - 2032 (USD Million)
  • TABLE 143 South Korea market by rating, 2019 - 2022 ('000 Units)
  • TABLE 144 South Korea market by rating, 2023 - 2027 ('000 Units)
  • TABLE 145 South Korea market by rating, 2028 - 2032 ('000 Units)
  • TABLE 146 South Korea market by rating, 2019 - 2022 (USD Million)
  • TABLE 147 South Korea market by rating, 2023 - 2027 (USD Million)
  • TABLE 148 South Korea market by rating, 2028 - 2032 (USD Million)
  • TABLE 149 South Korea market by application, 2019 - 2022 ('000 Units)
  • TABLE 150 South Korea market by application, 2023 - 2027 ('000 Units)
  • TABLE 151 South Korea market by application, 2028 - 2032 ('000 Units)
  • TABLE 152 South Korea market by application, 2019 - 2022 (USD Million)
  • TABLE 153 South Korea market by application, 2023 - 2027 (USD Million)
  • TABLE 154 South Korea market by application, 2028 - 2032 (USD Million)
  • TABLE 155 India market, 2019 - 2022 (Volume & Revenue)
  • TABLE 156 India market, 2023 - 2027 (Volume & Revenue)
  • TABLE 157 India market, 2028 - 2032 (Volume & Revenue)
  • TABLE 158 India market by winding, 2019 - 2022 ('000 Units)
  • TABLE 159 India market by winding, 2023 - 2027 ('000 Units)
  • TABLE 160 India market by winding, 2028 - 2032 ('000 Units)
  • TABLE 161 India market by winding, 2019 - 2022 (USD Million)
  • TABLE 162 India market by winding, 2023 - 2027 (USD Million)
  • TABLE 163 India market by winding, 2028 - 2032 (USD Million)
  • TABLE 164 India market by rating, 2019 - 2022 ('000 Units)
  • TABLE 165 India market by rating, 2023 - 2027 ('000 Units)
  • TABLE 166 India market by rating, 2028 - 2032 ('000 Units)
  • TABLE 167 India market by rating, 2019 - 2022 (USD Million)
  • TABLE 168 India market by rating, 2023 - 2027 (USD Million)
  • TABLE 169 India market by rating, 2028 - 2032 (USD Million)
  • TABLE 170 India market by application, 2019 - 2022 ('000 Units)
  • TABLE 171 India market by application, 2023 - 2027 ('000 Units)
  • TABLE 172 India market by application, 2028 - 2032 ('000 Units)
  • TABLE 173 India market by application, 2019 - 2022 (USD Million)
  • TABLE 174 India market by application, 2023 - 2027 (USD Million)
  • TABLE 175 India market by application, 2028 - 2032 (USD Million)
  • TABLE 176 Australia market, 2019 - 2022 (Volume & Revenue)
  • TABLE 177 Australia market, 2023 - 2027 (Volume & Revenue)
  • TABLE 178 Australia market, 2028 - 2032 (Volume & Revenue)
  • TABLE 179 Australia market by winding, 2019 - 2022 ('000 Units)
  • TABLE 180 Australia market by winding, 2023 - 2027 ('000 Units)
  • TABLE 181 Australia market by winding, 2028 - 2032 ('000 Units)
  • TABLE 182 Australia market by winding, 2019 - 2022 (USD Million)
  • TABLE 183 Australia market by winding, 2023 - 2027 (USD Million)
  • TABLE 184 Australia market by winding, 2028 - 2032 (USD Million)
  • TABLE 185 Australia market by rating, 2019 - 2022 ('000 Units)
  • TABLE 186 Australia market by rating, 2023 - 2027 ('000 Units)
  • TABLE 187 Australia market by rating, 2028 - 2032 ('000 Units)
  • TABLE 188 Australia market by rating, 2019 - 2022 (USD Million)
  • TABLE 189 Australia market by rating, 2023 - 2027 (USD Million)
  • TABLE 190 Australia market by rating, 2028 - 2032 (USD Million)
  • TABLE 191 Australia market by application, 2019 - 2022 ('000 Units)
  • TABLE 192 Australia market by application, 2023 - 2027 ('000 Units)
  • TABLE 193 Australia market by application, 2028 - 2032 ('000 Units)
  • TABLE 194 Australia market by application, 2019 - 2022 (USD Million)
  • TABLE 195 Australia market by application, 2023 - 2027 (USD Million)
  • TABLE 196 Australia market by application, 2028 - 2032 (USD Million)

Charts & Figures

  • FIG. 1 GMI report coverage: critical research elements
  • FIG. 2 Industry segmentation
  • FIG. 3 Market forecasting methodology
  • FIG. 4 Profile break-up of primary respondents
  • FIG. 5 Industry ecosystem analysis
  • FIG. 6 Growth potential analysis
  • FIG. 7 Porter's Analysis
  • FIG. 8 PESTEL Analysis
  • FIG. 9 SWOT Analysis, ABB
  • FIG. 10 SWOT Analysis, GE
  • FIG. 11 SWOT Analysis, Eaton
  • FIG. 12 SWOT Analysis, Schneider Electric
  • FIG. 13 SWOT Analysis, Siemens Energy
  • FIG. 14 SWOT Analysis, Hitachi Energy Ltd.
  • FIG. 15 SWOT Analysis, CG Power & Industrial Solutions Ltd.
  • FIG. 16 SWOT Analysis, Toshiba Energy Systems & Solutions Corporation
  • FIG. 17 SWOT Analysis, Bharat Heavy Electricals Limited (BHEL)
  • FIG. 18 SWOT Analysis, Raychem RPG Private Limited
  • FIG. 19 SWOT Analysis, Instrument Transformer Equipment Corporation, Inc.
  • FIG. 20 SWOT Analysis, Fuji Electric Co., Ltd.
  • FIG. 21 SWOT Analysis, WEG
  • FIG. 22 SWOT Analysis, URJA Techniques
  • FIG. 23 SWOT Analysis, SGB SMIT
Have a question?
Picture

Jeroen Van Heghe

Manager - EMEA

+32-2-535-7543

Picture

Christine Sirois

Manager - Americas

+1-860-674-8796

Questions? Please give us a call or visit the contact form.
Hi, how can we help?
Contact us!