
PUBLISHER: Global Market Insights Inc. | PRODUCT CODE: 1667048

PUBLISHER: Global Market Insights Inc. | PRODUCT CODE: 1667048
Phase Shifting Transformer Market Opportunity, Growth Drivers, Industry Trend Analysis, and Forecast 2025 - 2034
The Global Phase Shifting Transformer Market, valued at USD 172.4 million in 2024, is set to grow at a steady CAGR of 6.6% from 2025 to 2034. This growth can be largely attributed to the increasing reliance on renewable energy sources such as wind and solar power. As these energy sources become more prevalent, they introduce challenges in grid stability due to their intermittent nature. PSTs are vital for managing power flows across different grid sections, alleviating congestion, and stabilizing voltage levels. This makes them indispensable in modernizing the electrical grid infrastructure. With aging grid systems in need of urgent upgrades and industrialization ramping up in many regions, the demand for PSTs continues to rise. These transformers are essential for ensuring the efficiency and reliability of power distribution networks, particularly in regions transitioning to a more renewable-based energy mix. As the demand for electricity rises and grid complexities increase, the need for advanced power management systems like PSTs becomes even more pressing.
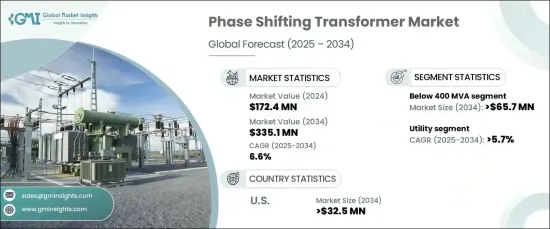
The below 400 MVA segment of the PST market is anticipated to generate USD 65.7 million by 2034. Smaller PSTs, below 400 MVA, are gaining traction due to their role in enhancing the flexibility and stability of distribution grids, especially in urban areas with high population density. As local grids face increased electricity demand, the deployment of these smaller transformers allows utilities to balance power distribution more effectively and maintain stable voltage levels. These transformers play a key role in preventing grid overloads while ensuring that the power supply remains reliable and consistent for urban populations.
| Market Scope | |
|---|---|
| Start Year | 2024 |
| Forecast Year | 2025-2034 |
| Start Value | $172.4 Million |
| Forecast Value | $335.1 Million |
| CAGR | 6.6% |
The utility sector is expected to experience significant expansion in the PST market, projected to grow at a CAGR of 5.7% through 2034. Utility-scale phase-shifting transformers are indispensable for controlling large-scale power flows across transmission networks. These transformers are pivotal in preventing congestion, managing load imbalances, and ensuring overall grid stability. As electrical grids become more complex and demand for energy grows, PSTs offer utilities the flexibility to adapt to fluctuations in power supply and demand. The integration of renewable energy sources, known for their variable outputs, further drives the necessity for these transformers, which help stabilize the grid and smooth out variations in power supply, ensuring consistent energy distribution.
In the U.S., the PST market is projected to reach USD 32.5 million by 2034. With much of the U.S. electrical grid aging, utilities are prioritizing grid modernization efforts. Phase-shifting transformers are a critical part of this transition, offering enhanced control of power flows, reducing grid bottlenecks, and improving the reliability of the power system. As renewable energy continues to take a larger share of the U.S. energy mix, PSTs are becoming increasingly essential for optimizing grid operations and meeting the nation's goals for a resilient and adaptable power grid.
Table of Contents
Chapter 1 Methodology & Scope
- 1.1 Market definitions
- 1.2 Base estimates & calculations
- 1.3 Forecast calculation
- 1.4 Data sources
- 1.4.1 Primary
- 1.4.2 Secondary
- 1.4.2.1 Paid
- 1.4.2.2 Public
Chapter 2 Executive Summary
- 2.1 Industry synopsis, 2021 – 2034
Chapter 3 Industry Insights
- 3.1 Industry ecosystem analysis
- 3.2 Regulatory landscape
- 3.3 Industry impact forces
- 3.3.1 Growth drivers
- 3.3.2 Industry pitfalls & challenges
- 3.4 Growth potential analysis
- 3.5 Porter's analysis
- 3.5.1 Bargaining power of suppliers
- 3.5.2 Bargaining power of buyers
- 3.5.3 Threat of new entrants
- 3.5.4 Threat of substitutes
- 3.6 PESTEL analysis
Chapter 4 Competitive landscape, 2024
- 4.1 Strategic dashboard
- 4.2 Innovation & sustainability landscape
Chapter 5 Market Size and Forecast, By Rating, 2021 – 2034 (Units & USD Million)
- 5.1 Key trends
- 5.2 < 400 MVA
- 5.3 400 MVA - 800 MVA
- 5.4 > 800 MVA
Chapter 6 Market Size and Forecast, By Application, 2021 – 2034 (Units & USD Million)
- 6.1 Key trends
- 6.2 Industrial
- 6.3 Utility
- 6.4 Others
Chapter 7 Market Size and Forecast, By Region, 2021 – 2034 (Units & USD million)
- 7.1 Key trends
- 7.2 North America
- 7.2.1 U.S.
- 7.2.2 Canada
- 7.2.3 Mexico
- 7.3 Europe
- 7.3.1 UK
- 7.3.2 France
- 7.3.3 Germany
- 7.3.4 Italy
- 7.3.5 Russia
- 7.3.6 Spain
- 7.4 Asia Pacific
- 7.4.1 China
- 7.4.2 Australia
- 7.4.3 India
- 7.4.4 Japan
- 7.4.5 South Korea
- 7.5 Middle East & Africa
- 7.5.1 Saudi Arabia
- 7.5.2 UAE
- 7.5.3 Turkey
- 7.5.4 South Africa
- 7.5.5 Egypt
- 7.6 Latin America
- 7.6.1 Brazil
- 7.6.2 Argentina
Chapter 8 Company Profiles
- 8.1 ABB
- 8.2 Eaton
- 8.3 GE Grid Solutions
- 8.4 Hitachi Energy
- 8.5 Hyosung Heavy Industries
- 8.6 Schneider Electric
- 8.7 SGB-SMIT Group
- 8.8 Siemens Energy
- 8.9 Tamini Transformers
- 8.10 Toshiba International Corporation
- 8.11 Wilson Transformers

