
PUBLISHER: Global Market Insights Inc. | PRODUCT CODE: 1913365

PUBLISHER: Global Market Insights Inc. | PRODUCT CODE: 1913365
Power Quality Meter Market Opportunity, Growth Drivers, Industry Trend Analysis, and Forecast 2026 - 2035
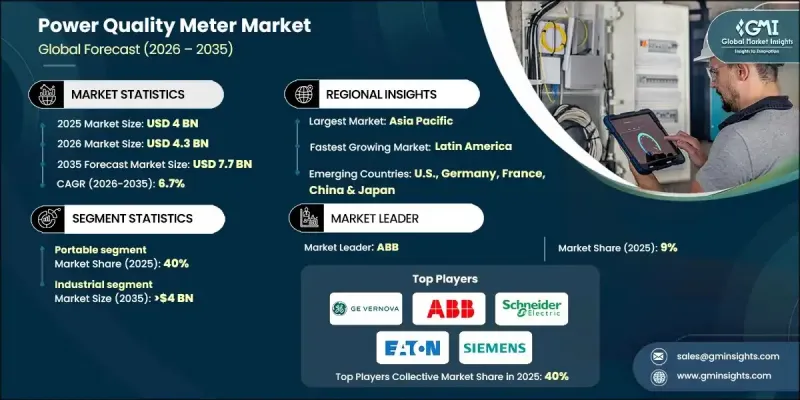
The Global Power Quality Meter Market was valued at USD 4 billion in 2025 and is estimated to grow at a CAGR of 6.7% to reach USD 7.7 billion by 2035.
The growing deployment of precision electronics across diverse industries is driving demand for these meters to prevent disruptions and equipment damage. The increasing adoption of smart grids, coupled with the expansion of renewable energy sources, is reshaping market dynamics. Energy efficiency initiatives and stricter regulatory mandates are further accelerating adoption. Power quality meters are essential for detecting voltage sags, harmonics, and other disturbances in complex grid networks. Equipped with real-time communication capabilities, these meters enable predictive maintenance and rapid fault analysis. The shift toward cloud-based data management allows seamless monitoring, trend visualization, report generation, and alerts from any device. Rising cybersecurity concerns and stricter power quality standards are expected to support market growth, as utilities and industries focus on ensuring a stable and reliable electricity supply.
| Market Scope | |
|---|---|
| Start Year | 2025 |
| Forecast Year | 2026-2035 |
| Start Value | $4 Billion |
| Forecast Value | $7.7 Billion |
| CAGR | 6.7% |
The portable power quality meter segment held 40% share in 2025 and is projected to grow at a CAGR of 6.5% through 2035. Rising urbanization, government initiatives to modernize small-scale industries, and the growing complexity of electrical systems are fueling demand. These meters help organizations identify energy inefficiencies, streamline usage, and reduce operational costs.
The industrial power quality meter segment held 57.9% share in 2025 and is expected to reach USD 4 billion by 2035. High-speed manufacturing operations rely on stable electrical supplies, and these meters ensure machinery operates without interruption, supporting consistent production and quality standards.
North America Power Quality Meter Market is projected to reach USD 1.5 billion by 2035. Utilities in the region are investing heavily in advanced monitoring systems to enhance grid reliability, manage voltage fluctuations, detect faults, and improve response times amid aging infrastructure and increasing weather-related disruptions.
Key players in the Global Power Quality Meter Market include Fluke Corporation, Schneider Electric, ABB, Phoenix Contact, Siemens, Eaton, Emerson Electric, Accuenergy, Rishabh Instruments, Honeywell International, Delta Electronics, LUMEL, MTE Power Quality, Megger, PCE Instruments, Vitrek, HIOKI E.E. CORPORATION, Elspec, M B Control & Systems, Algodue Elettronica, Eastron Electronic, Mitsubishi Electric Corporation, and GE Vernova. Companies in the Global Power Quality Meter Market are strengthening their presence through multiple strategies. They focus on investing in R&D to enhance meter accuracy, connectivity, and predictive maintenance capabilities. Strategic partnerships with utilities and industrial players help expand market reach and integration with smart grid solutions. Firms are also improving after-sales support, software platforms, and mobile/cloud-based monitoring services to increase customer value.
Table of Contents
Chapter 1 Methodology & Scope
- 1.1 Research design
- 1.1.1 Research approach
- 1.1.2 Data collection methods
- 1.2 Base estimates and calculations
- 1.2.1 Base year calculation
- 1.2.2 Market estimates & forecast parameters
- 1.3 Forecast model
- 1.3.1 Key trends for market estimates
- 1.3.2 Quantified market impact analysis
- 1.3.2.1 Mathematical impact of growth parameters on forecast
- 1.3.3 Scenario analysis framework
- 1.4 Primary research and validation
- 1.4.1 Some of the primary sources (but not limited to)
- 1.5 Data mining sources
- 1.5.1 Paid Sources
- 1.5.2 Sources, by region
- 1.6 Research trail & scoring components
- 1.6.1 Research trail components
- 1.6.2 Scoring components
- 1.7 Research transparency addendum
- 1.7.1 Source attribution framework
- 1.7.2 Quality assurance metrics
- 1.7.3 Our commitment to trust
- 1.8 Market definitions
Chapter 2 Executive Summary
- 2.1 Industry synopsis, 2022 - 2035
- 2.1.1 Business trends
- 2.1.2 Product trends
- 2.1.3 Application trends
- 2.1.4 Phase trends
- 2.1.5 Communication trends
- 2.1.6 Regional trends
Chapter 3 Industry Insights
- 3.1 Industry ecosystem analysis
- 3.1.1 Raw material availability & sourcing analysis
- 3.1.2 Manufacturing capacity assessment
- 3.1.3 Supply chain resilience & risk factors
- 3.1.4 Distribution network analysis
- 3.2 Regulatory landscape
- 3.3 Industry impact forces
- 3.3.1 Growth drivers
- 3.3.2 Industry pitfalls & challenges
- 3.4 Growth potential analysis
- 3.5 Porter's analysis
- 3.5.1 Bargaining power of suppliers
- 3.5.2 Bargaining power of buyers
- 3.5.3 Threat of new entrants
- 3.5.4 Threat of substitutes
- 3.6 PESTEL analysis
- 3.6.1 Political factors
- 3.6.2 Economic factors
- 3.6.3 Social factors
- 3.6.4 Technological factors
- 3.6.5 Legal factors
- 3.6.6 Environmental factors
- 3.7 Cost structure analysis of power quality meters
- 3.8 Price trend analysis (USD/Unit)
- 3.8.1 By region
- 3.8.2 By product
- 3.9 Emerging opportunities & trends
- 3.9.1 Digitalization & IoT integration
- 3.9.2 Emerging market penetration
- 3.10 Investment analysis & future outlook
Chapter 4 Competitive Landscape, 2025
- 4.1 Introduction
- 4.2 Company market share analysis, by region, 2025
- 4.2.1 North America
- 4.2.2 Europe
- 4.2.3 Asia Pacific
- 4.2.4 Middle East & Africa
- 4.2.5 Latin America
- 4.3 Strategic dashboard
- 4.4 Strategic initiatives
- 4.4.1 Key partnerships & collaborations
- 4.4.2 Major M&A activities
- 4.4.3 Product innovations & launches
- 4.4.4 Market expansion strategies
- 4.5 Competitive benchmarking
- 4.6 Innovation & sustainability landscape
Chapter 5 Market Size and Forecast, By Product, 2022 - 2035 (USD Million & Units)
- 5.1 Key trends
- 5.2 Portable
- 5.3 Panel mounted
Chapter 6 Market Size and Forecast, By Application, 2022 - 2035 (USD Million & Units)
- 6.1 Key trends
- 6.2 Commercial
- 6.3 Industrial
- 6.4 Utility
Chapter 7 Market Size and Forecast, By Phase, 2022 - 2035 (USD Million & Units)
- 7.1 Key trends
- 7.2 Single phase
- 7.3 Three phase
Chapter 8 Market Size and Forecast, By Communication, 2022 - 2035 (USD Million & Units)
- 8.1 Key trends
- 8.2 Wired
- 8.3 Wireless
Chapter 9 Market Size and Forecast, By Region, 2022 - 2035 (USD Million & Units)
- 9.1 Key trends
- 9.2 North America
- 9.2.1 U.S.
- 9.2.2 Canada
- 9.2.3 Mexico
- 9.3 Europe
- 9.3.1 Germany
- 9.3.2 France
- 9.3.3 Russia
- 9.3.4 UK
- 9.3.5 Italy
- 9.3.6 Spain
- 9.3.7 Netherlands
- 9.3.8 Austria
- 9.4 Asia Pacific
- 9.4.1 China
- 9.4.2 Japan
- 9.4.3 South Korea
- 9.4.4 India
- 9.4.5 Australia
- 9.4.6 New Zealand
- 9.4.7 Malaysia
- 9.4.8 Indonesia
- 9.5 Middle East & Africa
- 9.5.1 Saudi Arabia
- 9.5.2 UAE
- 9.5.3 Qatar
- 9.5.4 Egypt
- 9.5.5 South Africa
- 9.5.6 Nigeria
- 9.5.7 Kuwait
- 9.5.8 Oman
- 9.6 Latin America
- 9.6.1 Brazil
- 9.6.2 Peru
- 9.6.3 Argentina
Chapter 10 Company Profiles
- 10.1 ABB
- 10.2 Accuenergy
- 10.3 Algodue Elettronica
- 10.4 Delta Electronics
- 10.5 Eastron Electronic
- 10.6 Eaton
- 10.7 Elspec
- 10.8 Emerson Electric
- 10.9 Fluke Corporation
- 10.10 GE Vernova
- 10.11 Honeywell International
- 10.12 HIOKI E.E. CORPORATION
- 10.13 LUMEL
- 10.14 M B Control & Systems
- 10.15 Megger
- 10.16 Mitsubishi Electric Corporation
- 10.17 MTE Power Quality
- 10.18 PCE Instruments
- 10.19 Phoenix Contact
- 10.20 Rishabh Instruments
- 10.21 Rockwell Automation
- 10.22 Schneider Electric
- 10.23 Siemens
- 10.24 Vitrek

