
PUBLISHER: Global Market Insights Inc. | PRODUCT CODE: 1755369

PUBLISHER: Global Market Insights Inc. | PRODUCT CODE: 1755369
Polymeric Sand Market Opportunity, Growth Drivers, Industry Trend Analysis, and Forecast 2025 - 2034
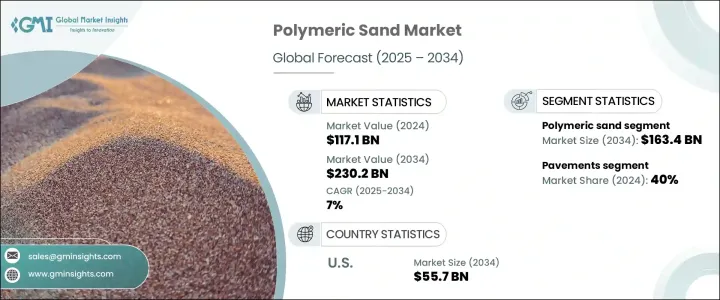
The Global Polymeric Sand Market was valued at USD 117.1 billion in 2024 and is estimated to grow at a CAGR of 7% to reach USD 230.2 billion by 2034. The growth is fueled by a rise in construction projects, ongoing urban development, and consumer preference for durable, low-maintenance materials in landscaping. Polymeric sand has become a go-to material for residential and commercial hardscaping owing to locking pavers in place, reducing weed growth, and resisting erosion and insect damage. Its formulation-fine sand combined with polymer additives-hardens when activated by water, enhancing surface stability and durability. Homeowners, contractors, and municipalities use polymeric sand in patios, driveways, walkways, and pool decks, appreciating its performance and visual appeal. In addition, availability in a variety of colors makes it suitable for aesthetic customization.
As developing economies prioritize modernization and infrastructure upgrades, and wealthier regions continue enhancing their public and private outdoor environments, polymeric sand is increasingly seen as a go-to material. Its practical advantages-such as ease of application, resistance to erosion, and compatibility with various climates-make it an ideal solution across diverse geographies. Professional landscapers rely on it for its strength and efficiency, while homeowners value its ability to reduce maintenance and enhance curb appeal. Additionally, its wide availability in various color options allows users to achieve functional and aesthetic goals in paving projects.
| Market Scope | |
|---|---|
| Start Year | 2024 |
| Forecast Year | 2025-2034 |
| Start Value | $117.1 Billion |
| Forecast Value | $230.2 Billion |
| CAGR | 7% |
In 2024, the polymeric sand segment reached USD 82.2 billion. Its effectiveness in stabilizing joints between pavers- stone, concrete, or brick-has made it the preferred option for patios, driveways, and commercial landscapes. The water-activated bonding agents in polymeric sand form a solid yet flexible joint that resists environmental wear and tear, helping maintain paved surfaces for years. It works especially well in joint widths from 1/8 to 4 inches, which are standard in most paving applications. Both residential and commercial sectors continue to drive growth, with long-term performance and ease of application at the core of its popularity.
The pavement application segment held a 40% share in 2024 and is forecast to grow at a CAGR of 6.8%. Pavements, including urban walkways, garden paths, and pedestrian zones, rely on interlocking pavers and jointing materials that hold up under traffic and weather. Polymeric sand ensures long-term durability, controls weed growth and maintains surface integrity crucial in high-traffic public areas and aesthetically driven residential settings. Cities in regions like Southeast Asia, North America, and Europe are implementing polymeric sand in beautification and sustainability-focused urban development, valuing its drainage efficiency, visual cohesion, and maintenance benefits.
United States Polymeric Sand Market was valued at USD 27.2 billion in 2024 and is expected to generate USD 55.7 billion by 2034. The increasing popularity of outdoor living, including investments in patios, pool decks, and walkways, has made polymeric sand a preferred solution among homeowners and professionals. Its ability to withstand different climates-from harsh winters to humid summers-gives it broad geographic appeal. Retail availability and consumer education on installation, especially through DIY outlets, have further supported growth. Public sector investment in green spaces and infrastructure upgrades also adds to commercial demand, ensuring the product's stronghold in the region.
Key players driving the Global Polymeric Sand Market include Gator Base, Euro Quarz, Pavestone Company, Quikrete, Alliance Designer Products, Sakrete, TCC Materials, Silpro Corporation, CEMEX, Techniseal, Polybind, Romex, SEK Surebond, SPEC MIX, Sable Marco, Ash Grove Cement Company, SRW Products, Tensar Corporation, Basalite Concrete Products, and SpecChem. To reinforce their position in the competitive polymeric sand market, companies prioritize innovation, sustainability, and customer education. Key strategies include enhancing product formulations for better weather resistance and durability, offering eco-friendly variants to meet rising environmental expectations, and expanding product lines to include multiple color and texture options. Many firms leverage digital platforms to connect with contractors and DIY consumers through video tutorials and mobile tools.
Table of Contents
Chapter 1 Methodology & Scope
- 1.1 Market scope & definition
- 1.2 Base estimates & calculations
- 1.3 Forecast parameters
- 1.4 Data sources
- 1.4.1 Primary
- 1.4.2 Secondary
- 1.4.2.1 Paid sources
- 1.4.2.2 Public sources
Chapter 2 Executive Summary
- 2.1 Industry 3600 synopsis, 2021 - 2034
Chapter 3 Industry Insights
- 3.1 Industry ecosystem analysis
- 3.2 Raw material analysis
- 3.3 Key news and initiatives
- 3.4 Regulatory landscape
- 3.5 Impact forces
- 3.5.1 Growth drivers
- 3.5.1.1 Rapid urbanization
- 3.5.1.2 Increasing infrastructure investments
- 3.5.1.3 Growing awareness of long-term cost efficiency
- 3.5.1.4 Growing trend toward urban beautification and landscaping
- 3.5.2 Industry pitfalls & challenges
- 3.5.2.1 Market saturation
- 3.5.1 Growth drivers
- 3.6 Growth potential analysis
- 3.7 Porter's analysis
- 3.7.1 Supplier power
- 3.7.2 Buyer power
- 3.7.3 Threat of new entrants
- 3.7.4 Threat of substitutes
- 3.7.5 Industry rivalry
- 3.8 PESTEL analysis
Chapter 4 Competitive Landscape, 2024
- 4.1 Introduction
- 4.2 Company market share analysis
- 4.3 Competitive positioning matrix
- 4.4 Strategic outlook matrix
Chapter 5 Market Estimates & Forecast, By Product Type, 2021 - 2034, (USD Billion) (Kilo Tons)
- 5.1 Key trends
- 5.2 Polymeric sand
- 5.3 Polymeric dust
Chapter 6 Market Estimates & Forecast, By Application, 2021 - 2034, (USD Billion) (Kilo Tons)
- 6.1 Key trends
- 6.2 Pavements
- 6.3 Parking spaces
- 6.4 Pool decks
- 6.5 Auxiliary building spaces
- 6.6 Patios
- 6.7 Others
Chapter 7 Market Estimates & Forecast, By End Use, 2021 - 2034, (USD Billion) (Kilo Tons)
- 7.1 Key trends
- 7.2 Residential
- 7.3 Commercial
- 7.4 Industrial
- 7.5 Municipal
Chapter 8 Market Estimates & Forecast, By Distribution Channel, 2021 - 2034, (USD Billion) (Kilo Tons)
- 8.1 Key trends
- 8.2 Direct
- 8.3 Indirect
Chapter 9 Market Estimates & Forecast, By Region, 2021 - 2034, (USD Billion) (Kilo Tons)
- 9.1 Key trends
- 9.2 North America
- 9.2.1 U.S.
- 9.2.2 Canada
- 9.3 Europe
- 9.3.1 Germany
- 9.3.2 UK
- 9.3.3 France
- 9.3.4 Italy
- 9.3.5 Spain
- 9.3.6 Rest of Europe
- 9.4 Asia Pacific
- 9.4.1 China
- 9.4.2 India
- 9.4.3 Japan
- 9.4.4 South Korea
- 9.4.5 Australia
- 9.4.6 Rest of Asia Pacific
- 9.5 Latin America
- 9.5.1 Brazil
- 9.5.2 Mexico
- 9.5.3 Rest of Latin America
- 9.6 MEA
- 9.6.1 Saudi Arabia
- 9.6.2 UAE
- 9.6.3 South Africa
- 9.6.4 Rest of MEA
Chapter 10 Company Profiles
- 10.1 Alliance Designer Products
- 10.2 Ash Grove Cement Company
- 10.3 Basalite Concrete Products
- 10.4 CEMEX
- 10.5 Euro Quarz
- 10.6 Gator Base
- 10.7 Pavestone Company
- 10.8 Polybind
- 10.9 Quikrete
- 10.10 Romex
- 10.11 Sable Marco
- 10.12 Sakrete
- 10.13 SEK Surebond
- 10.14 Silpro Corporation
- 10.15 SPEC MIX
- 10.16 SpecChem
- 10.17 SRW Products
- 10.18 TCC Materials
- 10.19 Techniseal
- 10.20 Tensar Corporation

