
PUBLISHER: Global Market Insights Inc. | PRODUCT CODE: 1667033

PUBLISHER: Global Market Insights Inc. | PRODUCT CODE: 1667033
Oil and Gas Carbon Capture and Storage Market Opportunity, Growth Drivers, Industry Trend Analysis, and Forecast 2025 - 2034
The Global Oil And Gas Carbon Capture And Storage Market reached USD 3.9 billion in 2024 and is projected to experience a CAGR of 14.5% from 2025 to 2034. This surge is largely driven by tightening environmental regulations and the increasing commitment to achieving global carbon neutrality goals. Carbon capture technology is becoming an indispensable part of mitigating CO2 emissions, especially in the oil and gas sector, one of the largest contributors to greenhouse gas emissions worldwide. As concerns about climate change intensify, more governments and organizations are prioritizing the development and implementation of sustainable technologies to meet these goals. CCS offers an effective means of reducing carbon footprints, particularly in industries with high emissions like oil and gas.
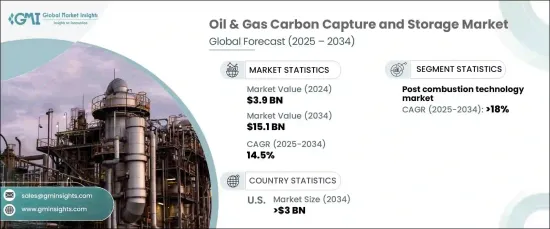
Over the next decade, the market is expected to grow exponentially, with projections estimating that it will generate USD 15 billion by 2034. The increased focus on reducing carbon emissions, along with the growing demand for energy, is expected to be a driving force for the adoption of CCS technologies. Upstream operations in the oil and gas industry, as well as the rising need for sustainable power generation, are expected to play a major role in shaping the market's future. These industries are among the largest contributors to CO2 emissions, making the integration of CCS solutions even more critical. The capture and storage of carbon dioxide are becoming central to oil and gas extraction and production processes, which often involve large-scale exploration activities that generate significant CO2 emissions. The most common CCS technologies, including oxy-fuel combustion, pre-combustion, and post-combustion, are being adopted to capture CO2 from natural gas processing plants, refineries, and enhanced oil recovery (EOR) operations.
| Market Scope | |
|---|---|
| Start Year | 2024 |
| Forecast Year | 2025-2034 |
| Start Value | $3.9 Billion |
| Forecast Value | $15.1 Billion |
| CAGR | 14.5% |
Among these CCS technologies, post-combustion is projected to see the highest growth, with an expected CAGR of 18% through 2034. Post-combustion captures CO2 from flue gases produced during the combustion of fossil fuels, a major byproduct of power generation, refining, and petrochemical industries. This technology is quickly becoming a key player in efforts to reduce emissions as global demand for oil and gas continues to rise. Post-combustion technology offers a practical solution for industries to meet sustainability goals without disrupting existing operations.
In the U.S., the oil and gas carbon capture and storage market is projected to reach USD 3 billion by 2034, driven by stricter emissions regulations and increased investments in sustainable technologies. Significant focus is being placed on enhanced oil recovery (EOR) and natural gas processing, where CCS solutions are being widely adopted to both reduce emissions and enhance production. Moreover, the collaboration between public and private sectors is accelerating the development of large-scale CCS projects, solidifying the U.S. position as a global leader in the carbon capture industry. These initiatives are expected to play a key role in reducing emissions on a global scale while also driving continued growth and innovation within the sector.
Table of Contents
Chapter 1 Methodology & Scope
- 1.1 Market scope & definitions
- 1.2 Market estimates & forecast parameters
- 1.3 Forecast calculation
- 1.4 Data sources
- 1.4.1 Primary
- 1.4.2 Secondary
- 1.4.2.1 Paid
- 1.4.2.2 Public
Chapter 2 Executive Summary
- 2.1 Industry synopsis, 2021 - 2034
Chapter 3 Industry Insights
- 3.1 Industry ecosystem analysis
- 3.2 Regulatory landscape
- 3.3 Industry impact forces
- 3.3.1 Growth drivers
- 3.3.2 Industry pitfalls & challenges
- 3.4 Growth potential analysis
- 3.5 Porter's analysis
- 3.5.1 Bargaining power of suppliers
- 3.5.2 Bargaining power of buyers
- 3.5.3 Threat of new entrants
- 3.5.4 Threat of substitutes
- 3.6 PESTEL analysis
Chapter 4 Competitive Landscape, 2024
- 4.1 Introduction
- 4.2 Strategic outlook
- 4.3 Innovation & sustainability landscape
Chapter 5 Market Size and Forecast, By Technology, 2021 – 2034 (MTPA, USD Billion)
- 5.1 Key trends
- 5.2 Pre combustion
- 5.3 Post combustion
- 5.4 Oxy-Fuel combustion
Chapter 6 Market Size and Forecast, By Region, 2021 – 2034 (MTPA, USD Billion)
- 6.1 Key trends
- 6.2 North America
- 6.2.1 U.S.
- 6.2.2 Canada
- 6.3 Europe
- 6.3.1 UK
- 6.3.2 Germany
- 6.3.3 Denmark
- 6.4 Asia Pacific
- 6.4.1 China
- 6.4.2 Australia
- 6.4.3 South Korea
- 6.5 Rest of World
Chapter 7 Company Profiles
- 7.1 Air Products
- 7.2 Aker Solutions
- 7.3 Chevron
- 7.4 Dakota Gasification Company
- 7.5 Equinor
- 7.6 Exxon Mobil
- 7.7 Fluor
- 7.8 General Electric
- 7.9 Halliburton
- 7.10 Linde
- 7.11 Mitsubishi Heavy Industries
- 7.12 NRG Energy
- 7.13 Shell Cansolv
- 7.14 Siemens
- 7.15 SLB
- 7.16 Sulzer
- 7.17 TotalEnergies

