
PUBLISHER: Global Market Insights Inc. | PRODUCT CODE: 1721608

PUBLISHER: Global Market Insights Inc. | PRODUCT CODE: 1721608
Ready-mix Concrete Market Opportunity, Growth Drivers, Industry Trend Analysis, and Forecast 2025 - 2034
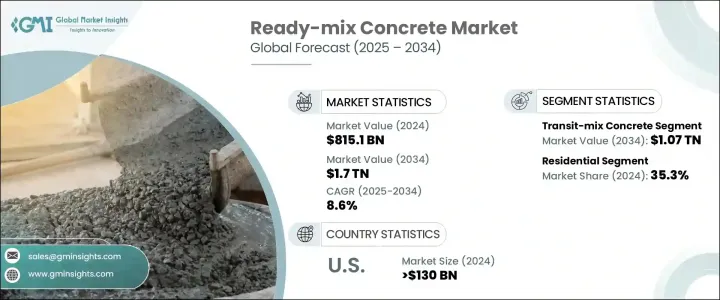
The Global Ready-Mix Concrete Market was valued at USD 815.1 billion in 2024 and is estimated to grow at a CAGR of 8.6% to reach USD 1.7 trillion by 2034, driven by rapid urban expansion, rising populations, and an urgent need for new infrastructure. As cities continue to swell and modernize, the demand for efficient, durable, and sustainable building materials is soaring. Ready-mix concrete is rapidly emerging as a critical solution, offering the perfect blend of strength, convenience, and environmental efficiency. Government initiatives to upgrade aging infrastructure, private investments in commercial real estate, and a booming residential construction sector are all fueling momentum. The increasing emphasis on green construction and sustainable urban planning further boosts demand for high-performance concrete solutions. Ready-mix concrete's ability to deliver consistent quality, minimize on-site labor, and reduce material waste makes it the material of choice for contemporary construction needs, where speed, precision, and durability are non-negotiable. Moreover, the market is benefiting from advancements in concrete technology, including smart batching systems, eco-friendly mixes, and digitalized supply chains, all aimed at enhancing operational efficiency and meeting evolving regulatory standards.
Large-scale infrastructure projects, from highways and tunnels to airports and metro systems, are playing a pivotal role in driving market growth. Concrete remains indispensable due to its strength and versatility across varied climate zones and diverse applications. Both emerging and developed economies are witnessing a heightened need for new public facilities, such as healthcare centers, educational institutions, and transportation hubs, thereby accelerating the adoption of ready-mix concrete solutions. Produced in controlled environments, ready-mix concrete ensures superior performance, faster application, and unmatched reliability across residential and commercial construction.
| Market Scope | |
|---|---|
| Start Year | 2024 |
| Forecast Year | 2025-2034 |
| Start Value | $815.1 Billion |
| Forecast Value | $1.7 Trillion |
| CAGR | 8.6% |
Transit mix concrete led the global market by generating USD 524.4 billion in 2024 and is projected to reach USD 1.07 trillion by 2034. Its leadership stems from the ease of transport, consistent batch quality, and adaptability to a wide range of projects. Mixed while in transit, this type of concrete eliminates the complexities of on-site batching and maintains product integrity, even in remote locations. Its versatility supports projects ranging from small residential builds to sprawling commercial complexes.
The residential sector dominated end-use demand in 2024, capturing a 35.3% share of the global ready-mix concrete market. The surge in urban migration and the unrelenting demand for new housing developments are key contributors. As cities expand, the need for durable, low-maintenance construction solutions grows, with ready-mix concrete standing out for its reliable strength and construction efficiency.
The United States Ready-Mix Concrete Market generated USD 130 billion in 2024 and is expected to grow at a CAGR of 8% through 2034, supported by robust federal and state investments in infrastructure upgrades alongside a rise in residential and mixed-use developments. Expanding suburban areas, increasing home renovation trends, and a strong focus on urban renewal initiatives are also significantly boosting demand across the country.
Key players in the Global Ready-Mix Concrete Industry include Heidelberg Materials, Dillon Bros Ready Mix Concrete, CEMEX, U.S. Concrete, HOLCIM, R.W. Sidley, Livingston's Concrete Service, ACC Limited, UltraTech Cement, Buzzi, Vicat, China National Building Material Group Corporation, and Barney & Dickenson. Leading companies are reinforcing their market presence by adopting vertical integration strategies, expanding regional production footprints, and investing heavily in sustainable product innovations. Mergers and acquisitions remain a favored strategy to broaden geographic reach and technological capabilities, while digital advancements are streamlining batching and delivery operations. Innovation in low-carbon and high-performance concrete solutions is also helping players meet evolving environmental standards and cater to the demands of modern construction.
Table of Contents
Chapter 1 Methodology & Scope
- 1.1 Market scope & definition
- 1.2 Base estimates & calculations
- 1.3 Forecast calculation
- 1.4 Data sources
- 1.4.1 Primary
- 1.4.2 Secondary
- 1.4.2.1 Paid sources
- 1.4.2.2 Public sources
Chapter 2 Executive Summary
- 2.1 Industry synopsis, 2021 - 2034
Chapter 3 Industry Insights
- 3.1 Industry ecosystem analysis
- 3.1.1 Factor affecting the value chain
- 3.1.2 Profit margin analysis
- 3.1.3 Disruptions
- 3.1.4 Future outlook
- 3.1.5 Manufacturers
- 3.1.6 Distributors
- 3.2 Impact of trump administration tariffs – structured overview
- 3.2.1 Impact on trade
- 3.2.1.1 Trade volume disruptions
- 3.2.1.2 Retaliatory measures
- 3.2.2 Impact on the industry
- 3.2.2.1 Supply-Side impact (Raw Materials)
- 3.2.2.1.1 Price volatility in key materials
- 3.2.2.1.2 Supply chain restructuring
- 3.2.2.1.3 Production cost implications
- 3.2.2.2 Demand-Side impact (Selling Price)
- 3.2.2.2.1.1 Price transmission to end markets
- 3.2.2.2.1.2 Market share dynamics
- 3.2.2.2.1.3 Consumer response patterns
- 3.2.2.1 Supply-Side impact (Raw Materials)
- 3.2.3 Key companies impacted
- 3.2.4 Strategic industry responses
- 3.2.4.1 Supply chain reconfiguration
- 3.2.4.2 Pricing and product strategies
- 3.2.4.3 Policy engagement
- 3.2.5 Outlook and future considerations
- 3.2.1 Impact on trade
- 3.3 Trade statistics (HS Code: 38245010)
Note: the above trade statistics will be provided for key countries
- 3.4 Supplier landscape
- 3.5 Profit margin analysis
- 3.6 Key news & initiatives
- 3.7 Regulatory landscape
- 3.8 Impact forces
- 3.8.1 Growth drivers
- 3.8.1.1 Rising urbanization and infrastructure development
- 3.8.1.2 Growing demand for sustainable and green construction
- 3.8.1.3 Time and cost efficiency in construction
- 3.8.2 Industry pitfalls & challenges
- 3.8.2.1 High logistics and transportation costs
- 3.8.1 Growth drivers
- 3.9 Growth potential analysis
- 3.10 Porter’s analysis
- 3.11 PESTEL analysis
Chapter 4 Competitive Landscape, 2024
- 4.1 Introduction
- 4.2 Company market share analysis
- 4.3 Competitive positioning matrix
- 4.4 Strategic outlook matrix
Chapter 5 Market Size and Forecast, By Type, 2021 - 2034 (USD Million) (Tons)
- 5.1 Key trends
- 5.2 Transit mix concrete
- 5.3 Shrink mix concrete
- 5.4 Central mix concrete
Chapter 6 Market Size and Forecast, By Application, 2021 - 2034 (USD Million) (Tons)
- 6.1 Key trends
- 6.2 Commercial
- 6.3 Infrastructure
- 6.4 Residential
- 6.5 Industrial
Chapter 7 Market Size and Forecast, By Production, 2021 - 2034 (USD Million) (Tons)
- 7.1 Key trends
- 7.2 On-site
- 7.3 Off-site
Chapter 8 Market Size and Forecast, By Region, 2021 - 2034 (USD Million) (Tons)
- 8.1 Key trends
- 8.2 North America
- 8.2.1 U.S.
- 8.2.2 Canada
- 8.3 Europe
- 8.3.1 UK
- 8.3.2 Germany
- 8.3.3 France
- 8.3.4 Italy
- 8.3.5 Spain
- 8.4 Asia Pacific
- 8.4.1 China
- 8.4.2 India
- 8.4.3 Japan
- 8.4.4 South Korea
- 8.4.5 Australia
- 8.5 Latin America
- 8.5.1 Brazil
- 8.5.2 Mexico
- 8.5.3 Argentina
- 8.6 MEA
- 8.6.1 South Africa
- 8.6.2 Saudi Arabia
- 8.6.3 UAE
Chapter 9 Company Profiles
- 9.1 ACC Limited
- 9.2 Barney & Dickenson
- 9.3 Buzzi
- 9.4 CEMEX
- 9.5 China National Building Material Group Corporation
- 9.6 Dillon Bros Ready Mix Concrete
- 9.7 Heidelberg Materials
- 9.8 HOLCIM
- 9.9 Livingston's Concrete Service
- 9.10 R.W. Sidley
- 9.11 U.S. Concrete
- 9.12 UltraTech Cement
- 9.13 Vicat

