
PUBLISHER: Coherent Market Insights | PRODUCT CODE: 1699527

PUBLISHER: Coherent Market Insights | PRODUCT CODE: 1699527
Customer Journey Analytics Market, By Data Source, By Application, By Geography
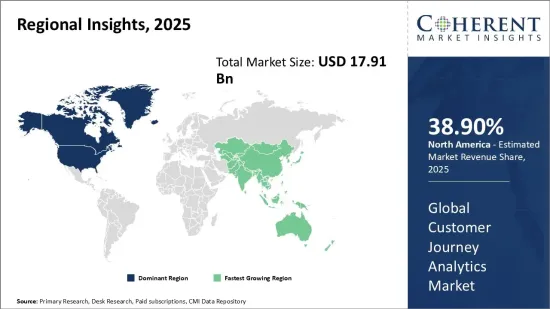
Global Customer Journey Analytics Market is estimated to be valued at US$ 17.91 Bn in 2025 and is expected to reach US$ 47.06 Bn by 2032, growing at a compound annual growth rate (CAGR) of 14.8% from 2025 to 2032.
| Report Coverage | Report Details | ||
|---|---|---|---|
| Base Year: | 2024 | Market Size in 2025: | USD 17.91 Bn |
| Historical Data for: | 2020 To 2024 | Forecast Period: | 2025 To 2032 |
| Forecast Period 2025 to 2032 CAGR: | 14.80% | 2032 Value Projection: | USD 47.06 Bn |
The global customer journey analytics market has been gaining significant traction over the past few years. Customer journey analytics refers to mapping out customer behavior and interactions across multiple channels to gain valuable insights into how customers move through the buying process. Rising adoption of digital technologies has dramatically increased the volume and variety of customer data available. Businesses are leveraging customer journey analytics solutions to collect and analyze this huge trove of data to gain a unified view of the customer and identify opportunities to improve satisfaction levels. Growing need for enhanced customer experience, focus on omni-channel engagement strategies, and ability to measure Return on Investment (ROI) of marketing spend are some of the key factors fueling demand in this market. However, data privacy regulations pose challenges for analytics solution providers to some extent.
Market Dynamics:
Rapid digitalization across industries has created an abundance of customer data that need to be processed and analyzed using advanced technologies. Rising adoption of analytics tools to tap into customer behavioral patterns and drive personalized engagements is a major growth driver. However, data security concerns and lack of skilled professionals pose challenges. Market players are focusing on developing new capabilities around social media interactions and mobile apps usage patterns. Integration of emerging technologies, such as artificial intelligence and machine learning into journey analytics platforms, is also expanding business opportunities. North America currently dominates the market in terms of revenue share owing to a wide presence of analytics vendors and early adoption by businesses. However, the Asia Pacific customer journey analytics market is gaining traction rapidly with growing digital transformation initiatives.
Key Features of the Study:
This report provides in-depth analysis of the global customer journey analytics market, and provides market size (US$ Billion) and compound annual growth rate (CAGR%) for the forecast period (2025-2032), considering 2024 as the base year
It elucidates potential revenue opportunities across different segments and explains attractive investment proposition matrices for this market
This study also provides key insights about market drivers, restraints, opportunities, new product launches or approvals, market trends, regional outlook, and competitive strategies adopted by key players
It profiles key players in the global customer journey analytics market based on the following parameters - company highlights, products portfolio, key highlights, financial performance, and strategies
Key companies covered as a part of this study include Adobe Inc., Salesforce.com, Inc., IBM Corporation, SAP SE, Microsoft Corporation, Oracle Corporation, NICE Ltd., Verint Systems Inc., Pointillist, ClickFox, Kitewheel, Quadient, Thunderhead, Genesys, and Servion Global Solutions
Insights from this report would allow marketers and the management authorities of the companies to make informed decisions regarding their future product launches, type up-gradation, market expansion, and marketing tactics
The global customer journey analytics market report caters to various stakeholders in this industry including investors, suppliers, product manufacturers, distributors, new entrants, and financial analysts
Stakeholders would have ease in decision-making through various strategy matrices used in analyzing the global customer journey analytics market
Market Segmentation
- Data Source Insights (Revenue, USD Bn, 2020 - 2032)
- Web
- Social Media
- Mobile
- Application Insights (Revenue, USD Bn, 2020 - 2032)
- Customer Experience Management
- Customer Segmentation and Targeting
- Brand Management
- Others
- Regional Insights (Revenue, USD Bn, 2020 - 2032)
- North America
- U.S.
- Canada
- Latin America
- Brazil
- Argentina
- Mexico
- Rest of Latin America
- Europe
- Germany
- U.K.
- Spain
- France
- Italy
- Russia
- Rest of Europe
- Asia Pacific
- China
- India
- Japan
- Australia
- South Korea
- ASEAN
- Rest of Asia Pacific
- Middle East
- GCC Countries
- Israel
- Rest of Middle East
- Africa
- South Africa
- North Africa
- Central Africa
- Key Players Insights
- Adobe Inc.
- Salesforce.com, Inc.
- IBM Corporation
- SAP SE
- Microsoft Corporation
- Oracle Corporation
- NICE Ltd.
- Verint Systems Inc.
- Pointillist
- ClickFox
- Kitewheel
- Quadient
- Thunderhead
- Genesys
- Servion Global Solutions
Table of Contents
1. Research Objectives and Assumptions
- Research Objectives
- Assumptions
- Abbreviations
2. Market Purview
- Report Description
- Market Definition and Scope
- Executive Summary
- Global Customer Journey Analytics Market, By Data Source
- Global Customer Journey Analytics Market, By Application
- Global Customer Journey Analytics Market, By Region
3. Market Dynamics, Regulations, and Trends Analysis
- Market Dynamics
- Impact Analysis
- Key Highlights
- Regulatory Scenario
- Product Launches/Approvals
- PEST Analysis
- PORTER's Analysis
- Market Opportunities
- Regulatory Scenario
- Key Developments
- Industry Trends
4. Global Customer Journey Analytics Market, By Data Source, 2020-2032, (USD Bn)
- Introduction
- Market Share Analysis, 2025 and 2032 (%)
- Y-o-Y Growth Analysis, 2021 - 2032
- Segment Trends
- Web
- Introduction
- Market Size and Forecast, and Y-o-Y Growth, 2020-2032, (USD Bn)
- Social Media
- Introduction
- Market Size and Forecast, and Y-o-Y Growth, 2020-2032, (USD Bn)
- Mobile
- Introduction
- Market Size and Forecast, and Y-o-Y Growth, 2020-2032, (USD Bn)
- Email
- Introduction
- Market Size and Forecast, and Y-o-Y Growth, 2020-2032, (USD Bn)
5. Global Customer Journey Analytics Market, By Application, 2020-2032, (USD Bn)
- Introduction
- Market Share Analysis, 2025 and 2032 (%)
- Y-o-Y Growth Analysis, 2021 - 2032
- Segment Trends
- Customer Experience Management
- Introduction
- Market Size and Forecast, and Y-o-Y Growth, 2020-2032, (USD Bn)
- Customer Segmentation and Targeting
- Introduction
- Market Size and Forecast, and Y-o-Y Growth, 2020-2032, (USD Bn)
- Brand Management
- Introduction
- Market Size and Forecast, and Y-o-Y Growth, 2020-2032, (USD Bn)
- Others
- Introduction
- Market Size and Forecast, and Y-o-Y Growth, 2020-2032, (USD Bn)
6. Global Customer Journey Analytics Market, By Region, 2020 - 2032, Value (USD Bn)
- Introduction
- Market Share (%) Analysis, 2025, 2028 & 2032, Value (USD Bn)
- Market Y-o-Y Growth Analysis (%), 2021 - 2032, Value (USD Bn)
- Regional Trends
- North America
- Introduction
- Market Size and Forecast, By Data Source, 2020 - 2032, Value (USD Bn)
- Market Size and Forecast, By Application, 2020 - 2032, Value (USD Bn)
- Market Size and Forecast, By Country, 2020 - 2032, Value (USD Bn)
- U.S.
- Canada
- Latin America
- Introduction
- Market Size and Forecast, By Data Source, 2020 - 2032, Value (USD Bn)
- Market Size and Forecast, By Application, 2020 - 2032, Value (USD Bn)
- Market Size and Forecast, By Country, 2020 - 2032, Value (USD Bn)
- Brazil
- Argentina
- Mexico
- Rest of Latin America
- Europe
- Introduction
- Market Size and Forecast, By Data Source, 2020 - 2032, Value (USD Bn)
- Market Size and Forecast, By Application, 2020 - 2032, Value (USD Bn)
- Market Size and Forecast, By Country, 2020 - 2032, Value (USD Bn)
- Germany
- U.K.
- Spain
- France
- Italy
- Russia
- Rest of Europe
- Asia Pacific
- Introduction
- Market Size and Forecast, By Data Source, 2020 - 2032, Value (USD Bn)
- Market Size and Forecast, By Application, 2020 - 2032, Value (USD Bn)
- Market Size and Forecast, By Country, 2020 - 2032, Value (USD Bn)
- China
- India
- Japan
- Australia
- South Korea
- ASEAN
- Rest of Asia Pacific
- Middle East
- Introduction
- Market Size and Forecast, By Data Source, 2020 - 2032, Value (USD Bn)
- Market Size and Forecast, By Application, 2020 - 2032, Value (USD Bn)
- Market Size and Forecast, By Country, 2020 - 2032, Value (USD Bn)
- GCC Countries
- Israel
- Rest of Middle East
- Africa
- Introduction
- Market Size and Forecast, By Data Source, 2020 - 2032, Value (USD Bn)
- Market Size and Forecast, By Application, 2020 - 2032, Value (USD Bn)
- Market Size and Forecast, By Country/Region, 2020 - 2032, Value (USD Bn)
- South Africa
- North Africa
- Central Africa
7. Competitive Landscape
- Adobe Inc.
- Company Highlights
- Product Portfolio
- Key Developments
- Financial Performance
- Strategies
- Salesforce.com, Inc.
- Company Highlights
- Product Portfolio
- Key Developments
- Financial Performance
- Strategies
- IBM Corporation
- Company Highlights
- Product Portfolio
- Key Developments
- Financial Performance
- Strategies
- SAP SE
- Company Highlights
- Product Portfolio
- Key Developments
- Financial Performance
- Strategies
- Microsoft Corporation
- Company Highlights
- Product Portfolio
- Key Developments
- Financial Performance
- Strategies
- Oracle Corporation
- Company Highlights
- Product Portfolio
- Key Developments
- Financial Performance
- Strategies
- NICE Ltd.
- Company Highlights
- Product Portfolio
- Key Developments
- Financial Performance
- Strategies
- Verint Systems Inc.
- Company Highlights
- Product Portfolio
- Key Developments
- Financial Performance
- Strategies
- Pointillist
- ClickFox
- Kitewheel
- Quadient
- Thunderhead
- Genesys
- Servion Global Solutions
8. Analyst Recommendations
- Wheel of Fortune
- Analyst View
- Coherent Opportunity Map
9. References and Research Methodology
- References
- Research Methodology
- About us

