
PUBLISHER: Coherent Market Insights | PRODUCT CODE: 1672709

PUBLISHER: Coherent Market Insights | PRODUCT CODE: 1672709
OLED Displays Market, By Display Type, By Application, By End User, By Geography
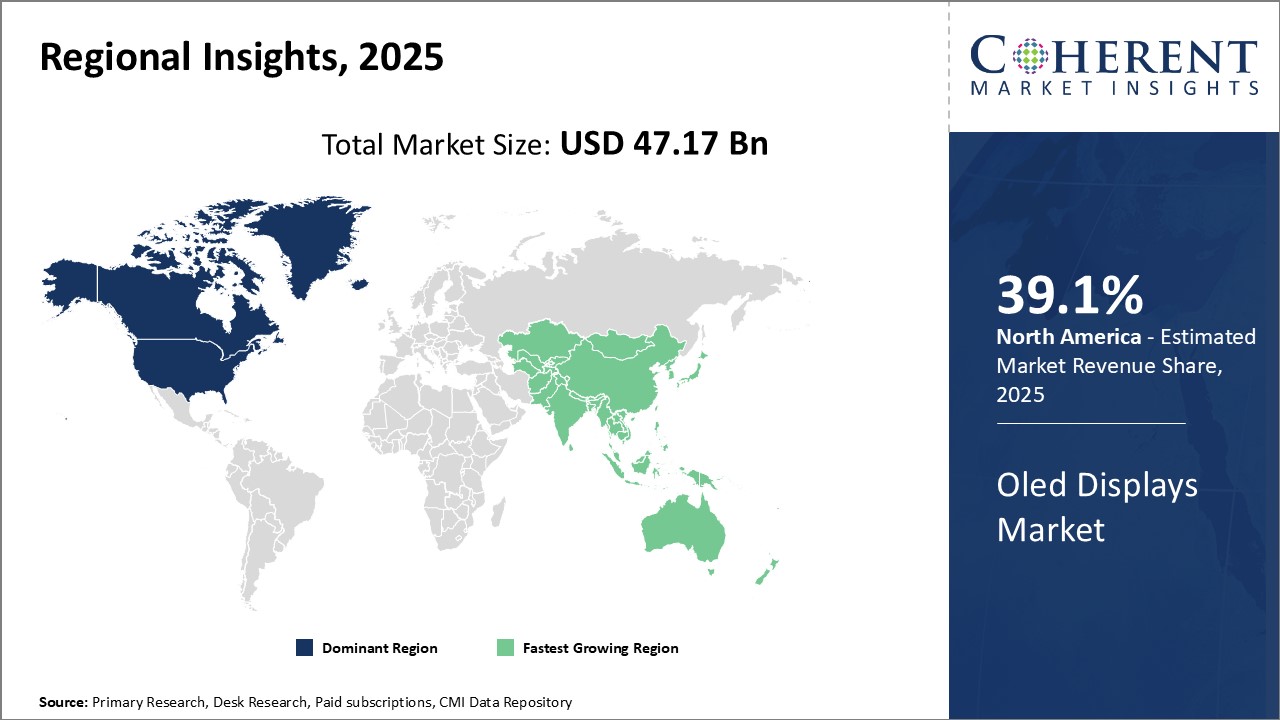
Global Oled Displays Market is estimated to be valued at USD 47.17 Bn in 2025 and is expected to reach USD 121.04 Bn by 2032, growing at a compound annual growth rate (CAGR) of 14.4% from 2025 to 2032.
| Report Coverage | Report Details | ||
|---|---|---|---|
| Base Year: | 2024 | Market Size in 2025: | USD 47.17 Bn |
| Historical Data for: | 2020 To 2024 | Forecast Period: | 2025 To 2032 |
| Forecast Period 2025 to 2032 CAGR: | 14.40% | 2032 Value Projection: | USD 121.04 Bn |
The OLED displays market is witnessing significant growth globally. OLED or organic light-emitting diode is a light-emitting technology that uses thin films made of organic compounds that emit light when electric current is applied. OLED displays are increasingly replacing LCD displays owing to their superior properties such as high contrast, wide viewing angles, vivid colors, thin size, and flexibility. Advancements in OLED technology have enabled their use across various industries including smartphones, televisions, laptops, signs & lighting, wearables, and others. The future prospects for the OLED display market remain bullish with analysts predicting double-digit growth rates over the next decade on the back of rising demand from diversifying end-use industries.
Market Dynamics:
The global OLED displays market is being driven by factors such as the advent of OLED televisions, increasing demand for large-size & flexible displays, miniaturization of electronic devices, and innovations enabling new form factors. However, high manufacturing costs, limited lifespans, and challenges in mass production are some challenges dampening market growth. Opportunities lie in the adoption of transparent OLED displays in digital signage and development of transparent & wearable displays for augmented reality applications.
Key features of the study:
This report provides in-depth analysis of the global OLED displays market, and provides market size (US$ Bn) and compound annual growth rate (CAGR%) for the forecast period (2025-2032), considering 2024 as the base year
It elucidates potential revenue opportunities across different segments and explains attractive investment proposition matrices for this market
This study also provides key insights about market drivers, restraints, opportunities, new product launches or approval, market trends, regional outlook, and competitive strategies adopted by key players
Key companies covered as a part of this study include AU Optronics, BOE Technology Group, Canon Inc., LG Display, Mitsubishi Electric Corporation, Panasonic Corporation, Samsung Display, Sharp Corporation, Sony Corporation, Sumitomo Chemical Co., Ltd., Tianma Microelectronics, Universal Display Corporation, Visionox Technology Inc., Wistron NeWeb Corporation, and JOLED Inc.
Insights from this report would allow marketers and the management authorities of the companies to make informed decisions regarding their future product launches, type up-gradation, market expansion, and marketing tactics
The global OLED displays market report caters to various stakeholders in this industry including investors, suppliers, product manufacturers, distributors, new entrants, and financial analysts
Stakeholders would have ease in decision-making through various strategy matrices used in analyzing the global OLED displays market.
Detailed Segmentation:
- Display Type Insights (Revenue, USD Bn, 2020 - 2032)
- Flexible OLED Displays
- Rigid OLED Displays
- Transparent OLED Displays
- Foldable OLED Displays
- Application Insights (Revenue, USD Bn, 2020 - 2032)
- Smartphones and Tablets
- Televisions
- Laptops and Desktops
- Wearables
- Automotive Displays
- Others (Industrial, Signage, etc.)
- End User Insights (Revenue, USD Bn, 2020 - 2032)
- Consumer Electronics
- Automotive
- Aerospace and Defense
- Healthcare
- Others (Industrial, Retail, etc.)
- By Regional Insights (Revenue, USD Bn, 2020 - 2032)
- North America
- U.S.
- Canada
- Latin America
- Brazil
- Argentina
- Mexico
- Rest of Latin America
- Europe
- Germany
- U.K.
- Spain
- France
- Italy
- Russia
- Rest of Europe
- Asia Pacific
- China
- India
- Japan
- Australia
- South Korea
- ASEAN
- Rest of Asia Pacific
- Middle East
- GCC Countries
- Israel
- Rest of Middle East
- Africa
- South Africa
- North Africa
- Central Africa
- Key Players Insights
- AU Optronics
- BOE Technology Group
- Canon Inc.
- LG Display
- Mitsubishi Electric Corporation
- Panasonic Corporation
- Samsung Display
- Sharp Corporation
- Sony Corporation
- Sumitomo Chemical Co., Ltd.
- Tianma Microelectronics
- Universal Display Corporation
- Visionox Technology Inc.
- Wistron NeWeb Corporation
- JOLED Inc.
Table of Contents
1. RESEARCH OBJECTIVES AND ASSUMPTIONS
- Research Objectives
- Assumptions
- Abbreviations
2. MARKET PURVIEW
- Report Description
- Market Definition and Scope
- Executive Summary
- Global OLED Displays Market, By Display Type
- Global OLED Displays Market, By Application
- Global OLED Displays Market, By End User
- Global OLED Displays Market, By Region
3. MARKET DYNAMICS, REGULATIONS, AND TRENDS ANALYSIS
- Market Dynamics
- Impact Analysis
- Key Highlights
- Regulatory Scenario
- Product Launches/Approvals
- PEST Analysis
- PORTER's Analysis
- Merger and Acquisition Scenario
4. Global OLED Displays Market, By Display Type, 2025-2032, (USD Bn)
- Introduction
- Market Share Analysis, 2025 and 2032 (%)
- Y-o-Y Growth Analysis, 2020 - 2032
- Segment Trends
- Flexible OLED Displays
- Introduction
- Market Size and Forecast, and Y-o-Y Growth, 2020-2032, (USD Bn)
- Rigid OLED Displays
- Introduction
- Market Size and Forecast, and Y-o-Y Growth, 2020-2032, (USD Bn)
- Transparent OLED Displays
- Introduction
- Market Size and Forecast, and Y-o-Y Growth, 2020-2032, (USD Bn)
- Foldable OLED Displays
- Introduction
- Market Size and Forecast, and Y-o-Y Growth, 2020-2032, (USD Bn)
5. Global OLED Displays Market, By Application, 2025-2032, (USD Bn)
- Introduction
- Market Share Analysis, 2025 and 2032 (%)
- Y-o-Y Growth Analysis, 2020 - 2032
- Segment Trends
- Smartphones and Tablets
- Introduction
- Market Size and Forecast, and Y-o-Y Growth, 2020-2032, (USD Bn)
- Televisions
- Introduction
- Market Size and Forecast, and Y-o-Y Growth, 2020-2032, (USD Bn)
- Laptops and Desktops
- Introduction
- Market Size and Forecast, and Y-o-Y Growth, 2020-2032, (USD Bn)
- Wearables
- Introduction
- Market Size and Forecast, and Y-o-Y Growth, 2020-2032, (USD Bn)
- Automotive Displays
- Introduction
- Market Size and Forecast, and Y-o-Y Growth, 2020-2032, (USD Bn)
- Others (Industrial, Signage, etc.)
- Introduction
- Market Size and Forecast, and Y-o-Y Growth, 2020-2032, (USD Bn)
6. Global OLED Displays Market, By End User, 2025-2032, (USD Bn)
- Introduction
- Market Share Analysis, 2025 and 2032 (%)
- Y-o-Y Growth Analysis, 2020 - 2032
- Segment Trends
- Consumer Electronics
- Introduction
- Market Size and Forecast, and Y-o-Y Growth, 2020-2032, (USD Bn)
- Automotive
- Introduction
- Market Size and Forecast, and Y-o-Y Growth, 2020-2032, (USD Bn)
- Aerospace and Defense
- Introduction
- Market Size and Forecast, and Y-o-Y Growth, 2020-2032, (USD Bn)
- Healthcare
- Introduction
- Market Size and Forecast, and Y-o-Y Growth, 2020-2032, (USD Bn)
- Others (Industrial, Retail, etc.)
- Introduction
- Market Size and Forecast, and Y-o-Y Growth, 2020-2032, (USD Bn)
7. Global OLED Displays Market, By Region, 2020 - 2032, Value (USD Bn)
- Introduction
- Market Share (%) Analysis, 2025,2028 & 2032, Value (USD Bn)
- Market Y-o-Y Growth Analysis (%), 2020 - 2032, Value (USD Bn)
- Regional Trends
- North America
- Introduction
- Market Size and Forecast, By Display Type, 2020 - 2032, Value (USD Bn)
- Market Size and Forecast, By Application, 2020 - 2032, Value (USD Bn)
- Market Size and Forecast, By End User, 2020 - 2032, Value (USD Bn)
- Market Size and Forecast, By Country, 2020 - 2032, Value (USD Bn)
- U.S.
- Canada
- Latin America
- Introduction
- Market Size and Forecast, By Display Type, 2020 - 2032, Value (USD Bn)
- Market Size and Forecast, By Application, 2020 - 2032, Value (USD Bn)
- Market Size and Forecast, By End User, 2020 - 2032, Value (USD Bn)
- Market Size and Forecast, By Country, 2020 - 2032, Value (USD Bn)
- Brazil
- Argentina
- Mexico
- Rest of Latin America
- Europe
- Introduction
- Market Size and Forecast, By Display Type, 2020 - 2032, Value (USD Bn)
- Market Size and Forecast, By Application, 2020 - 2032, Value (USD Bn)
- Market Size and Forecast, By End User, 2020 - 2032, Value (USD Bn)
- Market Size and Forecast, By Country, 2020 - 2032, Value (USD Bn)
- Germany
- U.K.
- Spain
- France
- Italy
- Russia
- Rest of Europe
- Asia Pacific
- Introduction
- Market Size and Forecast, By Display Type, 2020 - 2032, Value (USD Bn)
- Market Size and Forecast, By Application, 2020 - 2032, Value (USD Bn)
- Market Size and Forecast, By End User, 2020 - 2032, Value (USD Bn)
- Market Size and Forecast, By Country, 2020 - 2032, Value (USD Bn)
- China
- India
- Japan
- Australia
- South Korea
- ASEAN
- Rest of Asia Pacific
- Middle East
- Introduction
- Market Size and Forecast, By Display Type, 2020 - 2032, Value (USD Bn)
- Market Size and Forecast, By Application, 2020 - 2032, Value (USD Bn)
- Market Size and Forecast, By End User, 2020 - 2032, Value (USD Bn)
- Market Size and Forecast, By Country, 2020 - 2032, Value (USD Bn)
- GCC Countries
- Israel
- Rest of Middle East
- Africa
- Introduction
- Market Size and Forecast, By Display Type, 2020 - 2032, Value (USD Bn)
- Market Size and Forecast, By Application, 2020 - 2032, Value (USD Bn)
- Market Size and Forecast, By End User, 2020 - 2032, Value (USD Bn)
- Market Size and Forecast, By Country, 2020 - 2032, Value (USD Bn)
- South Africa
- North Africa
- Central Africa
8. COMPETITIVE LANDSCAPE
- AU Optronics
- Company Highlights
- Product Portfolio
- Key Developments
- Financial Performance
- Strategies
- BOE Technology Group
- Company Highlights
- Product Portfolio
- Key Developments
- Financial Performance
- Strategies
- Canon Inc.
- Company Highlights
- Product Portfolio
- Key Developments
- Financial Performance
- Strategies
- LG Display
- Company Highlights
- Product Portfolio
- Key Developments
- Financial Performance
- Strategies
- Mitsubishi Electric Corporation
- Company Highlights
- Product Portfolio
- Key Developments
- Financial Performance
- Strategies
- Panasonic Corporation
- Company Highlights
- Product Portfolio
- Key Developments
- Financial Performance
- Strategies
- Samsung Display
- Company Highlights
- Product Portfolio
- Key Developments
- Financial Performance
- Strategies
- Sharp Corporation
- Company Highlights
- Product Portfolio
- Key Developments
- Financial Performance
- Strategies
- Sony Corporation
- Company Highlights
- Product Portfolio
- Key Developments
- Financial Performance
- Strategies
- Sumitomo Chemical Co., Ltd.
- Company Highlights
- Product Portfolio
- Key Developments
- Financial Performance
- Strategies
- Tianma Microelectronics
- Universal Display Corporation
- Visionox Technology Inc.
- Wistron NeWeb Corporation
- JOLED Inc.
9. Analyst Recommendations
- Wheel of Fortune
- Analyst View
- Coherent Opportunity Map
10. References and Research Methodology
- References
- Research Methodology
- About us

