
PUBLISHER: Allied Market Research | PRODUCT CODE: 1645705

PUBLISHER: Allied Market Research | PRODUCT CODE: 1645705
Electronically Scanned Arrays Market By Type, By Component, By Range, By Platform, By Dimension : Global Opportunity Analysis and Industry Forecast, 2024-2033
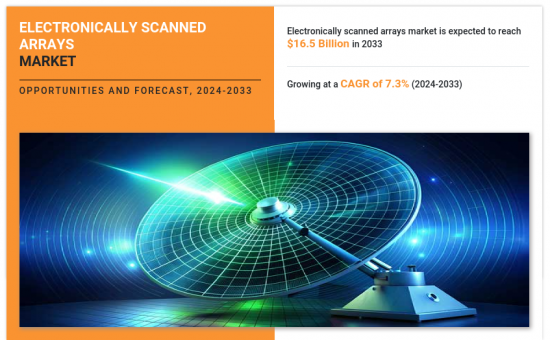
The electronically scanned arrays market was valued at $8.5 Billion in 2023 and is estimated to reach $16.5 Billion by 2033, exhibiting a CAGR of 7.28% from 2024 to 2033.
An electronically scanned array (ESA) is a type of phased array, consisting of multiple antennas that generate beams and rays of radio waves. These waves are directed toward a specific target without the need to physically move the antennas. ESA systems are commonly used in defense radar applications for scanning radar beams and detecting aircraft and missiles. The global increase in defense spending is a key factor driving the market growth, as many countries focus on modernizing and strengthening their military capabilities to address evolving security threats and geopolitical tensions. This surge in defense budgets is benefiting the electronically scanned array (ESA) market, as advanced radar systems are essential components of contemporary military infrastructure. For instance, in September 2024, the U.S. Air Force granted a contract of $16.7 million to Northrop Grumman to supply active electronically scanned array (AESA) radar systems for F-16 fighter jets, enhancing the aircraft's capabilities with advanced radar technology.
Governments are investing heavily in upgrading defense systems across various domains, including air defense, missile defense, naval warfare, and ground-based surveillance. ESAs are integral to these upgrades due to their superior performance over traditional radar systems. Their ability to deliver high-resolution imaging, track multiple targets and rapidly steer beams which play vital role in modern warfare. The growing trend of miniaturization and the deployment of small satellites in Low Earth Orbit (LEO) is driving the growth of the electronically scanned array (ESA) market. Advances in material science and electronic engineering have made it possible to develop compact, lightweight ESAs that can be integrated into small satellites and unmanned aerial vehicles (UAVs). These smaller ESAs are essential for detailed Earth observation, environmental monitoring, and real-time data collection, making them highly valuable for defense purposes. The rising number of small satellite launches and the increasing demand for high-resolution imaging and real-time communication are fueling the adoption of ESAs.
The electronically scanned array market is segmented into type, range, platform, component and region. On the basis of type, the market is bifurcated into active and passive. On the basis of range, the market is classified into short, medium and long. On the basis of platform, the market is divided into land, air, and navy. On the basis of component, the market is divided into transmit receive module, phase shifters, beamforming network, signal processing and others. On the basis of dimension, the market is divided into 2D,3D and 4D. Region wise, the electronically scanned array market is analyzed across North America (U.S., Canada, and Mexico), Europe (UK, Germany, France, Russia, Italy, and rest of Europe), Asia-Pacific (China, India, Japan, South Korea, and rest of Asia-Pacific), and LAMEA (Latin America, the Middle East, and Africa).
The key players operating in the market include electronically scanned arrays market players, such as Lockhead Martin Corporation, Israel Aerospace Industries, Thales Group, BEL, Northrop Grumman, Saab AB, Raytheon Technologies, Mitsubishi Electric, Aselsan SA, Hensoldt, Telephonics Corporation, Leonardo S.P.A. and Blighter Surveillance Systems Limited.
Key Benefits For Stakeholders
- This report provides a quantitative analysis of the market segments, current trends, estimations, and dynamics of the electronically scanned arrays market analysis from 2023 to 2033 to identify the prevailing electronically scanned arrays market opportunities.
- The market research is offered along with information related to key drivers, restraints, and opportunities.
- Porter's five forces analysis highlights the potency of buyers and suppliers to enable stakeholders make profit-oriented business decisions and strengthen their supplier-buyer network.
- In-depth analysis of the electronically scanned arrays market segmentation assists to determine the prevailing market opportunities.
- Major countries in each region are mapped according to their revenue contribution to the global market.
- Market player positioning facilitates benchmarking and provides a clear understanding of the present position of the market players.
- The report includes the analysis of the regional as well as global electronically scanned arrays market trends, key players, market segments, application areas, and market growth strategies.
Additional benefits you will get with this purchase are:
- Quarterly Update and* (only available with a corporate license, on listed price)
- 5 additional Company Profile of client Choice pre- or Post-purchase, as a free update.
- Free Upcoming Version on the Purchase of Five and Enterprise User License.
- 16 analyst hours of support* (post-purchase, if you find additional data requirements upon review of the report, you may receive support amounting to 16 analyst hours to solve questions, and post-sale queries)
- 15% Free Customization* (in case the scope or segment of the report does not match your requirements, 15% is equivalent to 3 working days of free work, applicable once)
- Free data Pack on the Five and Enterprise User License. (Excel version of the report)
- Free Updated report if the report is 6-12 months old or older.
- 24-hour priority response*
- Free Industry updates and white papers.
Possible Customization with this report (with additional cost and timeline, please talk to the sales executive to know more)
- Market share analysis of players by products/segments
- New Product Development/ Product Matrix of Key Players
- Additional company profiles with specific to client's interest
- Import Export Analysis/Data
- Product Consumption Analysis
Key Market Segments
By Component
- Transmit receive module
- Phase shifters
- Beamforming network
- Signal processing
- Others
By Range
- Short
- Medium
- Long
By Type
- Active
- Passive
By Dimension
- 2D
- 3D
- 4D
By Platform
- Land
- Naval
- Air
By Region
- North America
- U.S.
- Canada
- Mexico
- Europe
- UK
- Germany
- France
- Russia
- Rest of Europe
- Asia-Pacific
- China
- Japan
- India
- South Korea
- Rest of Asia-Pacific
- LAMEA
- Latin America
- Middle East
- Africa
Key Market Players:
- ASELSAN
- Bharat Electronics Limited (BEL)
- Blighter Surveillance Systems Limited
- HENSOLDT
- Israel Aerospace Industries
- Leonardo S.p.A.
- Lockhead Martin Corporation
- Mitsubishi Electric Corporation
- Northrop Grumman
- RTX
- Saab AB
- Telephonics Corporation
- Thales
TABLE OF CONTENTS
CHAPTER 1: INTRODUCTION
- 1.1. Report description
- 1.2. Key market segments
- 1.3. Key benefits to the stakeholders
- 1.4. Research methodology
- 1.4.1. Primary research
- 1.4.2. Secondary research
- 1.4.3. Analyst tools and models
CHAPTER 2: EXECUTIVE SUMMARY
- 2.1. CXO perspective
CHAPTER 3: MARKET OVERVIEW
- 3.1. Market definition and scope
- 3.2. Key findings
- 3.2.1. Top impacting factors
- 3.2.2. Top investment pockets
- 3.3. Porter's five forces analysis
- 3.3.1. Moderate to high bargaining power of buyers
- 3.3.2. Low to high threat of substitutes
- 3.3.3. Low to high intensity of rivalry
- 3.3.4. Low to moderate threat of new entrants
- 3.3.5. Moderate to high bargaining power of suppliers
- 3.4. Market dynamics
- 3.4.1. Drivers
- 3.4.1.1. Increase in purchase of combat aircraft to surge the demand for electronically scanned array
- 3.4.1.2. Surge in contracts and investments to strengthen the capabilities of air defense
- 3.4.2. Restraints
- 3.4.2.1. High development and deployment costs
- 3.4.2.2. Stringent regulation related to arm transfer
- 3.4.3. Opportunities
- 3.4.3.1. Growing demand for R&D activities in electronically scanned array radar
- 3.4.3.2. The rise in demand for the latest 4D dimension radar will create lucrative opportunities.
- 3.4.1. Drivers
CHAPTER 4: ELECTRONICALLY SCANNED ARRAYS MARKET, BY TYPE
- 4.1. Overview
- 4.1.1. Market size and forecast
- 4.2. Active
- 4.2.1. Key market trends, growth factors and opportunities
- 4.2.2. Market size and forecast, by region
- 4.2.3. Market share analysis by country
- 4.3. Passive
- 4.3.1. Key market trends, growth factors and opportunities
- 4.3.2. Market size and forecast, by region
- 4.3.3. Market share analysis by country
CHAPTER 5: ELECTRONICALLY SCANNED ARRAYS MARKET, BY COMPONENT
- 5.1. Overview
- 5.1.1. Market size and forecast
- 5.2. Transmit receive module
- 5.2.1. Key market trends, growth factors and opportunities
- 5.2.2. Market size and forecast, by region
- 5.2.3. Market share analysis by country
- 5.3. Phase shifters
- 5.3.1. Key market trends, growth factors and opportunities
- 5.3.2. Market size and forecast, by region
- 5.3.3. Market share analysis by country
- 5.4. Beamforming network
- 5.4.1. Key market trends, growth factors and opportunities
- 5.4.2. Market size and forecast, by region
- 5.4.3. Market share analysis by country
- 5.5. Signal processing
- 5.5.1. Key market trends, growth factors and opportunities
- 5.5.2. Market size and forecast, by region
- 5.5.3. Market share analysis by country
- 5.6. Others
- 5.6.1. Key market trends, growth factors and opportunities
- 5.6.2. Market size and forecast, by region
- 5.6.3. Market share analysis by country
CHAPTER 6: ELECTRONICALLY SCANNED ARRAYS MARKET, BY RANGE
- 6.1. Overview
- 6.1.1. Market size and forecast
- 6.2. Short
- 6.2.1. Key market trends, growth factors and opportunities
- 6.2.2. Market size and forecast, by region
- 6.2.3. Market share analysis by country
- 6.3. Medium
- 6.3.1. Key market trends, growth factors and opportunities
- 6.3.2. Market size and forecast, by region
- 6.3.3. Market share analysis by country
- 6.4. Long
- 6.4.1. Key market trends, growth factors and opportunities
- 6.4.2. Market size and forecast, by region
- 6.4.3. Market share analysis by country
CHAPTER 7: ELECTRONICALLY SCANNED ARRAYS MARKET, BY PLATFORM
- 7.1. Overview
- 7.1.1. Market size and forecast
- 7.2. Land
- 7.2.1. Key market trends, growth factors and opportunities
- 7.2.2. Market size and forecast, by region
- 7.2.3. Market share analysis by country
- 7.3. Naval
- 7.3.1. Key market trends, growth factors and opportunities
- 7.3.2. Market size and forecast, by region
- 7.3.3. Market share analysis by country
- 7.4. Air
- 7.4.1. Key market trends, growth factors and opportunities
- 7.4.2. Market size and forecast, by region
- 7.4.3. Market share analysis by country
CHAPTER 8: ELECTRONICALLY SCANNED ARRAYS MARKET, BY DIMENSION
- 8.1. Overview
- 8.1.1. Market size and forecast
- 8.2. 2D
- 8.2.1. Key market trends, growth factors and opportunities
- 8.2.2. Market size and forecast, by region
- 8.2.3. Market share analysis by country
- 8.3. 3D
- 8.3.1. Key market trends, growth factors and opportunities
- 8.3.2. Market size and forecast, by region
- 8.3.3. Market share analysis by country
- 8.4. 4D
- 8.4.1. Key market trends, growth factors and opportunities
- 8.4.2. Market size and forecast, by region
- 8.4.3. Market share analysis by country
CHAPTER 9: ELECTRONICALLY SCANNED ARRAYS MARKET, BY REGION
- 9.1. Overview
- 9.1.1. Market size and forecast By Region
- 9.2. North America
- 9.2.1. Key market trends, growth factors and opportunities
- 9.2.2. Market size and forecast, by Type
- 9.2.3. Market size and forecast, by Component
- 9.2.4. Market size and forecast, by Range
- 9.2.5. Market size and forecast, by Platform
- 9.2.6. Market size and forecast, by Dimension
- 9.2.7. Market size and forecast, by country
- 9.2.7.1. U.S.
- 9.2.7.1.1. Market size and forecast, by Type
- 9.2.7.1.2. Market size and forecast, by Component
- 9.2.7.1.3. Market size and forecast, by Range
- 9.2.7.1.4. Market size and forecast, by Platform
- 9.2.7.1.5. Market size and forecast, by Dimension
- 9.2.7.2. Canada
- 9.2.7.2.1. Market size and forecast, by Type
- 9.2.7.2.2. Market size and forecast, by Component
- 9.2.7.2.3. Market size and forecast, by Range
- 9.2.7.2.4. Market size and forecast, by Platform
- 9.2.7.2.5. Market size and forecast, by Dimension
- 9.2.7.3. Mexico
- 9.2.7.3.1. Market size and forecast, by Type
- 9.2.7.3.2. Market size and forecast, by Component
- 9.2.7.3.3. Market size and forecast, by Range
- 9.2.7.3.4. Market size and forecast, by Platform
- 9.2.7.3.5. Market size and forecast, by Dimension
- 9.3. Europe
- 9.3.1. Key market trends, growth factors and opportunities
- 9.3.2. Market size and forecast, by Type
- 9.3.3. Market size and forecast, by Component
- 9.3.4. Market size and forecast, by Range
- 9.3.5. Market size and forecast, by Platform
- 9.3.6. Market size and forecast, by Dimension
- 9.3.7. Market size and forecast, by country
- 9.3.7.1. UK
- 9.3.7.1.1. Market size and forecast, by Type
- 9.3.7.1.2. Market size and forecast, by Component
- 9.3.7.1.3. Market size and forecast, by Range
- 9.3.7.1.4. Market size and forecast, by Platform
- 9.3.7.1.5. Market size and forecast, by Dimension
- 9.3.7.2. Germany
- 9.3.7.2.1. Market size and forecast, by Type
- 9.3.7.2.2. Market size and forecast, by Component
- 9.3.7.2.3. Market size and forecast, by Range
- 9.3.7.2.4. Market size and forecast, by Platform
- 9.3.7.2.5. Market size and forecast, by Dimension
- 9.3.7.3. France
- 9.3.7.3.1. Market size and forecast, by Type
- 9.3.7.3.2. Market size and forecast, by Component
- 9.3.7.3.3. Market size and forecast, by Range
- 9.3.7.3.4. Market size and forecast, by Platform
- 9.3.7.3.5. Market size and forecast, by Dimension
- 9.3.7.4. Russia
- 9.3.7.4.1. Market size and forecast, by Type
- 9.3.7.4.2. Market size and forecast, by Component
- 9.3.7.4.3. Market size and forecast, by Range
- 9.3.7.4.4. Market size and forecast, by Platform
- 9.3.7.4.5. Market size and forecast, by Dimension
- 9.3.7.5. Rest of Europe
- 9.3.7.5.1. Market size and forecast, by Type
- 9.3.7.5.2. Market size and forecast, by Component
- 9.3.7.5.3. Market size and forecast, by Range
- 9.3.7.5.4. Market size and forecast, by Platform
- 9.3.7.5.5. Market size and forecast, by Dimension
- 9.4. Asia-Pacific
- 9.4.1. Key market trends, growth factors and opportunities
- 9.4.2. Market size and forecast, by Type
- 9.4.3. Market size and forecast, by Component
- 9.4.4. Market size and forecast, by Range
- 9.4.5. Market size and forecast, by Platform
- 9.4.6. Market size and forecast, by Dimension
- 9.4.7. Market size and forecast, by country
- 9.4.7.1. China
- 9.4.7.1.1. Market size and forecast, by Type
- 9.4.7.1.2. Market size and forecast, by Component
- 9.4.7.1.3. Market size and forecast, by Range
- 9.4.7.1.4. Market size and forecast, by Platform
- 9.4.7.1.5. Market size and forecast, by Dimension
- 9.4.7.2. Japan
- 9.4.7.2.1. Market size and forecast, by Type
- 9.4.7.2.2. Market size and forecast, by Component
- 9.4.7.2.3. Market size and forecast, by Range
- 9.4.7.2.4. Market size and forecast, by Platform
- 9.4.7.2.5. Market size and forecast, by Dimension
- 9.4.7.3. India
- 9.4.7.3.1. Market size and forecast, by Type
- 9.4.7.3.2. Market size and forecast, by Component
- 9.4.7.3.3. Market size and forecast, by Range
- 9.4.7.3.4. Market size and forecast, by Platform
- 9.4.7.3.5. Market size and forecast, by Dimension
- 9.4.7.4. South Korea
- 9.4.7.4.1. Market size and forecast, by Type
- 9.4.7.4.2. Market size and forecast, by Component
- 9.4.7.4.3. Market size and forecast, by Range
- 9.4.7.4.4. Market size and forecast, by Platform
- 9.4.7.4.5. Market size and forecast, by Dimension
- 9.4.7.5. Rest of Asia-Pacific
- 9.4.7.5.1. Market size and forecast, by Type
- 9.4.7.5.2. Market size and forecast, by Component
- 9.4.7.5.3. Market size and forecast, by Range
- 9.4.7.5.4. Market size and forecast, by Platform
- 9.4.7.5.5. Market size and forecast, by Dimension
- 9.5. LAMEA
- 9.5.1. Key market trends, growth factors and opportunities
- 9.5.2. Market size and forecast, by Type
- 9.5.3. Market size and forecast, by Component
- 9.5.4. Market size and forecast, by Range
- 9.5.5. Market size and forecast, by Platform
- 9.5.6. Market size and forecast, by Dimension
- 9.5.7. Market size and forecast, by country
- 9.5.7.1. Latin America
- 9.5.7.1.1. Market size and forecast, by Type
- 9.5.7.1.2. Market size and forecast, by Component
- 9.5.7.1.3. Market size and forecast, by Range
- 9.5.7.1.4. Market size and forecast, by Platform
- 9.5.7.1.5. Market size and forecast, by Dimension
- 9.5.7.2. Middle East
- 9.5.7.2.1. Market size and forecast, by Type
- 9.5.7.2.2. Market size and forecast, by Component
- 9.5.7.2.3. Market size and forecast, by Range
- 9.5.7.2.4. Market size and forecast, by Platform
- 9.5.7.2.5. Market size and forecast, by Dimension
- 9.5.7.3. Africa
- 9.5.7.3.1. Market size and forecast, by Type
- 9.5.7.3.2. Market size and forecast, by Component
- 9.5.7.3.3. Market size and forecast, by Range
- 9.5.7.3.4. Market size and forecast, by Platform
- 9.5.7.3.5. Market size and forecast, by Dimension
CHAPTER 10: COMPETITIVE LANDSCAPE
- 10.1. Introduction
- 10.2. Top winning strategies
- 10.3. Product mapping of top 10 player
- 10.4. Competitive dashboard
- 10.5. Competitive heatmap
- 10.6. Top player positioning, 2023
CHAPTER 11: COMPANY PROFILES
- 11.1. Israel Aerospace Industries
- 11.1.1. Company overview
- 11.1.2. Key executives
- 11.1.3. Company snapshot
- 11.1.4. Operating business segments
- 11.1.5. Product portfolio
- 11.1.6. Business performance
- 11.1.7. Key strategic moves and developments
- 11.2. Thales
- 11.2.1. Company overview
- 11.2.2. Key executives
- 11.2.3. Company snapshot
- 11.2.4. Operating business segments
- 11.2.5. Product portfolio
- 11.2.6. Business performance
- 11.2.7. Key strategic moves and developments
- 11.3. Bharat Electronics Limited (BEL)
- 11.3.1. Company overview
- 11.3.2. Key executives
- 11.3.3. Company snapshot
- 11.3.4. Operating business segments
- 11.3.5. Product portfolio
- 11.3.6. Business performance
- 11.3.7. Key strategic moves and developments
- 11.4. Northrop Grumman
- 11.4.1. Company overview
- 11.4.2. Key executives
- 11.4.3. Company snapshot
- 11.4.4. Operating business segments
- 11.4.5. Product portfolio
- 11.4.6. Business performance
- 11.4.7. Key strategic moves and developments
- 11.5. Saab AB
- 11.5.1. Company overview
- 11.5.2. Key executives
- 11.5.3. Company snapshot
- 11.5.4. Operating business segments
- 11.5.5. Product portfolio
- 11.5.6. Business performance
- 11.5.7. Key strategic moves and developments
- 11.6. RTX
- 11.6.1. Company overview
- 11.6.2. Key executives
- 11.6.3. Company snapshot
- 11.6.4. Operating business segments
- 11.6.5. Product portfolio
- 11.6.6. Business performance
- 11.6.7. Key strategic moves and developments
- 11.7. Mitsubishi Electric Corporation
- 11.7.1. Company overview
- 11.7.2. Key executives
- 11.7.3. Company snapshot
- 11.7.4. Operating business segments
- 11.7.5. Product portfolio
- 11.7.6. Business performance
- 11.7.7. Key strategic moves and developments
- 11.8. ASELSAN
- 11.8.1. Company overview
- 11.8.2. Key executives
- 11.8.3. Company snapshot
- 11.8.4. Operating business segments
- 11.8.5. Product portfolio
- 11.8.6. Business performance
- 11.9. HENSOLDT
- 11.9.1. Company overview
- 11.9.2. Key executives
- 11.9.3. Company snapshot
- 11.9.4. Operating business segments
- 11.9.5. Product portfolio
- 11.9.6. Business performance
- 11.9.7. Key strategic moves and developments
- 11.10. Telephonics Corporation
- 11.10.1. Company overview
- 11.10.2. Key executives
- 11.10.3. Company snapshot
- 11.10.4. Operating business segments
- 11.10.5. Product portfolio
- 11.10.6. Business performance
- 11.10.7. Key strategic moves and developments
- 11.11. Lockhead Martin Corporation
- 11.11.1. Company overview
- 11.11.2. Key executives
- 11.11.3. Company snapshot
- 11.11.4. Operating business segments
- 11.11.5. Product portfolio
- 11.11.6. Business performance
- 11.11.7. Key strategic moves and developments
- 11.12. Blighter Surveillance Systems Limited
- 11.12.1. Company overview
- 11.12.2. Key executives
- 11.12.3. Company snapshot
- 11.12.4. Operating business segments
- 11.12.5. Product portfolio
- 11.13. Leonardo S.p.A.
- 11.13.1. Company overview
- 11.13.2. Key executives
- 11.13.3. Company snapshot
- 11.13.4. Operating business segments
- 11.13.5. Product portfolio
- 11.13.6. Business performance
- 11.13.7. Key strategic moves and developments

