
PUBLISHER: Allied Market Research | PRODUCT CODE: 1645700

PUBLISHER: Allied Market Research | PRODUCT CODE: 1645700
North America Vaccines Market By Technology Type , By Indication By End User : Opportunity Analysis and Industry Forecast, 2024-2033
North America Vaccines Market
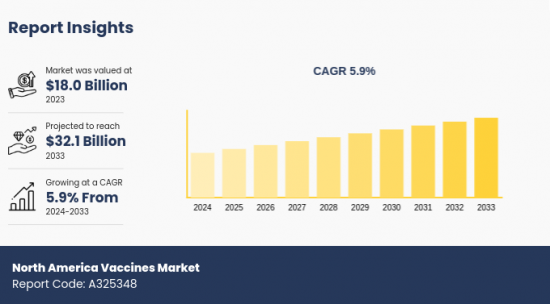
The North America vaccines market was valued at $18.0 billion in 2023 and is projected to reach $32.1 billion by 2033, growing at a CAGR of 5.9% from 2024 to 2033.
A vaccine is a biological preparation comprising killed, weakened, or fragmented disease-causing microbes administered into human body to protect against specific disease. Another category of vaccines consists of mRNA, antibodies, or lymphocytes for the prevention of diseases. Vaccines either provide active immunity by stimulating the antibody-producing B cells or they activate passive immunity of individuals via antibodies & lymphocytes.
The establishment of several laws and plans pertaining to vaccination, such as the National Vaccine Plan, is a key driver of the North America vaccines market. Furthermore, the well-developed health infrastructure of North America, including efficient cold-chain storage solutions and trained healthcare workers enhances the accessibility of vaccines and propels the market development. Currently, the development of compound vaccines is trending in North America. Scientists are striving to form vaccines consisting of different antigens from bacteria, viruses, and other microorganisms, which results in the generation of one formulation that offers protection against multiple diseases.
However, the extensive development and approval process established by the U.S. Food and Drug Administration results in delayed availability of vaccines, which hampers the development of the market. Moreover, rise in hesitancy among individuals regarding the efficacy of vaccines, particularly among parents has resulted in declined vaccination rates and restrained market growth. For instance, according to the Center for American Progress-a policy research and advocacy organization-the percentage of parents considering vaccines important for their children fell from 94% in 2001 to 69% in 2024. Contrarily, ongoing research studies and experiments for the development of personalized vaccines that prevent the recurrence of lethal forms of cancers such as lung, breast, and bladder cancers are poised to open new avenues for the North America vaccines market.
Segment Review
The North America vaccines market is segmented into technology type, indication, end user, and region. On the basis of technology type, it is divided into inactivated vaccines, toxoid vaccines, recombinant & conjugate vaccines, live attenuated vaccines, and others. As per indication, it is classified into pneumococcal disease; influenza; human papilloma virus; meningococcal disease; rotavirus; varicella; measles, mumps, & rubella; diphtheria, pertussis, & tetanus (DTP); polio; hepatitis; and other indications. According to end user, it is categorized into pediatric, adults, and travelers. Country wise, it is analyzed across U.S., Canada, and Mexico.
Key Findings
On the basis of technology type, the recombinant & conjugate vaccines segment was the highest shareholder in 2023.
Depending on indication, the human papilloma virus segment held a notable share of the market in 2023.
As per end user, the pediatric segment dominated the market in 2023.
Competition Analysis
The leading players in the global North America vaccines market include Bavarian Nordic A/S, Merck & Co., Inc., Sanofi, Pfizer, Emergent Biosolutions, CSL, Moderna, Inc., Dynavax Technologies, Novavax, and GSK plc. These major players have adopted various key development strategies such as business expansion, new product launches, and partnerships to strengthen their foothold in the competitive market.
Additional benefits you will get with this purchase are:
- Quarterly Update and* (only available with a corporate license, on listed price)
- 5 additional Company Profile of client Choice pre- or Post-purchase, as a free update.
- Free Upcoming Version on the Purchase of Five and Enterprise User License.
- 16 analyst hours of support* (post-purchase, if you find additional data requirements upon review of the report, you may receive support amounting to 16 analyst hours to solve questions, and post-sale queries)
- 15% Free Customization* (in case the scope or segment of the report does not match your requirements, 15% is equivalent to 3 working days of free work, applicable once)
- Free data Pack on the Five and Enterprise User License. (Excel version of the report)
- Free Updated report if the report is 6-12 months old or older.
- 24-hour priority response*
- Free Industry updates and white papers.
Possible Customization with this report (with additional cost and timeline, please talk to the sales executive to know more)
- Regulatory Guidelines
- Additional company profiles with specific to client's interest
- Additional country or region analysis- market size and forecast
- Expanded list for Company Profiles
- Historic market data
- Key player details (including location, contact details, supplier/vendor network etc. in excel format)
Key Market Segments
By Technology Type
- Inactivated Vaccines
- Toxoid Vaccines
- Recombinant and Conjugate Vaccines
- Live Attenuated Vaccines
- Others
By Indication
- Pneumococcal Disease
- Influenza
- Human Papilloma Virus
- Meningococcal Disease
- Rotavirus
- Varicella
- Measles, Mumps, and Rubella
- Diphtheria, Pertussis, and Tetanus (DTP)
- Polio
- Hepatitis
- Other Indications
By End User
- Pediatric
- Adults
- Travelers
By Country
- U.S.
- Canada
- Mexico
Key Market Players:
- Bavarian Nordic A/S
- Merck & Co., Inc.
- Sanofi
- Pfizer
- Emergent Biosolutions
- CSL
- Moderna, Inc.
- Dynavax Technologies
- Novavax
- GSK plc.
TABLE OF CONTENTS
CHAPTER 1: INTRODUCTION
- 1.1. Report Description
- 1.2. Key Market Segments
- 1.3. Key Benefits
- 1.4. Research Methodology
- 1.4.1. Primary Research
- 1.4.2. Secondary Research
- 1.4.3. Analyst Tools and Models
CHAPTER 2: EXECUTIVE SUMMARY
- 2.1. CXO Perspective
CHAPTER 3: MARKET LANDSCAPE
- 3.1. Market Definition and Scope
- 3.2. Key Findings
- 3.2.1. Top Investment Pockets
- 3.2.2. Top Winning Strategies
- 3.3. Porter's Five Forces Analysis
- 3.3.1. Bargaining Power of Suppliers
- 3.3.2. Threat of New Entrants
- 3.3.3. Threat of Substitutes
- 3.3.4. Competitive Rivalry
- 3.3.5. Bargaining Power among Buyers
- 3.4. Market Dynamics
- 3.4.1. Drivers
- 3.4.2. Restraints
- 3.4.3. Opportunities
CHAPTER 4: NORTH AMERICA VACCINES MARKET, BY TECHNOLOGY TYPE
- 4.1. Market Overview
- 4.1.1 Market Size and Forecast, By Technology Type
- 4.2. Inactivated Vaccines
- 4.2.1. Key Market Trends, Growth Factors and Opportunities
- 4.2.2. Market Share Analysis, By Country
- 4.3. Toxoid Vaccines
- 4.3.1. Key Market Trends, Growth Factors and Opportunities
- 4.3.2. Market Share Analysis, By Country
- 4.4. Recombinant And Conjugate Vaccines
- 4.4.1. Key Market Trends, Growth Factors and Opportunities
- 4.4.2. Market Share Analysis, By Country
- 4.5. Live Attenuated Vaccines
- 4.5.1. Key Market Trends, Growth Factors and Opportunities
- 4.5.2. Market Share Analysis, By Country
- 4.6. Others
- 4.6.1. Key Market Trends, Growth Factors and Opportunities
- 4.6.2. Market Share Analysis, By Country
CHAPTER 5: NORTH AMERICA VACCINES MARKET, BY INDICATION
- 5.1. Market Overview
- 5.1.1 Market Size and Forecast, By Indication
- 5.2. Pneumococcal Disease
- 5.2.1. Key Market Trends, Growth Factors and Opportunities
- 5.2.2. Market Share Analysis, By Country
- 5.3. Influenza
- 5.3.1. Key Market Trends, Growth Factors and Opportunities
- 5.3.2. Market Share Analysis, By Country
- 5.4. Human Papilloma Virus
- 5.4.1. Key Market Trends, Growth Factors and Opportunities
- 5.4.2. Market Share Analysis, By Country
- 5.5. Meningococcal Disease
- 5.5.1. Key Market Trends, Growth Factors and Opportunities
- 5.5.2. Market Share Analysis, By Country
- 5.6. Rotavirus
- 5.6.1. Key Market Trends, Growth Factors and Opportunities
- 5.6.2. Market Share Analysis, By Country
- 5.7. Varicella
- 5.7.1. Key Market Trends, Growth Factors and Opportunities
- 5.7.2. Market Share Analysis, By Country
- 5.8. Measles, Mumps, And Rubella
- 5.8.1. Key Market Trends, Growth Factors and Opportunities
- 5.8.2. Market Share Analysis, By Country
- 5.9. Diphtheria, Pertussis, And Tetanus (DTP)
- 5.9.1. Key Market Trends, Growth Factors and Opportunities
- 5.9.2. Market Share Analysis, By Country
- 5.10. Polio
- 5.10.1. Key Market Trends, Growth Factors and Opportunities
- 5.10.2. Market Share Analysis, By Country
- 5.11. Hepatitis
- 5.11.1. Key Market Trends, Growth Factors and Opportunities
- 5.11.2. Market Share Analysis, By Country
- 5.12. Other Indications
- 5.12.1. Key Market Trends, Growth Factors and Opportunities
- 5.12.2. Market Share Analysis, By Country
CHAPTER 6: NORTH AMERICA VACCINES MARKET, BY END USER
- 6.1. Market Overview
- 6.1.1 Market Size and Forecast, By End User
- 6.2. Pediatric
- 6.2.1. Key Market Trends, Growth Factors and Opportunities
- 6.2.2. Market Share Analysis, By Country
- 6.3. Adults
- 6.3.1. Key Market Trends, Growth Factors and Opportunities
- 6.3.2. Market Share Analysis, By Country
- 6.4. Travelers
- 6.4.1. Key Market Trends, Growth Factors and Opportunities
- 6.4.2. Market Share Analysis, By Country
CHAPTER 7: NORTH AMERICA VACCINES MARKET, BY COUNTRY
- 7.1. Market Overview
- 7.1.1 Market Size and Forecast, By Country
- 7.2. North America
- 7.2.2. Key Market Trends and Opportunities
- 7.2.2. Market Size and Forecast, By Technology Type
- 7.2.3. Market Size and Forecast, By Indication
- 7.2.4. Market Size and Forecast, By End User
- 7.2.5. Market Size and Forecast, By Country
- 7.2.6.U.S.
- 7.2.6.1. Market Size and Forecast, By Technology Type
- 7.2.6.2. Market Size and Forecast, By Indication
- 7.2.6.3. Market Size and Forecast, By End User
- 7.2.7.Canada
- 7.2.7.1. Market Size and Forecast, By Technology Type
- 7.2.7.2. Market Size and Forecast, By Indication
- 7.2.7.3. Market Size and Forecast, By End User
- 7.2.8.Mexico
- 7.2.8.1. Market Size and Forecast, By Technology Type
- 7.2.8.2. Market Size and Forecast, By Indication
- 7.2.8.3. Market Size and Forecast, By End User
CHAPTER 8: COMPETITIVE LANDSCAPE
- 8.1. Introduction
- 8.2. Top Winning Strategies
- 8.3. Product Mapping Of Top 10 Player
- 8.4. Competitive Dashboard
- 8.5. Competitive Heatmap
- 8.6. Top Player Positioning,2023
CHAPTER 9: COMPANY PROFILES
- 9.1. Bavarian Nordic A/S
- 9.1.1. Company Overview
- 9.1.2. Key Executives
- 9.1.3. Company Snapshot
- 9.1.4. Operating Business Segments
- 9.1.5. Product Portfolio
- 9.1.6. Business Performance
- 9.1.7. Key Strategic Moves and Developments
- 9.2. Merck And Co., Inc.
- 9.2.1. Company Overview
- 9.2.2. Key Executives
- 9.2.3. Company Snapshot
- 9.2.4. Operating Business Segments
- 9.2.5. Product Portfolio
- 9.2.6. Business Performance
- 9.2.7. Key Strategic Moves and Developments
- 9.3. Sanofi
- 9.3.1. Company Overview
- 9.3.2. Key Executives
- 9.3.3. Company Snapshot
- 9.3.4. Operating Business Segments
- 9.3.5. Product Portfolio
- 9.3.6. Business Performance
- 9.3.7. Key Strategic Moves and Developments
- 9.4. Pfizer
- 9.4.1. Company Overview
- 9.4.2. Key Executives
- 9.4.3. Company Snapshot
- 9.4.4. Operating Business Segments
- 9.4.5. Product Portfolio
- 9.4.6. Business Performance
- 9.4.7. Key Strategic Moves and Developments
- 9.5. Emergent Biosolutions
- 9.5.1. Company Overview
- 9.5.2. Key Executives
- 9.5.3. Company Snapshot
- 9.5.4. Operating Business Segments
- 9.5.5. Product Portfolio
- 9.5.6. Business Performance
- 9.5.7. Key Strategic Moves and Developments
- 9.6. CSL
- 9.6.1. Company Overview
- 9.6.2. Key Executives
- 9.6.3. Company Snapshot
- 9.6.4. Operating Business Segments
- 9.6.5. Product Portfolio
- 9.6.6. Business Performance
- 9.6.7. Key Strategic Moves and Developments
- 9.7. Moderna, Inc.
- 9.7.1. Company Overview
- 9.7.2. Key Executives
- 9.7.3. Company Snapshot
- 9.7.4. Operating Business Segments
- 9.7.5. Product Portfolio
- 9.7.6. Business Performance
- 9.7.7. Key Strategic Moves and Developments
- 9.8. Dynavax Technologies
- 9.8.1. Company Overview
- 9.8.2. Key Executives
- 9.8.3. Company Snapshot
- 9.8.4. Operating Business Segments
- 9.8.5. Product Portfolio
- 9.8.6. Business Performance
- 9.8.7. Key Strategic Moves and Developments
- 9.9. Novavax
- 9.9.1. Company Overview
- 9.9.2. Key Executives
- 9.9.3. Company Snapshot
- 9.9.4. Operating Business Segments
- 9.9.5. Product Portfolio
- 9.9.6. Business Performance
- 9.9.7. Key Strategic Moves and Developments
- 9.10. GSK Plc.
- 9.10.1. Company Overview
- 9.10.2. Key Executives
- 9.10.3. Company Snapshot
- 9.10.4. Operating Business Segments
- 9.10.5. Product Portfolio
- 9.10.6. Business Performance
- 9.10.7. Key Strategic Moves and Developments
- TABLE 1. NORTH AMERICA VACCINES MARKET, BY TECHNOLOGY TYPE, 2024 - 2033 ($BILLION)
- TABLE 2. NORTH AMERICA VACCINES MARKET FOR INACTIVATED VACCINES, BY COUNTRY, 2024 - 2033 ($BILLION)
- TABLE 3. NORTH AMERICA VACCINES MARKET FOR TOXOID VACCINES, BY COUNTRY, 2024 - 2033 ($BILLION)
- TABLE 4. NORTH AMERICA VACCINES MARKET FOR RECOMBINANT AND CONJUGATE VACCINES, BY COUNTRY, 2024 - 2033 ($BILLION)
- TABLE 5. NORTH AMERICA VACCINES MARKET FOR LIVE ATTENUATED VACCINES, BY COUNTRY, 2024 - 2033 ($BILLION)
- TABLE 6. NORTH AMERICA VACCINES MARKET FOR OTHERS, BY COUNTRY, 2024 - 2033 ($BILLION)
- TABLE 7. NORTH AMERICA VACCINES MARKET, BY INDICATION, 2024 - 2033 ($BILLION)
- TABLE 8. NORTH AMERICA VACCINES MARKET FOR PNEUMOCOCCAL DISEASE, BY COUNTRY, 2024 - 2033 ($BILLION)
- TABLE 9. NORTH AMERICA VACCINES MARKET FOR INFLUENZA, BY COUNTRY, 2024 - 2033 ($BILLION)
- TABLE 10. NORTH AMERICA VACCINES MARKET FOR HUMAN PAPILLOMA VIRUS, BY COUNTRY, 2024 - 2033 ($BILLION)
- TABLE 11. NORTH AMERICA VACCINES MARKET FOR MENINGOCOCCAL DISEASE, BY COUNTRY, 2024 - 2033 ($BILLION)
- TABLE 12. NORTH AMERICA VACCINES MARKET FOR ROTAVIRUS, BY COUNTRY, 2024 - 2033 ($BILLION)
- TABLE 13. NORTH AMERICA VACCINES MARKET FOR VARICELLA, BY COUNTRY, 2024 - 2033 ($BILLION)
- TABLE 14. NORTH AMERICA VACCINES MARKET FOR MEASLES, MUMPS, AND RUBELLA, BY COUNTRY, 2024 - 2033 ($BILLION)
- TABLE 15. NORTH AMERICA VACCINES MARKET FOR DIPHTHERIA, PERTUSSIS, AND TETANUS (DTP), BY COUNTRY, 2024 - 2033 ($BILLION)
- TABLE 16. NORTH AMERICA VACCINES MARKET FOR POLIO, BY COUNTRY, 2024 - 2033 ($BILLION)
- TABLE 17. NORTH AMERICA VACCINES MARKET FOR HEPATITIS, BY COUNTRY, 2024 - 2033 ($BILLION)
- TABLE 18. NORTH AMERICA VACCINES MARKET FOR OTHER INDICATIONS, BY COUNTRY, 2024 - 2033 ($BILLION)
- TABLE 19. NORTH AMERICA VACCINES MARKET, BY END USER, 2024 - 2033 ($BILLION)
- TABLE 20. NORTH AMERICA VACCINES MARKET FOR PEDIATRIC, BY COUNTRY, 2024 - 2033 ($BILLION)
- TABLE 21. NORTH AMERICA VACCINES MARKET FOR ADULTS, BY COUNTRY, 2024 - 2033 ($BILLION)
- TABLE 22. NORTH AMERICA VACCINES MARKET FOR TRAVELERS, BY COUNTRY, 2024 - 2033 ($BILLION)
- TABLE 23. NORTH AMERICA VACCINES MARKET, BY COUNTRY, 2024 - 2033 ($BILLION)
- TABLE 24. NORTH AMERICA VACCINES MARKET, BY TECHNOLOGY TYPE, 2024 - 2033 ($BILLION)
- TABLE 25. NORTH AMERICA VACCINES MARKET, BY INDICATION, 2024 - 2033 ($BILLION)
- TABLE 26. NORTH AMERICA VACCINES MARKET, BY END USER, 2024 - 2033 ($BILLION)
- TABLE 27. U.S. VACCINES MARKET, BY TECHNOLOGY TYPE, 2024 - 2033 ($BILLION)
- TABLE 28. U.S. VACCINES MARKET, BY INDICATION, 2024 - 2033 ($BILLION)
- TABLE 29. U.S. VACCINES MARKET, BY END USER, 2024 - 2033 ($BILLION)
- TABLE 30. CANADA VACCINES MARKET, BY TECHNOLOGY TYPE, 2024 - 2033 ($BILLION)
- TABLE 31. CANADA VACCINES MARKET, BY INDICATION, 2024 - 2033 ($BILLION)
- TABLE 32. CANADA VACCINES MARKET, BY END USER, 2024 - 2033 ($BILLION)
- TABLE 33. MEXICO VACCINES MARKET, BY TECHNOLOGY TYPE, 2024 - 2033 ($BILLION)
- TABLE 34. MEXICO VACCINES MARKET, BY INDICATION, 2024 - 2033 ($BILLION)
- TABLE 35. MEXICO VACCINES MARKET, BY END USER, 2024 - 2033 ($BILLION)
- TABLE 36. BAVARIAN NORDIC A/S: KEY EXECUTIVES
- TABLE 37. BAVARIAN NORDIC A/S: COMPANY SNAPSHOT
- TABLE 38. BAVARIAN NORDIC A/S: OPERATING SEGMENTS
- TABLE 39. BAVARIAN NORDIC A/S: PRODUCT PORTFOLIO
- TABLE 40. BAVARIAN NORDIC A/S: KEY STRATEGIC MOVES AND DEVELOPMENTS
- TABLE 41. MERCK AND CO., INC.: KEY EXECUTIVES
- TABLE 42. MERCK AND CO., INC.: COMPANY SNAPSHOT
- TABLE 43. MERCK AND CO., INC.: OPERATING SEGMENTS
- TABLE 44. MERCK AND CO., INC.: PRODUCT PORTFOLIO
- TABLE 45. MERCK AND CO., INC.: KEY STRATEGIC MOVES AND DEVELOPMENTS
- TABLE 46. SANOFI: KEY EXECUTIVES
- TABLE 47. SANOFI: COMPANY SNAPSHOT
- TABLE 48. SANOFI: OPERATING SEGMENTS
- TABLE 49. SANOFI: PRODUCT PORTFOLIO
- TABLE 50. SANOFI: KEY STRATEGIC MOVES AND DEVELOPMENTS
- TABLE 51. PFIZER: KEY EXECUTIVES
- TABLE 52. PFIZER: COMPANY SNAPSHOT
- TABLE 53. PFIZER: OPERATING SEGMENTS
- TABLE 54. PFIZER: PRODUCT PORTFOLIO
- TABLE 55. PFIZER: KEY STRATEGIC MOVES AND DEVELOPMENTS
- TABLE 56. EMERGENT BIOSOLUTIONS: KEY EXECUTIVES
- TABLE 57. EMERGENT BIOSOLUTIONS: COMPANY SNAPSHOT
- TABLE 58. EMERGENT BIOSOLUTIONS: OPERATING SEGMENTS
- TABLE 59. EMERGENT BIOSOLUTIONS: PRODUCT PORTFOLIO
- TABLE 60. EMERGENT BIOSOLUTIONS: KEY STRATEGIC MOVES AND DEVELOPMENTS
- TABLE 61. CSL: KEY EXECUTIVES
- TABLE 62. CSL: COMPANY SNAPSHOT
- TABLE 63. CSL: OPERATING SEGMENTS
- TABLE 64. CSL: PRODUCT PORTFOLIO
- TABLE 65. CSL: KEY STRATEGIC MOVES AND DEVELOPMENTS
- TABLE 66. MODERNA, INC.: KEY EXECUTIVES
- TABLE 67. MODERNA, INC.: COMPANY SNAPSHOT
- TABLE 68. MODERNA, INC.: OPERATING SEGMENTS
- TABLE 69. MODERNA, INC.: PRODUCT PORTFOLIO
- TABLE 70. MODERNA, INC.: KEY STRATEGIC MOVES AND DEVELOPMENTS
- TABLE 71. DYNAVAX TECHNOLOGIES: KEY EXECUTIVES
- TABLE 72. DYNAVAX TECHNOLOGIES: COMPANY SNAPSHOT
- TABLE 73. DYNAVAX TECHNOLOGIES: OPERATING SEGMENTS
- TABLE 74. DYNAVAX TECHNOLOGIES: PRODUCT PORTFOLIO
- TABLE 75. DYNAVAX TECHNOLOGIES: KEY STRATEGIC MOVES AND DEVELOPMENTS
- TABLE 76. NOVAVAX: KEY EXECUTIVES
- TABLE 77. NOVAVAX: COMPANY SNAPSHOT
- TABLE 78. NOVAVAX: OPERATING SEGMENTS
- TABLE 79. NOVAVAX: PRODUCT PORTFOLIO
- TABLE 80. NOVAVAX: KEY STRATEGIC MOVES AND DEVELOPMENTS
- TABLE 81. GSK PLC.: KEY EXECUTIVES
- TABLE 82. GSK PLC.: COMPANY SNAPSHOT
- TABLE 83. GSK PLC.: OPERATING SEGMENTS
- TABLE 84. GSK PLC.: PRODUCT PORTFOLIO
- TABLE 85. GSK PLC.: KEY STRATEGIC MOVES AND DEVELOPMENTS
- FIGURE 1. NORTH AMERICA VACCINES MARKET,2024 - 2033
- FIGURE 2. SEGMENTATION OF NORTH AMERICA VACCINES MARKET,2024 - 2033
- FIGURE 3. TOP INVESTMENT POCKET IN NORTH AMERICA VACCINES MARKET,2024 - 2033
- FIGURE 4. MODERATE BARGAINING POWER OF BUYERS
- FIGURE 5. MODERATE BARGAINING POWER OF SUPPLIERS
- FIGURE 6. MODERATE THREAT OF NEW ENTRANTS
- FIGURE 7. LOW THREAT OF SUBSTITUTION
- FIGURE 8. HIGH COMPETITIVE RIVALRY
- FIGURE 9. OPPORTUNITIES, RESTRAINTS AND DRIVERS: NORTH AMERICA VACCINES MARKET
- FIGURE 10. NORTH AMERICA VACCINES MARKET , BY TECHNOLOGY TYPE,2024 - 2033 ($BILLION)
- FIGURE 11. NORTH AMERICA VACCINES MARKET FOR INACTIVATED VACCINES, BY COUNTRY, 2024 - 2033 ($BILLION)
- FIGURE 12. NORTH AMERICA VACCINES MARKET FOR TOXOID VACCINES, BY COUNTRY, 2024 - 2033 ($BILLION)
- FIGURE 13. NORTH AMERICA VACCINES MARKET FOR RECOMBINANT AND CONJUGATE VACCINES, BY COUNTRY, 2024 - 2033 ($BILLION)
- FIGURE 14. NORTH AMERICA VACCINES MARKET FOR LIVE ATTENUATED VACCINES, BY COUNTRY, 2024 - 2033 ($BILLION)
- FIGURE 15. NORTH AMERICA VACCINES MARKET FOR OTHERS, BY COUNTRY, 2024 - 2033 ($BILLION)
- FIGURE 16. NORTH AMERICA VACCINES MARKET , BY INDICATION,2024 - 2033 ($BILLION)
- FIGURE 17. NORTH AMERICA VACCINES MARKET FOR PNEUMOCOCCAL DISEASE, BY COUNTRY, 2024 - 2033 ($BILLION)
- FIGURE 18. NORTH AMERICA VACCINES MARKET FOR INFLUENZA, BY COUNTRY, 2024 - 2033 ($BILLION)
- FIGURE 19. NORTH AMERICA VACCINES MARKET FOR HUMAN PAPILLOMA VIRUS, BY COUNTRY, 2024 - 2033 ($BILLION)
- FIGURE 20. NORTH AMERICA VACCINES MARKET FOR MENINGOCOCCAL DISEASE, BY COUNTRY, 2024 - 2033 ($BILLION)
- FIGURE 21. NORTH AMERICA VACCINES MARKET FOR ROTAVIRUS, BY COUNTRY, 2024 - 2033 ($BILLION)
- FIGURE 22. NORTH AMERICA VACCINES MARKET FOR VARICELLA, BY COUNTRY, 2024 - 2033 ($BILLION)
- FIGURE 23. NORTH AMERICA VACCINES MARKET FOR MEASLES, MUMPS, AND RUBELLA, BY COUNTRY, 2024 - 2033 ($BILLION)
- FIGURE 24. NORTH AMERICA VACCINES MARKET FOR DIPHTHERIA, PERTUSSIS, AND TETANUS (DTP), BY COUNTRY, 2024 - 2033 ($BILLION)
- FIGURE 25. NORTH AMERICA VACCINES MARKET FOR POLIO, BY COUNTRY, 2024 - 2033 ($BILLION)
- FIGURE 26. NORTH AMERICA VACCINES MARKET FOR HEPATITIS, BY COUNTRY, 2024 - 2033 ($BILLION)
- FIGURE 27. NORTH AMERICA VACCINES MARKET FOR OTHER INDICATIONS, BY COUNTRY, 2024 - 2033 ($BILLION)
- FIGURE 28. NORTH AMERICA VACCINES MARKET , BY END USER,2024 - 2033 ($BILLION)
- FIGURE 29. NORTH AMERICA VACCINES MARKET FOR PEDIATRIC, BY COUNTRY, 2024 - 2033 ($BILLION)
- FIGURE 30. NORTH AMERICA VACCINES MARKET FOR ADULTS, BY COUNTRY, 2024 - 2033 ($BILLION)
- FIGURE 31. NORTH AMERICA VACCINES MARKET FOR TRAVELERS, BY COUNTRY, 2024 - 2033 ($BILLION)
- FIGURE 32. TOP WINNING STRATEGIES, BY YEAR, 2022-2024*
- FIGURE 33. TOP WINNING STRATEGIES, BY DEVELOPMENT, 2022-2024*
- FIGURE 34. TOP WINNING STRATEGIES, BY COMPANY, 2022-2024*
- FIGURE 35. PRODUCT MAPPING OF TOP 10 PLAYERS
- FIGURE 36. COMPETITIVE DASHBOARD
- FIGURE 37. COMPETITIVE HEATMAP: NORTH AMERICA VACCINES MARKET
- FIGURE 38. TOP PLAYER POSITIONING,2023
- FIGURE 39. BAVARIAN NORDIC A/S: NET SALES, 2022-2024 ($BILLION)
- FIGURE 40. BAVARIAN NORDIC A/S: REVENUE SHARE, BY SEGMENT, 2023 (%)
- FIGURE 41. BAVARIAN NORDIC A/S: REVENUE SHARE, BY REGION, 2024 (%)
- FIGURE 42. MERCK AND CO., INC.: NET SALES, 2022-2024 ($BILLION)
- FIGURE 43. MERCK AND CO., INC.: REVENUE SHARE, BY SEGMENT, 2023 (%)
- FIGURE 44. MERCK AND CO., INC.: REVENUE SHARE, BY REGION, 2024 (%)
- FIGURE 45. SANOFI: NET SALES, 2022-2024 ($BILLION)
- FIGURE 46. SANOFI: REVENUE SHARE, BY SEGMENT, 2023 (%)
- FIGURE 47. SANOFI: REVENUE SHARE, BY REGION, 2024 (%)
- FIGURE 48. PFIZER: NET SALES, 2022-2024 ($BILLION)
- FIGURE 49. PFIZER: REVENUE SHARE, BY SEGMENT, 2023 (%)
- FIGURE 50. PFIZER: REVENUE SHARE, BY REGION, 2024 (%)
- FIGURE 51. EMERGENT BIOSOLUTIONS: NET SALES, 2022-2024 ($BILLION)
- FIGURE 52. EMERGENT BIOSOLUTIONS: REVENUE SHARE, BY SEGMENT, 2023 (%)
- FIGURE 53. EMERGENT BIOSOLUTIONS: REVENUE SHARE, BY REGION, 2024 (%)
- FIGURE 54. CSL: NET SALES, 2022-2024 ($BILLION)
- FIGURE 55. CSL: REVENUE SHARE, BY SEGMENT, 2023 (%)
- FIGURE 56. CSL: REVENUE SHARE, BY REGION, 2024 (%)
- FIGURE 57. MODERNA, INC.: NET SALES, 2022-2024 ($BILLION)
- FIGURE 58. MODERNA, INC.: REVENUE SHARE, BY SEGMENT, 2023 (%)
- FIGURE 59. MODERNA, INC.: REVENUE SHARE, BY REGION, 2024 (%)
- FIGURE 60. DYNAVAX TECHNOLOGIES: NET SALES, 2022-2024 ($BILLION)
- FIGURE 61. DYNAVAX TECHNOLOGIES: REVENUE SHARE, BY SEGMENT, 2023 (%)
- FIGURE 62. DYNAVAX TECHNOLOGIES: REVENUE SHARE, BY REGION, 2024 (%)
- FIGURE 63. NOVAVAX: NET SALES, 2022-2024 ($BILLION)
- FIGURE 64. NOVAVAX: REVENUE SHARE, BY SEGMENT, 2023 (%)
- FIGURE 65. NOVAVAX: REVENUE SHARE, BY REGION, 2024 (%)
- FIGURE 66. GSK PLC.: NET SALES, 2022-2024 ($BILLION)
- FIGURE 67. GSK PLC.: REVENUE SHARE, BY SEGMENT, 2023 (%)
- FIGURE 68. GSK PLC.: REVENUE SHARE, BY REGION, 2024 (%)

