
PUBLISHER: Allied Market Research | PRODUCT CODE: 1641810

PUBLISHER: Allied Market Research | PRODUCT CODE: 1641810
U.S. Tattoo Removal Market By Procedures (Laser Procedure, Surgical Procedure, Creams, Others) , By End User (Dermatology Clinics, Hospitals, Others) : Opportunity Analysis and Industry Forecast, 2024-2033
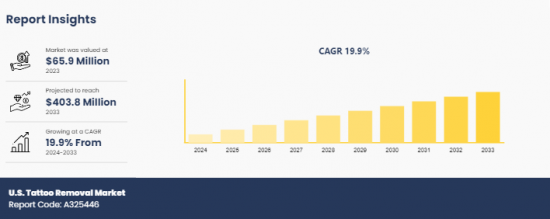
The U.S. tattoo removal market was valued at $65.9 million in 2023, and is projected to reach $403.8 million by 2033, growing at a CAGR of 19.9% from 2024 to 2033.
Tattoo removal is the process of eliminating unwanted tattoos from the skin. It involves various techniques, such as laser treatment, surgical excision, or dermabrasion, to break down tattoo pigments and restore the skin's natural appearance. Among these, laser removal is the most widely used and effective method due to its precision and minimal damage to surrounding tissues.
The growing number of people with tattoos has naturally led to a parallel rise in individuals seeking removal due to personal or professional reasons, which significantly fosters the growth of the U.S. tattoo removal market. According to a 2023 national survey conducted by Advanced Dermatology in Illinois, 15% of individuals regretted their tattoos within six months to a year, and this number increased to 51% after two years. In addition, increase in the prevalence of tattoo regret acts as the key driving force of the market. As per a 2021 survey by Statista, approximately 12% of Americans regretted getting at least one of their tattoos. Moreover, the expansion of dermatology clinics and cosmetic centers in the U.S. has improved access to tattoo removal services, which augments the market growth. The American Society for Dermatologic Surgery reported performing over 160,000 tattoo removal procedures in 2019, indicating a growing demand for these services. Furthermore, the preference for minimally invasive and non-invasive aesthetic treatments aligns with the popularity of laser tattoo removal over surgical options, thereby fostering the market growth. However, high expense of tattoo removal services, especially advanced laser techniques, limits their accessibility to a broader population. Side effects such as scarring, skin discoloration, or irritation, discourage some individuals from opting for the treatment, which further hampers the market growth. On the contrary, the introduction of picosecond lasers and other advanced technologies has improved the effectiveness, safety, and comfort of tattoo removal, attracting more clients. Such developments are expected to open new avenues for the expansion of the market growth during the forecast period.
The U.S. tattoo removal market is segmented into procedure and end user. On the basis of procedure, the market is fragmented into laser procedure, surgical procedure, creams, and others. As per end user, it is segregated into hospitals, dermatology clinics, and others.
Key Findings
On the basis of procedure, the laser procedure segment accounted for the largest share of the U.S. tattoo removal market in 2023.
By end user, the market dermatology clinics segment was the major revenue generator in 2023, and is expected to maintain its lead from 2024 to 2033.
Competition Analysis
The major players operating in the U.S. tattoo removal market include Berry Global Group, Inc., Fosun Pharma (Alma Lasers), cipher pharmaceuticals inc., Cynosure Lutronic Inc, Candela Medical, Lumenis Ltd., Fotona, Beijing VCA Laser Technology Co., Ltd., Schweiger Dermatology Group, and U.S. Dermatology Partners. These major players have adopted various key development strategies such as business expansion, new product launches, and partnerships to sustain the intense competition and gain strong foothold in the market.
Additional benefits you will get with this purchase are:
- Quarterly Update and* (only available with a corporate license, on listed price)
- 5 additional Company Profile of client Choice pre- or Post-purchase, as a free update.
- Free Upcoming Version on the Purchase of Five and Enterprise User License.
- 16 analyst hours of support* (post-purchase, if you find additional data requirements upon review of the report, you may receive support amounting to 16 analyst hours to solve questions, and post-sale queries)
- 15% Free Customization* (in case the scope or segment of the report does not match your requirements, 15% is equivalent to 3 working days of free work, applicable once)
- Free data Pack on the Five and Enterprise User License. (Excel version of the report)
- Free Updated report if the report is 6-12 months old or older.
- 24-hour priority response*
- Free Industry updates and white papers.
Possible Customization with this report (with additional cost and timeline, please talk to the sales executive to know more)
- Regulatory Guidelines
- Additional company profiles with specific to client's interest
- Additional country or region analysis- market size and forecast
- Expanded list for Company Profiles
- Historic market data
- Key player details (including location, contact details, supplier/vendor network etc. in excel format)
Key Market Segments
By Procedures
- Laser Procedure
- Surgical Procedure
- Creams
- Others
By End User
- Dermatology Clinics
- Hospitals
- Others
Key Market Players:
- Berry Global Group, Inc.
- Fosun Pharma (Alma Lasers)
- cipher pharmaceuticals inc.
- Cynosure Lutronic Inc
- Candela Medical
- Lumenis Ltd.
- Fotona
- Beijing VCA Laser Technology Co., Ltd.
- Schweiger Dermatology Group
- U.S. Dermatology Partners
TABLE OF CONTENTS
CHAPTER 1: INTRODUCTION
- 1.1. Report Description
- 1.2. Key Market Segments
- 1.3. Key Benefits
- 1.4. Research Methodology
- 1.4.1. Primary Research
- 1.4.2. Secondary Research
- 1.4.3. Analyst Tools and Models
CHAPTER 2: EXECUTIVE SUMMARY
- 2.1. CXO Perspective
CHAPTER 3: MARKET LANDSCAPE
- 3.1. Market Definition and Scope
- 3.2. Key Findings
- 3.2.1. Top Investment Pockets
- 3.2.2. Top Winning Strategies
- 3.3. Porter's Five Forces Analysis
- 3.3.1. Bargaining Power of Suppliers
- 3.3.2. Threat of New Entrants
- 3.3.3. Threat of Substitutes
- 3.3.4. Competitive Rivalry
- 3.3.5. Bargaining Power among Buyers
- 3.4. Market Dynamics
- 3.4.1. Drivers
- 3.4.2. Restraints
- 3.4.3. Opportunities
CHAPTER 4: U.S. TATTOO REMOVAL MARKET, BY PROCEDURES
- 4.1. Market Overview
- 4.1.1 Market Size and Forecast, By Procedures
- 4.2. Laser Procedure
- 4.2.1. Key Market Trends, Growth Factors and Opportunities
- 4.3. Surgical Procedure
- 4.3.1. Key Market Trends, Growth Factors and Opportunities
- 4.4. Creams
- 4.4.1. Key Market Trends, Growth Factors and Opportunities
- 4.5. Others
- 4.5.1. Key Market Trends, Growth Factors and Opportunities
CHAPTER 5: U.S. TATTOO REMOVAL MARKET, BY END USER
- 5.1. Market Overview
- 5.1.1 Market Size and Forecast, By End User
- 5.2. Dermatology Clinics
- 5.2.1. Key Market Trends, Growth Factors and Opportunities
- 5.3. Hospitals
- 5.3.1. Key Market Trends, Growth Factors and Opportunities
- 5.4. Others
- 5.4.1. Key Market Trends, Growth Factors and Opportunities
CHAPTER 6: COMPETITIVE LANDSCAPE
- 6.1. Introduction
- 6.2. Top Winning Strategies
- 6.3. Product Mapping Of Top 10 Player
- 6.4. Competitive Dashboard
- 6.5. Competitive Heatmap
- 6.6. Top Player Positioning,2023
CHAPTER 7: COMPANY PROFILES
- 7.1. Berry Global Group, Inc.
- 7.1.1. Company Overview
- 7.1.2. Key Executives
- 7.1.3. Company Snapshot
- 7.1.4. Operating Business Segments
- 7.1.5. Product Portfolio
- 7.1.6. Business Performance
- 7.1.7. Key Strategic Moves and Developments
- 7.2. Fosun Pharma (Alma Lasers)
- 7.2.1. Company Overview
- 7.2.2. Key Executives
- 7.2.3. Company Snapshot
- 7.2.4. Operating Business Segments
- 7.2.5. Product Portfolio
- 7.2.6. Business Performance
- 7.2.7. Key Strategic Moves and Developments
- 7.3. Cipher Pharmaceuticals Inc.
- 7.3.1. Company Overview
- 7.3.2. Key Executives
- 7.3.3. Company Snapshot
- 7.3.4. Operating Business Segments
- 7.3.5. Product Portfolio
- 7.3.6. Business Performance
- 7.3.7. Key Strategic Moves and Developments
- 7.4. Cynosure Lutronic Inc
- 7.4.1. Company Overview
- 7.4.2. Key Executives
- 7.4.3. Company Snapshot
- 7.4.4. Operating Business Segments
- 7.4.5. Product Portfolio
- 7.4.6. Business Performance
- 7.4.7. Key Strategic Moves and Developments
- 7.5. Candela Medical
- 7.5.1. Company Overview
- 7.5.2. Key Executives
- 7.5.3. Company Snapshot
- 7.5.4. Operating Business Segments
- 7.5.5. Product Portfolio
- 7.5.6. Business Performance
- 7.5.7. Key Strategic Moves and Developments
- 7.6. Lumenis Ltd.
- 7.6.1. Company Overview
- 7.6.2. Key Executives
- 7.6.3. Company Snapshot
- 7.6.4. Operating Business Segments
- 7.6.5. Product Portfolio
- 7.6.6. Business Performance
- 7.6.7. Key Strategic Moves and Developments
- 7.7. Fotona
- 7.7.1. Company Overview
- 7.7.2. Key Executives
- 7.7.3. Company Snapshot
- 7.7.4. Operating Business Segments
- 7.7.5. Product Portfolio
- 7.7.6. Business Performance
- 7.7.7. Key Strategic Moves and Developments
- 7.8. Beijing VCA Laser Technology Co., Ltd.
- 7.8.1. Company Overview
- 7.8.2. Key Executives
- 7.8.3. Company Snapshot
- 7.8.4. Operating Business Segments
- 7.8.5. Product Portfolio
- 7.8.6. Business Performance
- 7.8.7. Key Strategic Moves and Developments
- 7.9. Schweiger Dermatology Group
- 7.9.1. Company Overview
- 7.9.2. Key Executives
- 7.9.3. Company Snapshot
- 7.9.4. Operating Business Segments
- 7.9.5. Product Portfolio
- 7.9.6. Business Performance
- 7.9.7. Key Strategic Moves and Developments
- 7.10. U.S. Dermatology Partners
- 7.10.1. Company Overview
- 7.10.2. Key Executives
- 7.10.3. Company Snapshot
- 7.10.4. Operating Business Segments
- 7.10.5. Product Portfolio
- 7.10.6. Business Performance
- 7.10.7. Key Strategic Moves and Developments
- TABLE 1. U.S. TATTOO REMOVAL MARKET, BY PROCEDURES, 2024 - 2033 ($MILLION)
- TABLE 2. U.S. TATTOO REMOVAL MARKET, BY END USER, 2024 - 2033 ($MILLION)
- TABLE 3. BERRY GLOBAL GROUP, INC.: KEY EXECUTIVES
- TABLE 4. BERRY GLOBAL GROUP, INC.: COMPANY SNAPSHOT
- TABLE 5. BERRY GLOBAL GROUP, INC.: OPERATING SEGMENTS
- TABLE 6. BERRY GLOBAL GROUP, INC.: PRODUCT PORTFOLIO
- TABLE 7. BERRY GLOBAL GROUP, INC.: KEY STRATEGIC MOVES AND DEVELOPMENTS
- TABLE 8. FOSUN PHARMA (ALMA LASERS): KEY EXECUTIVES
- TABLE 9. FOSUN PHARMA (ALMA LASERS): COMPANY SNAPSHOT
- TABLE 10. FOSUN PHARMA (ALMA LASERS): OPERATING SEGMENTS
- TABLE 11. FOSUN PHARMA (ALMA LASERS): PRODUCT PORTFOLIO
- TABLE 12. FOSUN PHARMA (ALMA LASERS): KEY STRATEGIC MOVES AND DEVELOPMENTS
- TABLE 13. CIPHER PHARMACEUTICALS INC.: KEY EXECUTIVES
- TABLE 14. CIPHER PHARMACEUTICALS INC.: COMPANY SNAPSHOT
- TABLE 15. CIPHER PHARMACEUTICALS INC.: OPERATING SEGMENTS
- TABLE 16. CIPHER PHARMACEUTICALS INC.: PRODUCT PORTFOLIO
- TABLE 17. CIPHER PHARMACEUTICALS INC.: KEY STRATEGIC MOVES AND DEVELOPMENTS
- TABLE 18. CYNOSURE LUTRONIC INC: KEY EXECUTIVES
- TABLE 19. CYNOSURE LUTRONIC INC: COMPANY SNAPSHOT
- TABLE 20. CYNOSURE LUTRONIC INC: OPERATING SEGMENTS
- TABLE 21. CYNOSURE LUTRONIC INC: PRODUCT PORTFOLIO
- TABLE 22. CYNOSURE LUTRONIC INC: KEY STRATEGIC MOVES AND DEVELOPMENTS
- TABLE 23. CANDELA MEDICAL: KEY EXECUTIVES
- TABLE 24. CANDELA MEDICAL: COMPANY SNAPSHOT
- TABLE 25. CANDELA MEDICAL: OPERATING SEGMENTS
- TABLE 26. CANDELA MEDICAL: PRODUCT PORTFOLIO
- TABLE 27. CANDELA MEDICAL: KEY STRATEGIC MOVES AND DEVELOPMENTS
- TABLE 28. LUMENIS LTD.: KEY EXECUTIVES
- TABLE 29. LUMENIS LTD.: COMPANY SNAPSHOT
- TABLE 30. LUMENIS LTD.: OPERATING SEGMENTS
- TABLE 31. LUMENIS LTD.: PRODUCT PORTFOLIO
- TABLE 32. LUMENIS LTD.: KEY STRATEGIC MOVES AND DEVELOPMENTS
- TABLE 33. FOTONA: KEY EXECUTIVES
- TABLE 34. FOTONA: COMPANY SNAPSHOT
- TABLE 35. FOTONA: OPERATING SEGMENTS
- TABLE 36. FOTONA: PRODUCT PORTFOLIO
- TABLE 37. FOTONA: KEY STRATEGIC MOVES AND DEVELOPMENTS
- TABLE 38. BEIJING VCA LASER TECHNOLOGY CO., LTD.: KEY EXECUTIVES
- TABLE 39. BEIJING VCA LASER TECHNOLOGY CO., LTD.: COMPANY SNAPSHOT
- TABLE 40. BEIJING VCA LASER TECHNOLOGY CO., LTD.: OPERATING SEGMENTS
- TABLE 41. BEIJING VCA LASER TECHNOLOGY CO., LTD.: PRODUCT PORTFOLIO
- TABLE 42. BEIJING VCA LASER TECHNOLOGY CO., LTD.: KEY STRATEGIC MOVES AND DEVELOPMENTS
- TABLE 43. SCHWEIGER DERMATOLOGY GROUP: KEY EXECUTIVES
- TABLE 44. SCHWEIGER DERMATOLOGY GROUP: COMPANY SNAPSHOT
- TABLE 45. SCHWEIGER DERMATOLOGY GROUP: OPERATING SEGMENTS
- TABLE 46. SCHWEIGER DERMATOLOGY GROUP: PRODUCT PORTFOLIO
- TABLE 47. SCHWEIGER DERMATOLOGY GROUP: KEY STRATEGIC MOVES AND DEVELOPMENTS
- TABLE 48. U.S. DERMATOLOGY PARTNERS: KEY EXECUTIVES
- TABLE 49. U.S. DERMATOLOGY PARTNERS: COMPANY SNAPSHOT
- TABLE 50. U.S. DERMATOLOGY PARTNERS: OPERATING SEGMENTS
- TABLE 51. U.S. DERMATOLOGY PARTNERS: PRODUCT PORTFOLIO
- TABLE 52. U.S. DERMATOLOGY PARTNERS: KEY STRATEGIC MOVES AND DEVELOPMENTS
- FIGURE 1. U.S. TATTOO REMOVAL MARKET,2024 - 2033
- FIGURE 2. SEGMENTATION OF U.S. TATTOO REMOVAL MARKET,2024 - 2033
- FIGURE 3. TOP INVESTMENT POCKET IN U.S. TATTOO REMOVAL MARKET,2024 - 2033
- FIGURE 4. MODERATE BARGAINING POWER OF BUYERS
- FIGURE 5. MODERATE BARGAINING POWER OF SUPPLIERS
- FIGURE 6. MODERATE THREAT OF NEW ENTRANTS
- FIGURE 7. LOW THREAT OF SUBSTITUTION
- FIGURE 8. HIGH COMPETITIVE RIVALRY
- FIGURE 9. OPPORTUNITIES, RESTRAINTS AND DRIVERS: U.S. TATTOO REMOVAL MARKET
- FIGURE 10. U.S. TATTOO REMOVAL MARKET , BY PROCEDURES,2024 - 2033 ($MILLION)
- FIGURE 11. U.S. TATTOO REMOVAL MARKET , BY END USER,2024 - 2033 ($MILLION)
- FIGURE 12. TOP WINNING STRATEGIES, BY YEAR, 2022-2024*
- FIGURE 13. TOP WINNING STRATEGIES, BY DEVELOPMENT, 2022-2024*
- FIGURE 14. TOP WINNING STRATEGIES, BY COMPANY, 2022-2024*
- FIGURE 15. PRODUCT MAPPING OF TOP 10 PLAYERS
- FIGURE 16. COMPETITIVE DASHBOARD
- FIGURE 17. COMPETITIVE HEATMAP: U.S. TATTOO REMOVAL MARKET
- FIGURE 18. TOP PLAYER POSITIONING,2023
- FIGURE 19. BERRY GLOBAL GROUP, INC.: NET SALES, 2022-2024 ($MILLION)
- FIGURE 20. BERRY GLOBAL GROUP, INC.: REVENUE SHARE, BY SEGMENT, 2023 (%)
- FIGURE 21. BERRY GLOBAL GROUP, INC.: REVENUE SHARE, BY REGION, 2024 (%)
- FIGURE 22. FOSUN PHARMA (ALMA LASERS): NET SALES, 2022-2024 ($MILLION)
- FIGURE 23. FOSUN PHARMA (ALMA LASERS): REVENUE SHARE, BY SEGMENT, 2023 (%)
- FIGURE 24. FOSUN PHARMA (ALMA LASERS): REVENUE SHARE, BY REGION, 2024 (%)
- FIGURE 25. CIPHER PHARMACEUTICALS INC.: NET SALES, 2022-2024 ($MILLION)
- FIGURE 26. CIPHER PHARMACEUTICALS INC.: REVENUE SHARE, BY SEGMENT, 2023 (%)
- FIGURE 27. CIPHER PHARMACEUTICALS INC.: REVENUE SHARE, BY REGION, 2024 (%)
- FIGURE 28. CYNOSURE LUTRONIC INC: NET SALES, 2022-2024 ($MILLION)
- FIGURE 29. CYNOSURE LUTRONIC INC: REVENUE SHARE, BY SEGMENT, 2023 (%)
- FIGURE 30. CYNOSURE LUTRONIC INC: REVENUE SHARE, BY REGION, 2024 (%)
- FIGURE 31. CANDELA MEDICAL: NET SALES, 2022-2024 ($MILLION)
- FIGURE 32. CANDELA MEDICAL: REVENUE SHARE, BY SEGMENT, 2023 (%)
- FIGURE 33. CANDELA MEDICAL: REVENUE SHARE, BY REGION, 2024 (%)
- FIGURE 34. LUMENIS LTD.: NET SALES, 2022-2024 ($MILLION)
- FIGURE 35. LUMENIS LTD.: REVENUE SHARE, BY SEGMENT, 2023 (%)
- FIGURE 36. LUMENIS LTD.: REVENUE SHARE, BY REGION, 2024 (%)
- FIGURE 37. FOTONA: NET SALES, 2022-2024 ($MILLION)
- FIGURE 38. FOTONA: REVENUE SHARE, BY SEGMENT, 2023 (%)
- FIGURE 39. FOTONA: REVENUE SHARE, BY REGION, 2024 (%)
- FIGURE 40. BEIJING VCA LASER TECHNOLOGY CO., LTD.: NET SALES, 2022-2024 ($MILLION)
- FIGURE 41. BEIJING VCA LASER TECHNOLOGY CO., LTD.: REVENUE SHARE, BY SEGMENT, 2023 (%)
- FIGURE 42. BEIJING VCA LASER TECHNOLOGY CO., LTD.: REVENUE SHARE, BY REGION, 2024 (%)
- FIGURE 43. SCHWEIGER DERMATOLOGY GROUP: NET SALES, 2022-2024 ($MILLION)
- FIGURE 44. SCHWEIGER DERMATOLOGY GROUP: REVENUE SHARE, BY SEGMENT, 2023 (%)
- FIGURE 45. SCHWEIGER DERMATOLOGY GROUP: REVENUE SHARE, BY REGION, 2024 (%)
- FIGURE 46. U.S. DERMATOLOGY PARTNERS: NET SALES, 2022-2024 ($MILLION)
- FIGURE 47. U.S. DERMATOLOGY PARTNERS: REVENUE SHARE, BY SEGMENT, 2023 (%)
- FIGURE 48. U.S. DERMATOLOGY PARTNERS: REVENUE SHARE, BY REGION, 2024 (%)

