
PUBLISHER: Allied Market Research | PRODUCT CODE: 1641801

PUBLISHER: Allied Market Research | PRODUCT CODE: 1641801
Compressor Oils Market By Type (Synthetic Oil, Mineral Oil) , By End-Use Industry (Construction, Mining, Automotive, Manufacturing Industry, Others) : Global Opportunity Analysis and Industry Forecast, 2024-2033
Compressor Oils Market
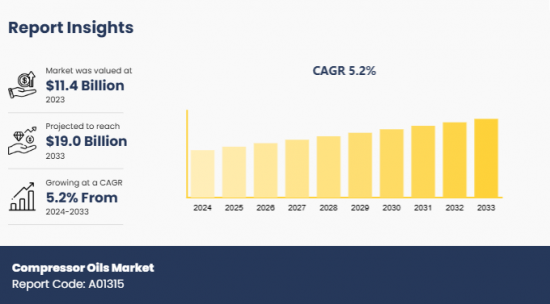
The compressor oils market was valued at $11.4 billion in 2023 and is projected to reach $19.0 billion by 2033, growing at a CAGR of 5.2% from 2024 to 2033.
Compressor oil is a high-viscosity lubricant that reduces friction and heat in air compressors, an equipment used in various industries such as refrigeration, air conditioning, automotive, and manufacturing. In certain types, such as screw or piston compressors, the oil acts as a sealant by securing the clearance spaces between moving parts. The major characteristics of compressor oils are their thermal stability, foam resistance, oxidation resistance, and low pour point.
The growth of the compressor oils market is being augmented by rapid surge in the residential, commercial, and industrial sectors. These sectors heavily rely on different machinery and equipment, which fuels the demand for compressor oils. Furthermore, the enforcement of stringent energy efficiency standards for different industries has boosted the usage of compressor oils due to their ability to minimize energy consumption of equipment via smooth operations and reduced energy losses. To enhance the sustainability of compressor oils, manufacturers are exploring the formation of these oils from renewable and plant-based sources. Currently at a nascent stage, the development of bio-based oils is poised to become a prominent trend in the future as several industries are focusing on the adoption of eco-friendly practices and solutions to contribute to environmental goals.
However, fluctuations in the costs of raw materials required to develop compressor oils, such as additives & crude oil, affect the overall pricing structure and hamper the development of the market. Moreover, the availability of non-oil-based lubricants presents significant competition to the compressor oils, thereby restraining the market growth. Contrarily, expansion of the renewable energy infrastructure is anticipated to present lucrative opportunities for the compressor oils market as wind energy, solar power, and biogas production primarily rely on compressors to accomplish different processes. The International Energy Agency anticipates the global renewable capacity to increase to over 5,520 GW by 2030. This is expected to open new avenues for the compressor oils market due to projected surge in requirement for compressors to achieve the renewable targets.
Segment Review
The compressor oils market is segmented into type, end-use industry, and region. On the basis of type, the market is bifurcated into synthetic oil and mineral oil. Depending on end-use industry, it is classified into construction, mining, automotive, manufacturing industry, and others. Region wise, it is analyzed across North America, Europe, Asia-Pacific, and LAMEA.
Key Findings
On the basis of type, the synthetic oil segment held the highest market share in 2023.
Depending on end-use industry, the manufacturing industry segment acquired a notable stake in the market in 2023.
Region wise, Asia-Pacific was the highest revenue generator in 2023.
Competition Analysis
The major players in the global compressor oils market include Shell Plc, ExxonMobil Corporation, Chevron Corporation, Total Energies SE, Indian Oil Corporation Ltd., The Lubrizol Corporation, BASF SE, ENI S.p.A, BP PLC, and Atlas Copco Compressors LLC. These major players have adopted various key development strategies such as business expansion, new product launches, and partnerships to strengthen their foothold in the competitive market.
Additional benefits you will get with this purchase are:
- Quarterly Update and* (only available with a corporate license, on listed price)
- 5 additional Company Profile of client Choice pre- or Post-purchase, as a free update.
- Free Upcoming Version on the Purchase of Five and Enterprise User License.
- 16 analyst hours of support* (post-purchase, if you find additional data requirements upon review of the report, you may receive support amounting to 16 analyst hours to solve questions, and post-sale queries)
- 15% Free Customization* (in case the scope or segment of the report does not match your requirements, 15% is equivalent to 3 working days of free work, applicable once)
- Free data Pack on the Five and Enterprise User License. (Excel version of the report)
- Free Updated report if the report is 6-12 months old or older.
- 24-hour priority response*
- Free Industry updates and white papers.
Possible Customization with this report (with additional cost and timeline, please talk to the sales executive to know more)
- Manufacturing Capacity
- End user preferences and pain points
- Industry life cycle assessment, by region
- Installed Base analysis
- Investment Opportunities
- Product Benchmarking / Product specification and applications
- Product Life Cycles
- Scenario Analysis & Growth Trend Comparison
- Technology Trend Analysis
- Distributor margin Analysis
- Go To Market Strategy
- Market share analysis of players by products/segments
- New Product Development/ Product Matrix of Key Players
- Regulatory Guidelines
- Additional company profiles with specific to client's interest
- Additional country or region analysis- market size and forecast
- Brands Share Analysis
- Historic market data
- Import Export Analysis/Data
- Key player details (including location, contact details, supplier/vendor network etc. in excel format)
- List of customers/consumers/raw material suppliers- value chain analysis
- Market share analysis of players at global/region/country level
- Per Capita Consumption Trends
- Product Consumption Analysis
- SWOT Analysis
Key Market Segments
By Type
- Synthetic Oil
- Mineral Oil
By End-Use Industry
- Construction
- Mining
- Automotive
- Manufacturing Industry
- Others
By Region
- North America
- U.S.
- Canada
- Mexico
- Europe
- France
- Germany
- Italy
- Spain
- UK
- Rest of Europe
- Asia-Pacific
- China
- Japan
- India
- South Korea
- Australia
- Rest of Asia-Pacific
- LAMEA
- Brazil
- South Africa
- Saudi Arabia
- Rest of LAMEA
Key Market Players:
- Shell Plc,
- ExxonMobil Corporation
- Chevron Corporation
- Total Energies SE
- Indian Oil Corporation Ltd
- The Lubrizol Corporation
- BASF SE
- ENI S.p.A
- BP PLC
- Atlas Copco Compressors LLC
TABLE OF CONTENTS
CHAPTER 1: INTRODUCTION
- 1.1. Report Description
- 1.2. Key Market Segments
- 1.3. Key Benefits
- 1.4. Research Methodology
- 1.4.1. Primary Research
- 1.4.2. Secondary Research
- 1.4.3. Analyst Tools and Models
CHAPTER 2: EXECUTIVE SUMMARY
- 2.1. CXO Perspective
CHAPTER 3: MARKET LANDSCAPE
- 3.1. Market Definition and Scope
- 3.2. Key Findings
- 3.2.1. Top Investment Pockets
- 3.2.2. Top Winning Strategies
- 3.3. Porter's Five Forces Analysis
- 3.3.1. Bargaining Power of Suppliers
- 3.3.2. Threat of New Entrants
- 3.3.3. Threat of Substitutes
- 3.3.4. Competitive Rivalry
- 3.3.5. Bargaining Power among Buyers
- 3.4. Market Dynamics
- 3.4.1. Drivers
- 3.4.2. Restraints
- 3.4.3. Opportunities
CHAPTER 4: COMPRESSOR OILS MARKET, BY TYPE
- 4.1. Market Overview
- 4.1.1 Market Size and Forecast, By Type
- 4.2. Synthetic Oil
- 4.2.1. Key Market Trends, Growth Factors and Opportunities
- 4.2.2. Market Size and Forecast, By Region
- 4.2.3. Market Share Analysis, By Country
- 4.3. Mineral Oil
- 4.3.1. Key Market Trends, Growth Factors and Opportunities
- 4.3.2. Market Size and Forecast, By Region
- 4.3.3. Market Share Analysis, By Country
CHAPTER 5: COMPRESSOR OILS MARKET, BY END-USE INDUSTRY
- 5.1. Market Overview
- 5.1.1 Market Size and Forecast, By End-use Industry
- 5.2. Construction
- 5.2.1. Key Market Trends, Growth Factors and Opportunities
- 5.2.2. Market Size and Forecast, By Region
- 5.2.3. Market Share Analysis, By Country
- 5.3. Mining
- 5.3.1. Key Market Trends, Growth Factors and Opportunities
- 5.3.2. Market Size and Forecast, By Region
- 5.3.3. Market Share Analysis, By Country
- 5.4. Automotive
- 5.4.1. Key Market Trends, Growth Factors and Opportunities
- 5.4.2. Market Size and Forecast, By Region
- 5.4.3. Market Share Analysis, By Country
- 5.5. Manufacturing Industry
- 5.5.1. Key Market Trends, Growth Factors and Opportunities
- 5.5.2. Market Size and Forecast, By Region
- 5.5.3. Market Share Analysis, By Country
- 5.6. Others
- 5.6.1. Key Market Trends, Growth Factors and Opportunities
- 5.6.2. Market Size and Forecast, By Region
- 5.6.3. Market Share Analysis, By Country
CHAPTER 6: COMPRESSOR OILS MARKET, BY REGION
- 6.1. Market Overview
- 6.1.1 Market Size and Forecast, By Region
- 6.2. North America
- 6.2.1. Key Market Trends and Opportunities
- 6.2.2. Market Size and Forecast, By Type
- 6.2.3. Market Size and Forecast, By End-use Industry
- 6.2.4. Market Size and Forecast, By Country
- 6.2.5. U.S. Compressor Oils Market
- 6.2.5.1. Market Size and Forecast, By Type
- 6.2.5.2. Market Size and Forecast, By End-use Industry
- 6.2.6. Canada Compressor Oils Market
- 6.2.6.1. Market Size and Forecast, By Type
- 6.2.6.2. Market Size and Forecast, By End-use Industry
- 6.2.7. Mexico Compressor Oils Market
- 6.2.7.1. Market Size and Forecast, By Type
- 6.2.7.2. Market Size and Forecast, By End-use Industry
- 6.3. Europe
- 6.3.1. Key Market Trends and Opportunities
- 6.3.2. Market Size and Forecast, By Type
- 6.3.3. Market Size and Forecast, By End-use Industry
- 6.3.4. Market Size and Forecast, By Country
- 6.3.5. France Compressor Oils Market
- 6.3.5.1. Market Size and Forecast, By Type
- 6.3.5.2. Market Size and Forecast, By End-use Industry
- 6.3.6. Germany Compressor Oils Market
- 6.3.6.1. Market Size and Forecast, By Type
- 6.3.6.2. Market Size and Forecast, By End-use Industry
- 6.3.7. Italy Compressor Oils Market
- 6.3.7.1. Market Size and Forecast, By Type
- 6.3.7.2. Market Size and Forecast, By End-use Industry
- 6.3.8. Spain Compressor Oils Market
- 6.3.8.1. Market Size and Forecast, By Type
- 6.3.8.2. Market Size and Forecast, By End-use Industry
- 6.3.9. UK Compressor Oils Market
- 6.3.9.1. Market Size and Forecast, By Type
- 6.3.9.2. Market Size and Forecast, By End-use Industry
- 6.3.10. Rest Of Europe Compressor Oils Market
- 6.3.10.1. Market Size and Forecast, By Type
- 6.3.10.2. Market Size and Forecast, By End-use Industry
- 6.4. Asia-Pacific
- 6.4.1. Key Market Trends and Opportunities
- 6.4.2. Market Size and Forecast, By Type
- 6.4.3. Market Size and Forecast, By End-use Industry
- 6.4.4. Market Size and Forecast, By Country
- 6.4.5. China Compressor Oils Market
- 6.4.5.1. Market Size and Forecast, By Type
- 6.4.5.2. Market Size and Forecast, By End-use Industry
- 6.4.6. Japan Compressor Oils Market
- 6.4.6.1. Market Size and Forecast, By Type
- 6.4.6.2. Market Size and Forecast, By End-use Industry
- 6.4.7. India Compressor Oils Market
- 6.4.7.1. Market Size and Forecast, By Type
- 6.4.7.2. Market Size and Forecast, By End-use Industry
- 6.4.8. South Korea Compressor Oils Market
- 6.4.8.1. Market Size and Forecast, By Type
- 6.4.8.2. Market Size and Forecast, By End-use Industry
- 6.4.9. Australia Compressor Oils Market
- 6.4.9.1. Market Size and Forecast, By Type
- 6.4.9.2. Market Size and Forecast, By End-use Industry
- 6.4.10. Rest of Asia-Pacific Compressor Oils Market
- 6.4.10.1. Market Size and Forecast, By Type
- 6.4.10.2. Market Size and Forecast, By End-use Industry
- 6.5. LAMEA
- 6.5.1. Key Market Trends and Opportunities
- 6.5.2. Market Size and Forecast, By Type
- 6.5.3. Market Size and Forecast, By End-use Industry
- 6.5.4. Market Size and Forecast, By Country
- 6.5.5. Brazil Compressor Oils Market
- 6.5.5.1. Market Size and Forecast, By Type
- 6.5.5.2. Market Size and Forecast, By End-use Industry
- 6.5.6. South Africa Compressor Oils Market
- 6.5.6.1. Market Size and Forecast, By Type
- 6.5.6.2. Market Size and Forecast, By End-use Industry
- 6.5.7. Saudi Arabia Compressor Oils Market
- 6.5.7.1. Market Size and Forecast, By Type
- 6.5.7.2. Market Size and Forecast, By End-use Industry
- 6.5.8. Rest of LAMEA Compressor Oils Market
- 6.5.8.1. Market Size and Forecast, By Type
- 6.5.8.2. Market Size and Forecast, By End-use Industry
CHAPTER 7: COMPETITIVE LANDSCAPE
- 7.1. Introduction
- 7.2. Top Winning Strategies
- 7.3. Product Mapping Of Top 10 Player
- 7.4. Competitive Dashboard
- 7.5. Competitive Heatmap
- 7.6. Top Player Positioning, 2023
CHAPTER 8: COMPANY PROFILES
- 8.1. Shell Plc,
- 8.1.1. Company Overview
- 8.1.2. Key Executives
- 8.1.3. Company Snapshot
- 8.1.4. Operating Business Segments
- 8.1.5. Product Portfolio
- 8.1.6. Business Performance
- 8.1.7. Key Strategic Moves and Developments
- 8.2. ExxonMobil Corporation
- 8.2.1. Company Overview
- 8.2.2. Key Executives
- 8.2.3. Company Snapshot
- 8.2.4. Operating Business Segments
- 8.2.5. Product Portfolio
- 8.2.6. Business Performance
- 8.2.7. Key Strategic Moves and Developments
- 8.3. Chevron Corporation
- 8.3.1. Company Overview
- 8.3.2. Key Executives
- 8.3.3. Company Snapshot
- 8.3.4. Operating Business Segments
- 8.3.5. Product Portfolio
- 8.3.6. Business Performance
- 8.3.7. Key Strategic Moves and Developments
- 8.4. Total Energies SE
- 8.4.1. Company Overview
- 8.4.2. Key Executives
- 8.4.3. Company Snapshot
- 8.4.4. Operating Business Segments
- 8.4.5. Product Portfolio
- 8.4.6. Business Performance
- 8.4.7. Key Strategic Moves and Developments
- 8.5. Indian Oil Corporation Ltd
- 8.5.1. Company Overview
- 8.5.2. Key Executives
- 8.5.3. Company Snapshot
- 8.5.4. Operating Business Segments
- 8.5.5. Product Portfolio
- 8.5.6. Business Performance
- 8.5.7. Key Strategic Moves and Developments
- 8.6. The Lubrizol Corporation
- 8.6.1. Company Overview
- 8.6.2. Key Executives
- 8.6.3. Company Snapshot
- 8.6.4. Operating Business Segments
- 8.6.5. Product Portfolio
- 8.6.6. Business Performance
- 8.6.7. Key Strategic Moves and Developments
- 8.7. BASF SE
- 8.7.1. Company Overview
- 8.7.2. Key Executives
- 8.7.3. Company Snapshot
- 8.7.4. Operating Business Segments
- 8.7.5. Product Portfolio
- 8.7.6. Business Performance
- 8.7.7. Key Strategic Moves and Developments
- 8.8. ENI S.p.A
- 8.8.1. Company Overview
- 8.8.2. Key Executives
- 8.8.3. Company Snapshot
- 8.8.4. Operating Business Segments
- 8.8.5. Product Portfolio
- 8.8.6. Business Performance
- 8.8.7. Key Strategic Moves and Developments
- 8.9. BP PLC
- 8.9.1. Company Overview
- 8.9.2. Key Executives
- 8.9.3. Company Snapshot
- 8.9.4. Operating Business Segments
- 8.9.5. Product Portfolio
- 8.9.6. Business Performance
- 8.9.7. Key Strategic Moves and Developments
- 8.10. Atlas Copco Compressors LLC
- 8.10.1. Company Overview
- 8.10.2. Key Executives
- 8.10.3. Company Snapshot
- 8.10.4. Operating Business Segments
- 8.10.5. Product Portfolio
- 8.10.6. Business Performance
- 8.10.7. Key Strategic Moves and Developments

