
PUBLISHER: Allied Market Research | PRODUCT CODE: 1641800

PUBLISHER: Allied Market Research | PRODUCT CODE: 1641800
Drilling Waste Management Market By Service Type (Treatment & Disposal, Containment & Handling, Solids Control) , By Application (Onshore, Offshore) : Global Opportunity Analysis and Industry Forecast, 2024-2033
Drilling Waste Management Market
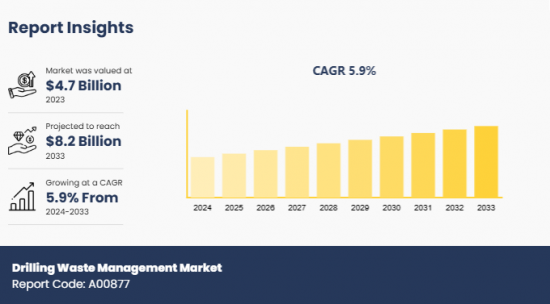
The drilling waste management market was valued at $4.7 billion in 2023 and is projected to reach $8.2 billion by 2033, growing at a CAGR of 5.9% from 2024 to 2033.
Drilling waste management comprises the technologies and processes that handle, treat, recycle, and dispose of waste materials generated during oil & gas exploration & production. The different types of wastes produced by drilling include cuttings, mud, water, sludge, and other residuals. The primary aim of performing drilling waste management remains to reduce environmental impact and optimize resource utilization.
Increase in the stringency of environmental regulations and enforcement of strict waste management policies regarding drilling operations are the key drivers of the drilling waste management market. In addition, rise in oil & gas explorations at both onshore and offshore locations is resulting in upsurged waste generation, which is fueling the need for efficient management solutions and propelling the development of the market. A significant trend gaining prominence in the drilling waste management market currently is the implementation of eco-friendly practices in disposing of debris. Stakeholders are focusing on minimizing the usage of harsh chemicals and opting for biodegradable additives to reduce the harmful impact of mud & sludge generated during drilling.
However, adequate disposal of drilling waste requires a high capital investment, which acts as a barrier for several small-scale companies and hampers the growth of the market. Moreover, lack of availability of sufficient space at drilling locations restrains the development of the market as onsite waste management requires significant infrastructure. On the contrary, the assimilation of waste management solutions with recycling & reuse programs is presenting remunerative opportunities for the drilling waste management market. According to a case study by FasterCapital-a global venture builder and online incubator-this assimilation eliminates the need for fresh drilling and reduces waste generation by 70%. Therefore, the integration of novel techniques and solutions into the waste management process is poised to open new avenues for the drilling waste management market.
Segment Review
The drilling waste management market is segmented into service type, application, and region. On the basis of service type, the market is divided into treatment & disposal, containment & handling, solids control. Depending on application, it is bifurcated into onshore and offshore. Region wise, it is analyzed across North America, Europe, Asia-Pacific, and LAMEA.
Key Findings
On the basis of service type, the treatment & disposal segment is expected to dominate the market during the forecast period.
Depending on application, the offshore segment is projected to acquire a notable stake in the market from 2024 to 2033.
Region wise, Asia-Pacific is anticipated to be the highest revenue generator by 2033.
Competition Analysis
The leading players operating in the global drilling waste management market include SLB, Halliburton, Baker Hughes Company, Weatherford, NOV, SECURE ENERGY, GN Solids Control, TWMA, Scomi Group Bhd, and Clear Environmental Solutions. These major players have adopted various key development strategies such as business expansion, new product launches, and partnerships to strengthen their foothold in the competitive market.
Additional benefits you will get with this purchase are:
- Quarterly Update and* (only available with a corporate license, on listed price)
- 5 additional Company Profile of client Choice pre- or Post-purchase, as a free update.
- Free Upcoming Version on the Purchase of Five and Enterprise User License.
- 16 analyst hours of support* (post-purchase, if you find additional data requirements upon review of the report, you may receive support amounting to 16 analyst hours to solve questions, and post-sale queries)
- 15% Free Customization* (in case the scope or segment of the report does not match your requirements, 15% is equivalent to 3 working days of free work, applicable once)
- Free data Pack on the Five and Enterprise User License. (Excel version of the report)
- Free Updated report if the report is 6-12 months old or older.
- 24-hour priority response*
- Free Industry updates and white papers.
Possible Customization with this report (with additional cost and timeline, please talk to the sales executive to know more)
- Analysis of raw material in a product (by %)
- Installed Base analysis
- Investment Opportunities
- Upcoming/New Entrant by Regions
- Technology Trend Analysis
- Average Consumer Expenditure
- Market share analysis of players by products/segments
- New Product Development/ Product Matrix of Key Players
- Patient/epidemiology data at country, region, global level
- Additional company profiles with specific to client's interest
- Additional country or region analysis- market size and forecast
- Expanded list for Company Profiles
- Historic market data
- Key player details (including location, contact details, supplier/vendor network etc. in excel format)
- Market share analysis of players at global/region/country level
- SWOT Analysis
Key Market Segments
By Service Type
- Treatment Disposal
- Containment Handling
- Solids Control
By Application
- Onshore
- Offshore
By Region
- North America
- U.S.
- Canada
- Mexico
- Europe
- France
- Germany
- Italy
- Spain
- UK
- Rest of Europe
- Asia-Pacific
- China
- Japan
- India
- South Korea
- Australia
- Rest of Asia-Pacific
- LAMEA
- Brazil
- South Africa
- Saudi Arabia
- Rest of LAMEA
Key Market Players:
- SLB
- Halliburton
- Baker Hughes Company
- Weatherford
- NOV
- SECURE ENERGY
- GN Solids Control
- TWMA
- Scomi Group Bhd
- Clear Environmental Solutions
TABLE OF CONTENTS
CHAPTER 1: INTRODUCTION
- 1.1. Report Description
- 1.2. Key Market Segments
- 1.3. Key Benefits
- 1.4. Research Methodology
- 1.4.1. Primary Research
- 1.4.2. Secondary Research
- 1.4.3. Analyst Tools and Models
CHAPTER 2: EXECUTIVE SUMMARY
- 2.1. CXO Perspective
CHAPTER 3: MARKET LANDSCAPE
- 3.1. Market Definition and Scope
- 3.2. Key Findings
- 3.2.1. Top Investment Pockets
- 3.2.2. Top Winning Strategies
- 3.3. Porter's Five Forces Analysis
- 3.3.1. Bargaining Power of Suppliers
- 3.3.2. Threat of New Entrants
- 3.3.3. Threat of Substitutes
- 3.3.4. Competitive Rivalry
- 3.3.5. Bargaining Power among Buyers
- 3.4. Market Dynamics
- 3.4.1. Drivers
- 3.4.2. Restraints
- 3.4.3. Opportunities
CHAPTER 4: DRILLING WASTE MANAGEMENT MARKET, BY SERVICE TYPE
- 4.1. Market Overview
- 4.1.1 Market Size and Forecast, By Service Type
- 4.2. Treatment Disposal
- 4.2.1. Key Market Trends, Growth Factors and Opportunities
- 4.2.2. Market Size and Forecast, By Region
- 4.2.3. Market Share Analysis, By Country
- 4.3. Containment Handling
- 4.3.1. Key Market Trends, Growth Factors and Opportunities
- 4.3.2. Market Size and Forecast, By Region
- 4.3.3. Market Share Analysis, By Country
- 4.4. Solids Control
- 4.4.1. Key Market Trends, Growth Factors and Opportunities
- 4.4.2. Market Size and Forecast, By Region
- 4.4.3. Market Share Analysis, By Country
CHAPTER 5: DRILLING WASTE MANAGEMENT MARKET, BY APPLICATION
- 5.1. Market Overview
- 5.1.1 Market Size and Forecast, By Application
- 5.2. Onshore
- 5.2.1. Key Market Trends, Growth Factors and Opportunities
- 5.2.2. Market Size and Forecast, By Region
- 5.2.3. Market Share Analysis, By Country
- 5.3. Offshore
- 5.3.1. Key Market Trends, Growth Factors and Opportunities
- 5.3.2. Market Size and Forecast, By Region
- 5.3.3. Market Share Analysis, By Country
CHAPTER 6: DRILLING WASTE MANAGEMENT MARKET, BY REGION
- 6.1. Market Overview
- 6.1.1 Market Size and Forecast, By Region
- 6.2. North America
- 6.2.1. Key Market Trends and Opportunities
- 6.2.2. Market Size and Forecast, By Service Type
- 6.2.3. Market Size and Forecast, By Application
- 6.2.4. Market Size and Forecast, By Country
- 6.2.5. U.S. Drilling Waste Management Market
- 6.2.5.1. Market Size and Forecast, By Service Type
- 6.2.5.2. Market Size and Forecast, By Application
- 6.2.6. Canada Drilling Waste Management Market
- 6.2.6.1. Market Size and Forecast, By Service Type
- 6.2.6.2. Market Size and Forecast, By Application
- 6.2.7. Mexico Drilling Waste Management Market
- 6.2.7.1. Market Size and Forecast, By Service Type
- 6.2.7.2. Market Size and Forecast, By Application
- 6.3. Europe
- 6.3.1. Key Market Trends and Opportunities
- 6.3.2. Market Size and Forecast, By Service Type
- 6.3.3. Market Size and Forecast, By Application
- 6.3.4. Market Size and Forecast, By Country
- 6.3.5. France Drilling Waste Management Market
- 6.3.5.1. Market Size and Forecast, By Service Type
- 6.3.5.2. Market Size and Forecast, By Application
- 6.3.6. Germany Drilling Waste Management Market
- 6.3.6.1. Market Size and Forecast, By Service Type
- 6.3.6.2. Market Size and Forecast, By Application
- 6.3.7. Italy Drilling Waste Management Market
- 6.3.7.1. Market Size and Forecast, By Service Type
- 6.3.7.2. Market Size and Forecast, By Application
- 6.3.8. Spain Drilling Waste Management Market
- 6.3.8.1. Market Size and Forecast, By Service Type
- 6.3.8.2. Market Size and Forecast, By Application
- 6.3.9. UK Drilling Waste Management Market
- 6.3.9.1. Market Size and Forecast, By Service Type
- 6.3.9.2. Market Size and Forecast, By Application
- 6.3.10. Rest Of Europe Drilling Waste Management Market
- 6.3.10.1. Market Size and Forecast, By Service Type
- 6.3.10.2. Market Size and Forecast, By Application
- 6.4. Asia-Pacific
- 6.4.1. Key Market Trends and Opportunities
- 6.4.2. Market Size and Forecast, By Service Type
- 6.4.3. Market Size and Forecast, By Application
- 6.4.4. Market Size and Forecast, By Country
- 6.4.5. China Drilling Waste Management Market
- 6.4.5.1. Market Size and Forecast, By Service Type
- 6.4.5.2. Market Size and Forecast, By Application
- 6.4.6. Japan Drilling Waste Management Market
- 6.4.6.1. Market Size and Forecast, By Service Type
- 6.4.6.2. Market Size and Forecast, By Application
- 6.4.7. India Drilling Waste Management Market
- 6.4.7.1. Market Size and Forecast, By Service Type
- 6.4.7.2. Market Size and Forecast, By Application
- 6.4.8. South Korea Drilling Waste Management Market
- 6.4.8.1. Market Size and Forecast, By Service Type
- 6.4.8.2. Market Size and Forecast, By Application
- 6.4.9. Australia Drilling Waste Management Market
- 6.4.9.1. Market Size and Forecast, By Service Type
- 6.4.9.2. Market Size and Forecast, By Application
- 6.4.10. Rest of Asia-Pacific Drilling Waste Management Market
- 6.4.10.1. Market Size and Forecast, By Service Type
- 6.4.10.2. Market Size and Forecast, By Application
- 6.5. LAMEA
- 6.5.1. Key Market Trends and Opportunities
- 6.5.2. Market Size and Forecast, By Service Type
- 6.5.3. Market Size and Forecast, By Application
- 6.5.4. Market Size and Forecast, By Country
- 6.5.5. Brazil Drilling Waste Management Market
- 6.5.5.1. Market Size and Forecast, By Service Type
- 6.5.5.2. Market Size and Forecast, By Application
- 6.5.6. South Africa Drilling Waste Management Market
- 6.5.6.1. Market Size and Forecast, By Service Type
- 6.5.6.2. Market Size and Forecast, By Application
- 6.5.7. Saudi Arabia Drilling Waste Management Market
- 6.5.7.1. Market Size and Forecast, By Service Type
- 6.5.7.2. Market Size and Forecast, By Application
- 6.5.8. Rest of LAMEA Drilling Waste Management Market
- 6.5.8.1. Market Size and Forecast, By Service Type
- 6.5.8.2. Market Size and Forecast, By Application
CHAPTER 7: COMPETITIVE LANDSCAPE
- 7.1. Introduction
- 7.2. Top Winning Strategies
- 7.3. Product Mapping Of Top 10 Player
- 7.4. Competitive Dashboard
- 7.5. Competitive Heatmap
- 7.6. Top Player Positioning, 2023
CHAPTER 8: COMPANY PROFILES
- 8.1. SLB
- 8.1.1. Company Overview
- 8.1.2. Key Executives
- 8.1.3. Company Snapshot
- 8.1.4. Operating Business Segments
- 8.1.5. Product Portfolio
- 8.1.6. Business Performance
- 8.1.7. Key Strategic Moves and Developments
- 8.2. Halliburton
- 8.2.1. Company Overview
- 8.2.2. Key Executives
- 8.2.3. Company Snapshot
- 8.2.4. Operating Business Segments
- 8.2.5. Product Portfolio
- 8.2.6. Business Performance
- 8.2.7. Key Strategic Moves and Developments
- 8.3. Baker Hughes Company
- 8.3.1. Company Overview
- 8.3.2. Key Executives
- 8.3.3. Company Snapshot
- 8.3.4. Operating Business Segments
- 8.3.5. Product Portfolio
- 8.3.6. Business Performance
- 8.3.7. Key Strategic Moves and Developments
- 8.4. Weatherford
- 8.4.1. Company Overview
- 8.4.2. Key Executives
- 8.4.3. Company Snapshot
- 8.4.4. Operating Business Segments
- 8.4.5. Product Portfolio
- 8.4.6. Business Performance
- 8.4.7. Key Strategic Moves and Developments
- 8.5. NOV
- 8.5.1. Company Overview
- 8.5.2. Key Executives
- 8.5.3. Company Snapshot
- 8.5.4. Operating Business Segments
- 8.5.5. Product Portfolio
- 8.5.6. Business Performance
- 8.5.7. Key Strategic Moves and Developments
- 8.6. SECURE ENERGY
- 8.6.1. Company Overview
- 8.6.2. Key Executives
- 8.6.3. Company Snapshot
- 8.6.4. Operating Business Segments
- 8.6.5. Product Portfolio
- 8.6.6. Business Performance
- 8.6.7. Key Strategic Moves and Developments
- 8.7. GN Solids Control
- 8.7.1. Company Overview
- 8.7.2. Key Executives
- 8.7.3. Company Snapshot
- 8.7.4. Operating Business Segments
- 8.7.5. Product Portfolio
- 8.7.6. Business Performance
- 8.7.7. Key Strategic Moves and Developments
- 8.8. TWMA
- 8.8.1. Company Overview
- 8.8.2. Key Executives
- 8.8.3. Company Snapshot
- 8.8.4. Operating Business Segments
- 8.8.5. Product Portfolio
- 8.8.6. Business Performance
- 8.8.7. Key Strategic Moves and Developments
- 8.9. Scomi Group Bhd
- 8.9.1. Company Overview
- 8.9.2. Key Executives
- 8.9.3. Company Snapshot
- 8.9.4. Operating Business Segments
- 8.9.5. Product Portfolio
- 8.9.6. Business Performance
- 8.9.7. Key Strategic Moves and Developments
- 8.10. Clear Environmental Solutions
- 8.10.1. Company Overview
- 8.10.2. Key Executives
- 8.10.3. Company Snapshot
- 8.10.4. Operating Business Segments
- 8.10.5. Product Portfolio
- 8.10.6. Business Performance
- 8.10.7. Key Strategic Moves and Developments

