
PUBLISHER: Allied Market Research | PRODUCT CODE: 1641784

PUBLISHER: Allied Market Research | PRODUCT CODE: 1641784
U.S. Fast Casual Restaurant Market By Food Type , By Mode of Operation By Nature : Opportunity Analysis and Industry Forecast, 2023-2032
U.S. Fast Casual Restaurant Market
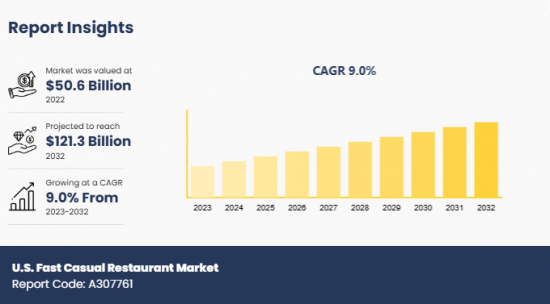
The U.S. fast casual restaurant market was valued at $50.6 billion in 2022 and is projected to reach $121.3 billion by 2032, growing at a CAGR of 9% from 2023 to 2032.
A fast casual restaurant combines the convenience of quick-service food with the quality and experience of casual dining. The key highlights of fast casual restaurants include instant service, use of fresh ingredients, and customizable menu options. In addition, these restaurants gain advantages over other dining establishments owing to their broad demographic appeal and market adaptability.
Increase in demand for quick, good-quality meals among individuals that aligns with their busy lifestyles has been a key driver of the U.S. fast casual restaurant market. In addition, the availability of multiple options and customizations on the basis of dietary requirements of individuals has enhanced their preference for fast casual restaurants, which has augmented the development of the market. Shift toward sustainability is becoming a prominent trend among fast causal restaurants in the U.S. as several restaurants are making local ingredient sourcing, waste reduction, and use of eco-friendly utensils & cutlery as their key highlights to garner a large base of customers. Furthermore, to align with the sustainability trend, restaurant owners are focusing on transparency by sharing stories of their workflow and supply chains with their diners.
However, increase in industry saturation and competition owing to the advent of multiple food service segments such as fast-food chains, cloud kitchens, and meal kit providers is hampering the development of the U.S. fast casual restaurant market. Moreover, rise in the prices of raw materials and ingredients in the U.S. impacts the profitability of fast casual restaurant owners, thereby restraining the market growth notably. According to CNN Business-a financial news website-grocery prices in the U.S. in 2024 were up by 27% in comparison to February 2020. Furthermore, the latest Consumer Price Index report states that grocery prices in November 2024 were 1.6% higher in the U.S. as compared to November 2023. On the contrary, several fast casual restaurant owners are focusing on expanding their delivery services and establishing ghost kitchens, which is anticipated to present remunerative opportunities for market growth.
Segment Review
The U.S. fast casual restaurant market is segmented into food type, mode of operation, and nature. On the basis of food type, the market is divided into burger/sandwich, pizza/pasta, Asian/Latin American food, chicken, and others. According to mode of operation, it is bifurcated into dine-in and takeaway. By nature, it is classified into franchised and standalone.
Key Findings
On the basis of food type, the burger/sandwich segment held the highest market share in 2023.
According to mode of operation, the dine-in segment dominated the market in 2023.
By nature, the franchised segment was the highest shareholder in 2023.
Competition Analysis
The major players in the U.S. fast casual restaurant market include Chipotle Mexican Grill, Panera Bread, Shake Shack, Blaze Pizza, MOD Pizza, Sweetgreen, Noodles & Company, Five Guys, Qdoba Mexican Eats, and Zoe's Kitchen. These major players have adopted various key development strategies such as business expansion, new product launches, and partnerships to strengthen their foothold in the competitive market.
Additional benefits you will get with this purchase are:
- Quarterly Update and* (only available with a corporate license, on listed price)
- 5 additional Company Profile of client Choice pre- or Post-purchase, as a free update.
- Free Upcoming Version on the Purchase of Five and Enterprise User License.
- 16 analyst hours of support* (post-purchase, if you find additional data requirements upon review of the report, you may receive support amounting to 16 analyst hours to solve questions, and post-sale queries)
- 15% Free Customization* (in case the scope or segment of the report does not match your requirements, 15% is equivalent to 3 working days of free work, applicable once)
- Free data Pack on the Five and Enterprise User License. (Excel version of the report)
- Free Updated report if the report is 6-12 months old or older.
- 24-hour priority response*
- Free Industry updates and white papers.
Possible Customization with this report (with additional cost and timeline, please talk to the sales executive to know more)
- Regulatory Guidelines
- Additional company profiles with specific to client's interest
- Additional country or region analysis- market size and forecast
- Average Selling Price Analysis / Price Point Analysis
- Brands Share Analysis
- Criss-cross segment analysis- market size and forecast
- Expanded list for Company Profiles
- Historic market data
- Import Export Analysis/Data
- Key player details (including location, contact details, supplier/vendor network etc. in excel format)
- List of customers/consumers/raw material suppliers- value chain analysis
- Market share analysis of players at global/region/country level
- Per Capita Consumption Trends
- Product Consumption Analysis
- Reimbursement Scenario
- SWOT Analysis
- Volume Market Size and Forecast
Key Market Segments
By Food Type
- Burger/Sandwich
- Pizza/Pasta
- Asian/Latin American Food
- Chicken
- Others
By Mode Of Operation
- Dine-in
- Takeaway
By Nature
- Franchised
- Standalone
Key Market Players:
- Chipotle Mexican Grill
- Panera Bread
- Shake Shack
- Blaze Pizza
- MOD Pizza
- Sweetgreen
- Noodles & Company
- Five Guys
- Qdoba Mexican Eats
- Zoe's Kitchen
TABLE OF CONTENTS
CHAPTER 1: INTRODUCTION
- 1.1. Report Description
- 1.2. Key Market Segments
- 1.3. Key Benefits
- 1.4. Research Methodology
- 1.4.1. Primary Research
- 1.4.2. Secondary Research
- 1.4.3. Analyst Tools and Models
CHAPTER 2: EXECUTIVE SUMMARY
- 2.1. CXO Perspective
CHAPTER 3: MARKET LANDSCAPE
- 3.1. Market Definition and Scope
- 3.2. Key Findings
- 3.2.1. Top Investment Pockets
- 3.2.2. Top Winning Strategies
- 3.3. Porter's Five Forces Analysis
- 3.3.1. Bargaining Power of Suppliers
- 3.3.2. Threat of New Entrants
- 3.3.3. Threat of Substitutes
- 3.3.4. Competitive Rivalry
- 3.3.5. Bargaining Power among Buyers
- 3.4. Market Dynamics
- 3.4.1. Drivers
- 3.4.2. Restraints
- 3.4.3. Opportunities
CHAPTER 4: U.S. FAST CASUAL RESTAURANT MARKET, BY FOOD TYPE
- 4.1. Market Overview
- 4.1.1 Market Size and Forecast, By Food Type
- 4.2. Burger/Sandwich
- 4.2.1. Key Market Trends, Growth Factors and Opportunities
- 4.3. Pizza/Pasta
- 4.3.1. Key Market Trends, Growth Factors and Opportunities
- 4.4. Asian/Latin American Food
- 4.4.1. Key Market Trends, Growth Factors and Opportunities
- 4.5. Chicken
- 4.5.1. Key Market Trends, Growth Factors and Opportunities
- 4.6. Others
- 4.6.1. Key Market Trends, Growth Factors and Opportunities
CHAPTER 5: U.S. FAST CASUAL RESTAURANT MARKET, BY MODE OF OPERATION
- 5.1. Market Overview
- 5.1.1 Market Size and Forecast, By Mode Of Operation
- 5.2. Dine-in
- 5.2.1. Key Market Trends, Growth Factors and Opportunities
- 5.3. Takeaway
- 5.3.1. Key Market Trends, Growth Factors and Opportunities
CHAPTER 6: U.S. FAST CASUAL RESTAURANT MARKET, BY NATURE
- 6.1. Market Overview
- 6.1.1 Market Size and Forecast, By Nature
- 6.2. Franchised
- 6.2.1. Key Market Trends, Growth Factors and Opportunities
- 6.3. Standalone
- 6.3.1. Key Market Trends, Growth Factors and Opportunities
CHAPTER 7: COMPETITIVE LANDSCAPE
- 7.1. Introduction
- 7.2. Top Winning Strategies
- 7.3. Product Mapping Of Top 10 Player
- 7.4. Competitive Dashboard
- 7.5. Competitive Heatmap
- 7.6. Top Player Positioning,2022
CHAPTER 8: COMPANY PROFILES
- 8.1. Chipotle Mexican Grill
- 8.1.1. Company Overview
- 8.1.2. Key Executives
- 8.1.3. Company Snapshot
- 8.1.4. Operating Business Segments
- 8.1.5. Product Portfolio
- 8.1.6. Business Performance
- 8.1.7. Key Strategic Moves and Developments
- 8.2. Panera Bread
- 8.2.1. Company Overview
- 8.2.2. Key Executives
- 8.2.3. Company Snapshot
- 8.2.4. Operating Business Segments
- 8.2.5. Product Portfolio
- 8.2.6. Business Performance
- 8.2.7. Key Strategic Moves and Developments
- 8.3. Shake Shack
- 8.3.1. Company Overview
- 8.3.2. Key Executives
- 8.3.3. Company Snapshot
- 8.3.4. Operating Business Segments
- 8.3.5. Product Portfolio
- 8.3.6. Business Performance
- 8.3.7. Key Strategic Moves and Developments
- 8.4. Blaze Pizza
- 8.4.1. Company Overview
- 8.4.2. Key Executives
- 8.4.3. Company Snapshot
- 8.4.4. Operating Business Segments
- 8.4.5. Product Portfolio
- 8.4.6. Business Performance
- 8.4.7. Key Strategic Moves and Developments
- 8.5. MOD Pizza
- 8.5.1. Company Overview
- 8.5.2. Key Executives
- 8.5.3. Company Snapshot
- 8.5.4. Operating Business Segments
- 8.5.5. Product Portfolio
- 8.5.6. Business Performance
- 8.5.7. Key Strategic Moves and Developments
- 8.6. Sweetgreen
- 8.6.1. Company Overview
- 8.6.2. Key Executives
- 8.6.3. Company Snapshot
- 8.6.4. Operating Business Segments
- 8.6.5. Product Portfolio
- 8.6.6. Business Performance
- 8.6.7. Key Strategic Moves and Developments
- 8.7. Noodles And Company
- 8.7.1. Company Overview
- 8.7.2. Key Executives
- 8.7.3. Company Snapshot
- 8.7.4. Operating Business Segments
- 8.7.5. Product Portfolio
- 8.7.6. Business Performance
- 8.7.7. Key Strategic Moves and Developments
- 8.8. Five Guys
- 8.8.1. Company Overview
- 8.8.2. Key Executives
- 8.8.3. Company Snapshot
- 8.8.4. Operating Business Segments
- 8.8.5. Product Portfolio
- 8.8.6. Business Performance
- 8.8.7. Key Strategic Moves and Developments
- 8.9. Qdoba Mexican Eats
- 8.9.1. Company Overview
- 8.9.2. Key Executives
- 8.9.3. Company Snapshot
- 8.9.4. Operating Business Segments
- 8.9.5. Product Portfolio
- 8.9.6. Business Performance
- 8.9.7. Key Strategic Moves and Developments
- 8.10. Zoe's Kitchen
- 8.10.1. Company Overview
- 8.10.2. Key Executives
- 8.10.3. Company Snapshot
- 8.10.4. Operating Business Segments
- 8.10.5. Product Portfolio
- 8.10.6. Business Performance
- 8.10.7. Key Strategic Moves and Developments
- TABLE 1. U.S. FAST CASUAL RESTAURANT MARKET, BY FOOD TYPE, 2023 - 2032 ($BILLION)
- TABLE 2. U.S. FAST CASUAL RESTAURANT MARKET, BY MODE OF OPERATION, 2023 - 2032 ($BILLION)
- TABLE 3. U.S. FAST CASUAL RESTAURANT MARKET, BY NATURE, 2023 - 2032 ($BILLION)
- TABLE 4. CHIPOTLE MEXICAN GRILL: KEY EXECUTIVES
- TABLE 5. CHIPOTLE MEXICAN GRILL: COMPANY SNAPSHOT
- TABLE 6. CHIPOTLE MEXICAN GRILL: OPERATING SEGMENTS
- TABLE 7. CHIPOTLE MEXICAN GRILL: PRODUCT PORTFOLIO
- TABLE 8. CHIPOTLE MEXICAN GRILL: KEY STRATEGIC MOVES AND DEVELOPMENTS
- TABLE 9. PANERA BREAD: KEY EXECUTIVES
- TABLE 10. PANERA BREAD: COMPANY SNAPSHOT
- TABLE 11. PANERA BREAD: OPERATING SEGMENTS
- TABLE 12. PANERA BREAD: PRODUCT PORTFOLIO
- TABLE 13. PANERA BREAD: KEY STRATEGIC MOVES AND DEVELOPMENTS
- TABLE 14. SHAKE SHACK: KEY EXECUTIVES
- TABLE 15. SHAKE SHACK: COMPANY SNAPSHOT
- TABLE 16. SHAKE SHACK: OPERATING SEGMENTS
- TABLE 17. SHAKE SHACK: PRODUCT PORTFOLIO
- TABLE 18. SHAKE SHACK: KEY STRATEGIC MOVES AND DEVELOPMENTS
- TABLE 19. BLAZE PIZZA: KEY EXECUTIVES
- TABLE 20. BLAZE PIZZA: COMPANY SNAPSHOT
- TABLE 21. BLAZE PIZZA: OPERATING SEGMENTS
- TABLE 22. BLAZE PIZZA: PRODUCT PORTFOLIO
- TABLE 23. BLAZE PIZZA: KEY STRATEGIC MOVES AND DEVELOPMENTS
- TABLE 24. MOD PIZZA: KEY EXECUTIVES
- TABLE 25. MOD PIZZA: COMPANY SNAPSHOT
- TABLE 26. MOD PIZZA: OPERATING SEGMENTS
- TABLE 27. MOD PIZZA: PRODUCT PORTFOLIO
- TABLE 28. MOD PIZZA: KEY STRATEGIC MOVES AND DEVELOPMENTS
- TABLE 29. SWEETGREEN: KEY EXECUTIVES
- TABLE 30. SWEETGREEN: COMPANY SNAPSHOT
- TABLE 31. SWEETGREEN: OPERATING SEGMENTS
- TABLE 32. SWEETGREEN: PRODUCT PORTFOLIO
- TABLE 33. SWEETGREEN: KEY STRATEGIC MOVES AND DEVELOPMENTS
- TABLE 34. NOODLES AND COMPANY: KEY EXECUTIVES
- TABLE 35. NOODLES AND COMPANY: COMPANY SNAPSHOT
- TABLE 36. NOODLES AND COMPANY: OPERATING SEGMENTS
- TABLE 37. NOODLES AND COMPANY: PRODUCT PORTFOLIO
- TABLE 38. NOODLES AND COMPANY: KEY STRATEGIC MOVES AND DEVELOPMENTS
- TABLE 39. FIVE GUYS: KEY EXECUTIVES
- TABLE 40. FIVE GUYS: COMPANY SNAPSHOT
- TABLE 41. FIVE GUYS: OPERATING SEGMENTS
- TABLE 42. FIVE GUYS: PRODUCT PORTFOLIO
- TABLE 43. FIVE GUYS: KEY STRATEGIC MOVES AND DEVELOPMENTS
- TABLE 44. QDOBA MEXICAN EATS: KEY EXECUTIVES
- TABLE 45. QDOBA MEXICAN EATS: COMPANY SNAPSHOT
- TABLE 46. QDOBA MEXICAN EATS: OPERATING SEGMENTS
- TABLE 47. QDOBA MEXICAN EATS: PRODUCT PORTFOLIO
- TABLE 48. QDOBA MEXICAN EATS: KEY STRATEGIC MOVES AND DEVELOPMENTS
- TABLE 49. ZOE'S KITCHEN: KEY EXECUTIVES
- TABLE 50. ZOE'S KITCHEN: COMPANY SNAPSHOT
- TABLE 51. ZOE'S KITCHEN: OPERATING SEGMENTS
- TABLE 52. ZOE'S KITCHEN: PRODUCT PORTFOLIO
- TABLE 53. ZOE'S KITCHEN: KEY STRATEGIC MOVES AND DEVELOPMENTS
- FIGURE 1. U.S. FAST CASUAL RESTAURANT MARKET,2023 - 2032
- FIGURE 2. SEGMENTATION OF U.S. FAST CASUAL RESTAURANT MARKET,2023 - 2032
- FIGURE 3. TOP INVESTMENT POCKET IN U.S. FAST CASUAL RESTAURANT MARKET,2023 - 2032
- FIGURE 4. MODERATE BARGAINING POWER OF BUYERS
- FIGURE 5. MODERATE BARGAINING POWER OF SUPPLIERS
- FIGURE 6. MODERATE THREAT OF NEW ENTRANTS
- FIGURE 7. LOW THREAT OF SUBSTITUTION
- FIGURE 8. HIGH COMPETITIVE RIVALRY
- FIGURE 9. OPPORTUNITIES, RESTRAINTS AND DRIVERS: U.S. FAST CASUAL RESTAURANT MARKET
- FIGURE 10. U.S. FAST CASUAL RESTAURANT MARKET , BY FOOD TYPE,2023 - 2032 ($BILLION)
- FIGURE 11. U.S. FAST CASUAL RESTAURANT MARKET , BY MODE OF OPERATION,2023 - 2032 ($BILLION)
- FIGURE 12. U.S. FAST CASUAL RESTAURANT MARKET , BY NATURE,2023 - 2032 ($BILLION)
- FIGURE 13. TOP WINNING STRATEGIES, BY YEAR, 2021-2023*
- FIGURE 14. TOP WINNING STRATEGIES, BY DEVELOPMENT, 2021-2023*
- FIGURE 15. TOP WINNING STRATEGIES, BY COMPANY, 2021-2023*
- FIGURE 16. PRODUCT MAPPING OF TOP 10 PLAYERS
- FIGURE 17. COMPETITIVE DASHBOARD
- FIGURE 18. COMPETITIVE HEATMAP: U.S. FAST CASUAL RESTAURANT MARKET
- FIGURE 19. TOP PLAYER POSITIONING,2022
- FIGURE 20. CHIPOTLE MEXICAN GRILL: NET SALES, 2021-2023 ($BILLION)
- FIGURE 21. CHIPOTLE MEXICAN GRILL: REVENUE SHARE, BY SEGMENT, 2022 (%)
- FIGURE 22. CHIPOTLE MEXICAN GRILL: REVENUE SHARE, BY REGION, 2023 (%)
- FIGURE 23. PANERA BREAD: NET SALES, 2021-2023 ($BILLION)
- FIGURE 24. PANERA BREAD: REVENUE SHARE, BY SEGMENT, 2022 (%)
- FIGURE 25. PANERA BREAD: REVENUE SHARE, BY REGION, 2023 (%)
- FIGURE 26. SHAKE SHACK: NET SALES, 2021-2023 ($BILLION)
- FIGURE 27. SHAKE SHACK: REVENUE SHARE, BY SEGMENT, 2022 (%)
- FIGURE 28. SHAKE SHACK: REVENUE SHARE, BY REGION, 2023 (%)
- FIGURE 29. BLAZE PIZZA: NET SALES, 2021-2023 ($BILLION)
- FIGURE 30. BLAZE PIZZA: REVENUE SHARE, BY SEGMENT, 2022 (%)
- FIGURE 31. BLAZE PIZZA: REVENUE SHARE, BY REGION, 2023 (%)
- FIGURE 32. MOD PIZZA: NET SALES, 2021-2023 ($BILLION)
- FIGURE 33. MOD PIZZA: REVENUE SHARE, BY SEGMENT, 2022 (%)
- FIGURE 34. MOD PIZZA: REVENUE SHARE, BY REGION, 2023 (%)
- FIGURE 35. SWEETGREEN: NET SALES, 2021-2023 ($BILLION)
- FIGURE 36. SWEETGREEN: REVENUE SHARE, BY SEGMENT, 2022 (%)
- FIGURE 37. SWEETGREEN: REVENUE SHARE, BY REGION, 2023 (%)
- FIGURE 38. NOODLES AND COMPANY: NET SALES, 2021-2023 ($BILLION)
- FIGURE 39. NOODLES AND COMPANY: REVENUE SHARE, BY SEGMENT, 2022 (%)
- FIGURE 40. NOODLES AND COMPANY: REVENUE SHARE, BY REGION, 2023 (%)
- FIGURE 41. FIVE GUYS: NET SALES, 2021-2023 ($BILLION)
- FIGURE 42. FIVE GUYS: REVENUE SHARE, BY SEGMENT, 2022 (%)
- FIGURE 43. FIVE GUYS: REVENUE SHARE, BY REGION, 2023 (%)
- FIGURE 44. QDOBA MEXICAN EATS: NET SALES, 2021-2023 ($BILLION)
- FIGURE 45. QDOBA MEXICAN EATS: REVENUE SHARE, BY SEGMENT, 2022 (%)
- FIGURE 46. QDOBA MEXICAN EATS: REVENUE SHARE, BY REGION, 2023 (%)
- FIGURE 47. ZOE'S KITCHEN: NET SALES, 2021-2023 ($BILLION)
- FIGURE 48. ZOE'S KITCHEN: REVENUE SHARE, BY SEGMENT, 2022 (%)
- FIGURE 49. ZOE'S KITCHEN: REVENUE SHARE, BY REGION, 2023 (%)

