
PUBLISHER: Allied Market Research | PRODUCT CODE: 1641770

PUBLISHER: Allied Market Research | PRODUCT CODE: 1641770
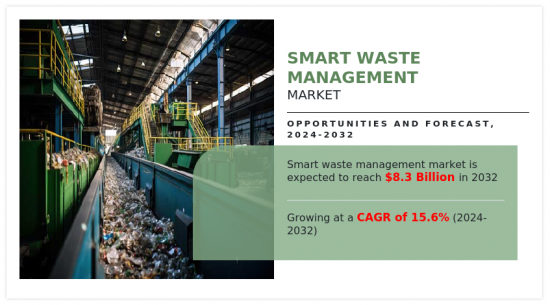
Smart Waste Management Market By Waste Type, By Method, By Source, By Product : Global Opportunity Analysis and Industry Forecast, 2024-2032
The smart waste management market was valued at $2.2 billion in 2023 and is estimated to reach $8.3 billion by 2032, exhibiting a CAGR of 15.6% from 2024 to 2032.
The smart waste management market involves leveraging digital technologies such as IoT sensors, AI-driven analytics, and automation to enhance waste collection, processing, and recycling. It focuses on optimizing routes, monitoring waste levels in real-time, and improving resource efficiency, leading to reduced environmental footprints. This market drives the shift toward sustainable waste practices by enabling smarter decision-making and fostering a more efficient, data-driven approach to waste management and resource recovery.
The smart waste management market is fueled by the growing need for efficient and sustainable waste management solutions in urban areas. As cities expand and populations increase, traditional waste management methods struggle to keep up with rising waste volumes. This drives the adoption of smart technologies such as IoT sensors and data analytics, which offer real-time monitoring and optimized waste collection routes, thus reducing operational costs and minimizing environmental impact.
The rising construction activities and investment in construction globally are a significant driver for the smart waste management market. For instance, according to the European Construction Industry Federation, in Germany, in 2023, the total investment in construction was around $338,000 million out of which around $289,511 million were invested in building construction, which includes householding as well as non-residential buildings. As construction projects expand, they generate substantial amounts of waste, including debris, packaging materials, and demolition remnants. Managing this waste efficiently is crucial for maintaining environmental sustainability and complying with regulations. Smart waste management systems address these needs by optimizing waste collection and sorting processes, thereby reducing landfill use and promoting recycling.
Advanced technologies such as IoT sensors and data analytics are particularly valuable in the construction sector. IoT-enabled bins can monitor waste levels in real-time, ensuring timely collection and minimizing overflows on construction sites. Data analytics can provide insights into waste generation patterns, helping construction companies implement better waste management practices and improve resource efficiency.
Furthermore, many construction projects are part of larger urban development initiatives, which often emphasize sustainability. Integrating smart waste management solutions aligns with these sustainability goals, making them an attractive option for developers aiming to meet environmental targets and regulatory requirements. As global construction continues to rise, the demand for effective waste management solutions is expected to drive further adoption of smart waste technologies.
However, the market faces challenges, particularly in the form of high initial investments and the complexity of integrating advanced technologies into existing waste management infrastructures. Smaller municipalities and developing regions may find it difficult to allocate the necessary funds and expertise, which can slow down the adoption of smart waste management solutions.
Despite these challenges, the market presents significant opportunities, especially with the increasing focus on sustainability and circular economy practices. Governments and private sectors are investing in innovative waste management technologies to meet stringent environmental regulations and enhance resource recovery. This opens avenues for smart waste management solutions to become a key element in achieving long-term environmental goals.
Advancements in waste-to-energy technologies offer substantial opportunities for the smart waste management market by enhancing the synergy between waste management and energy recovery. As technology evolves, new methods for converting waste into energy-such as anaerobic digestion, gasification, and pyrolysis-are becoming more efficient and economically viable. Integrating these technologies with smart waste management systems can significantly optimize the waste-to-energy process.
Smart waste management systems equipped with IoT sensors and data analytics can monitor and manage the quality and quantity of waste being processed for energy production. By providing real-time data on waste composition and volume, these systems enable more precise control over the feedstock, improving the efficiency of energy conversion processes. This data-driven approach helps in adjusting operational parameters, such as temperature and pressure, to maximize energy output and reduce waste treatment costs.
Moreover, the integration of smart systems can enhance the environmental benefits of waste-to-energy projects. Efficient waste sorting and processing reduces the amount of waste sent to landfills and lowers greenhouse gas emissions, aligning with broader sustainability goals. As waste-to-energy technologies advance, their integration with smart waste management systems can drive further adoption, create economic value, and contribute to more sustainable waste management practices.
The smart waste management market is segmented on the basis of waste type, method, source, product, and region. By waste type, the smart waste management market is segmented into solid waste, special waste, and e-waste. By method, the smart waste management market is segmented into smart collection, smart processing, and smart disposal. By source, the market is segmented into residential, commercial, and industrial. By product, the market is segmented into hardware, and software. Region-wise, the smart waste management trends are analyzed across North America (the U.S., Canada, and Mexico), Europe (UK, Germany, France, Spain, Italy, Netherlands, Belgium, Poland, and rest of Europe), Asia Pacific (China, Japan, India, South Korea, and Rest of Asia-Pacific), and LAMEA (Latin America, the Middle East, and Africa).
The key players profiled in the report include Ecube Labs Co. Ltd., Veolia Environnement S.A., Waste Management Inc., Bigbelly, Inc., Bine Sp. z o.o., SAP SE, SUEZ Environmental Services, Sensoneo j. s. a., Rubicon Technologies, Inc., and Enevo, Inc.
Key Benefits For Stakeholders
- This report provides a quantitative analysis of the market segments, current trends, estimations, and dynamics of the smart waste management market analysis from 2023 to 2032 to identify the prevailing smart waste management market opportunities.
- The market research is offered along with information related to key drivers, restraints, and opportunities.
- Porter's five forces analysis highlights the potency of buyers and suppliers to enable stakeholders make profit-oriented business decisions and strengthen their supplier-buyer network.
- In-depth analysis of the smart waste management market segmentation assists to determine the prevailing market opportunities.
- Major countries in each region are mapped according to their revenue contribution to the global market.
- Market player positioning facilitates benchmarking and provides a clear understanding of the present position of the market players.
- The report includes the analysis of the regional as well as global smart waste management market trends, key players, market segments, application areas, and market growth strategies.
Additional benefits you will get with this purchase are:
- Quarterly Update and* (only available with a corporate license, on listed price)
- 5 additional Company Profile of client Choice pre- or Post-purchase, as a free update.
- Free Upcoming Version on the Purchase of Five and Enterprise User License.
- 16 analyst hours of support* (post-purchase, if you find additional data requirements upon review of the report, you may receive support amounting to 16 analyst hours to solve questions, and post-sale queries)
- 15% Free Customization* (in case the scope or segment of the report does not match your requirements, 15% is equivalent to 3 working days of free work, applicable once)
- Free data Pack on the Five and Enterprise User License. (Excel version of the report)
- Free Updated report if the report is 6-12 months old or older.
- 24-hour priority response*
- Free Industry updates and white papers.
Possible Customization with this report (with additional cost and timeline, please talk to the sales executive to know more)
- Investment Opportunities
- Supply Chain Analysis & Vendor Margins
- Upcoming/New Entrant by Regions
- Go To Market Strategy
- New Product Development/ Product Matrix of Key Players
- Additional company profiles with specific to client's interest
- Additional country or region analysis- market size and forecast
- Average Selling Price Analysis / Price Point Analysis
- Brands Share Analysis
- Criss-cross segment analysis- market size and forecast
- Expanded list for Company Profiles
- Historic market data
- Import Export Analysis/Data
- Key player details (including location, contact details, supplier/vendor network etc. in excel format)
- List of customers/consumers/raw material suppliers- value chain analysis
- Market share analysis of players at global/region/country level
- SWOT Analysis
- Volume Market Size and Forecast
Key Market Segments
By Waste Type
- Solid Waste
- Special Waste
- E-Waste
By Method
- Smart Collection
- Smart Processing
- Smart Disposal
By Source
- Residential
- Commercial
- Industrial
By Product
- Hardware
- Software
By Region
- North America
- U.S.
- Canada
- Mexico
- Europe
- Germany
- France
- UK
- Italy
- Netherlands
- Belgium
- Poland
- Rest of Europe
- Asia-Pacific
- China
- India
- Japan
- South Korea
- Rest of Asia-Pacific
- LAMEA
- Latin America
- Middle East
- Africa
Key Market Players:
- Bigbelly, Inc.
- Bine Sp. z o.o.
- Ecube Labs Co. Ltd.
- Enevo, Inc
- Rubicon Technologies, Inc.
- SAP SE
- Sensoneo j. s. a.
- SUEZ Environmental Services.
- Veolia Environnement S.A.
- Waste Management Inc.
TABLE OF CONTENTS
CHAPTER 1: INTRODUCTION
- 1.1. Report description
- 1.2. Key market segments
- 1.3. Key benefits to the stakeholders
- 1.4. Research methodology
- 1.4.1. Primary research
- 1.4.2. Secondary research
- 1.4.3. Analyst tools and models
CHAPTER 2: EXECUTIVE SUMMARY
- 2.1. CXO perspective
CHAPTER 3: MARKET OVERVIEW
- 3.1. Market definition and scope
- 3.2. Key findings
- 3.2.1. Top impacting factors
- 3.2.2. Top investment pockets
- 3.3. Porter's five forces analysis
- 3.3.1. Low bargaining power of suppliers
- 3.3.2. Low threat of new entrants
- 3.3.3. Low threat of substitutes
- 3.3.4. Low intensity of rivalry
- 3.3.5. Low bargaining power of buyers
- 3.4. Market dynamics
- 3.4.1. Drivers
- 3.4.1.1. Rise in Waste Generation
- 3.4.1.2. Global and Corporate Sustainability Initiatives
- 3.4.1.3. Rise in Construction Projects Globally
- 3.4.2. Restraints
- 3.4.2.1. High Initial Investment Costs
- 3.4.3. Opportunities
- 3.4.3.1. Advancements in Waste-to-Energy Technologies
- 3.4.1. Drivers
CHAPTER 4: SMART WASTE MANAGEMENT MARKET, BY WASTE TYPE
- 4.1. Overview
- 4.1.1. Market size and forecast
- 4.2. Solid Waste
- 4.2.1. Key market trends, growth factors and opportunities
- 4.2.2. Market size and forecast, by region
- 4.2.3. Market share analysis by country
- 4.3. Special Waste
- 4.3.1. Key market trends, growth factors and opportunities
- 4.3.2. Market size and forecast, by region
- 4.3.3. Market share analysis by country
- 4.4. E-Waste
- 4.4.1. Key market trends, growth factors and opportunities
- 4.4.2. Market size and forecast, by region
- 4.4.3. Market share analysis by country
CHAPTER 5: SMART WASTE MANAGEMENT MARKET, BY METHOD
- 5.1. Overview
- 5.1.1. Market size and forecast
- 5.2. Smart Collection
- 5.2.1. Key market trends, growth factors and opportunities
- 5.2.2. Market size and forecast, by region
- 5.2.3. Market share analysis by country
- 5.3. Smart Processing
- 5.3.1. Key market trends, growth factors and opportunities
- 5.3.2. Market size and forecast, by region
- 5.3.3. Market share analysis by country
- 5.4. Smart Disposal
- 5.4.1. Key market trends, growth factors and opportunities
- 5.4.2. Market size and forecast, by region
- 5.4.3. Market share analysis by country
CHAPTER 6: SMART WASTE MANAGEMENT MARKET, BY SOURCE
- 6.1. Overview
- 6.1.1. Market size and forecast
- 6.2. Residential
- 6.2.1. Key market trends, growth factors and opportunities
- 6.2.2. Market size and forecast, by region
- 6.2.3. Market share analysis by country
- 6.3. Commercial
- 6.3.1. Key market trends, growth factors and opportunities
- 6.3.2. Market size and forecast, by region
- 6.3.3. Market share analysis by country
- 6.4. Industrial
- 6.4.1. Key market trends, growth factors and opportunities
- 6.4.2. Market size and forecast, by region
- 6.4.3. Market share analysis by country
CHAPTER 7: SMART WASTE MANAGEMENT MARKET, BY PRODUCT
- 7.1. Overview
- 7.1.1. Market size and forecast
- 7.2. Hardware
- 7.2.1. Key market trends, growth factors and opportunities
- 7.2.2. Market size and forecast, by region
- 7.2.3. Market share analysis by country
- 7.3. Software
- 7.3.1. Key market trends, growth factors and opportunities
- 7.3.2. Market size and forecast, by region
- 7.3.3. Market share analysis by country
CHAPTER 8: SMART WASTE MANAGEMENT MARKET, BY REGION
- 8.1. Overview
- 8.1.1. Market size and forecast By Region
- 8.2. North America
- 8.2.1. Key market trends, growth factors and opportunities
- 8.2.2. Market size and forecast, by Waste Type
- 8.2.3. Market size and forecast, by Method
- 8.2.4. Market size and forecast, by Source
- 8.2.5. Market size and forecast, by Product
- 8.2.6. Market size and forecast, by country
- 8.2.6.1. U.S.
- 8.2.6.1.1. Market size and forecast, by Waste Type
- 8.2.6.1.2. Market size and forecast, by Method
- 8.2.6.1.3. Market size and forecast, by Source
- 8.2.6.1.4. Market size and forecast, by Product
- 8.2.6.2. Canada
- 8.2.6.2.1. Market size and forecast, by Waste Type
- 8.2.6.2.2. Market size and forecast, by Method
- 8.2.6.2.3. Market size and forecast, by Source
- 8.2.6.2.4. Market size and forecast, by Product
- 8.2.6.3. Mexico
- 8.2.6.3.1. Market size and forecast, by Waste Type
- 8.2.6.3.2. Market size and forecast, by Method
- 8.2.6.3.3. Market size and forecast, by Source
- 8.2.6.3.4. Market size and forecast, by Product
- 8.3. Europe
- 8.3.1. Key market trends, growth factors and opportunities
- 8.3.2. Market size and forecast, by Waste Type
- 8.3.3. Market size and forecast, by Method
- 8.3.4. Market size and forecast, by Source
- 8.3.5. Market size and forecast, by Product
- 8.3.6. Market size and forecast, by country
- 8.3.6.1. Germany
- 8.3.6.1.1. Market size and forecast, by Waste Type
- 8.3.6.1.2. Market size and forecast, by Method
- 8.3.6.1.3. Market size and forecast, by Source
- 8.3.6.1.4. Market size and forecast, by Product
- 8.3.6.2. France
- 8.3.6.2.1. Market size and forecast, by Waste Type
- 8.3.6.2.2. Market size and forecast, by Method
- 8.3.6.2.3. Market size and forecast, by Source
- 8.3.6.2.4. Market size and forecast, by Product
- 8.3.6.3. UK
- 8.3.6.3.1. Market size and forecast, by Waste Type
- 8.3.6.3.2. Market size and forecast, by Method
- 8.3.6.3.3. Market size and forecast, by Source
- 8.3.6.3.4. Market size and forecast, by Product
- 8.3.6.4. Italy
- 8.3.6.4.1. Market size and forecast, by Waste Type
- 8.3.6.4.2. Market size and forecast, by Method
- 8.3.6.4.3. Market size and forecast, by Source
- 8.3.6.4.4. Market size and forecast, by Product
- 8.3.6.5. Netherlands
- 8.3.6.5.1. Market size and forecast, by Waste Type
- 8.3.6.5.2. Market size and forecast, by Method
- 8.3.6.5.3. Market size and forecast, by Source
- 8.3.6.5.4. Market size and forecast, by Product
- 8.3.6.6. Belgium
- 8.3.6.6.1. Market size and forecast, by Waste Type
- 8.3.6.6.2. Market size and forecast, by Method
- 8.3.6.6.3. Market size and forecast, by Source
- 8.3.6.6.4. Market size and forecast, by Product
- 8.3.6.7. Poland
- 8.3.6.7.1. Market size and forecast, by Waste Type
- 8.3.6.7.2. Market size and forecast, by Method
- 8.3.6.7.3. Market size and forecast, by Source
- 8.3.6.7.4. Market size and forecast, by Product
- 8.3.6.8. Rest of Europe
- 8.3.6.8.1. Market size and forecast, by Waste Type
- 8.3.6.8.2. Market size and forecast, by Method
- 8.3.6.8.3. Market size and forecast, by Source
- 8.3.6.8.4. Market size and forecast, by Product
- 8.4. Asia-Pacific
- 8.4.1. Key market trends, growth factors and opportunities
- 8.4.2. Market size and forecast, by Waste Type
- 8.4.3. Market size and forecast, by Method
- 8.4.4. Market size and forecast, by Source
- 8.4.5. Market size and forecast, by Product
- 8.4.6. Market size and forecast, by country
- 8.4.6.1. China
- 8.4.6.1.1. Market size and forecast, by Waste Type
- 8.4.6.1.2. Market size and forecast, by Method
- 8.4.6.1.3. Market size and forecast, by Source
- 8.4.6.1.4. Market size and forecast, by Product
- 8.4.6.2. India
- 8.4.6.2.1. Market size and forecast, by Waste Type
- 8.4.6.2.2. Market size and forecast, by Method
- 8.4.6.2.3. Market size and forecast, by Source
- 8.4.6.2.4. Market size and forecast, by Product
- 8.4.6.3. Japan
- 8.4.6.3.1. Market size and forecast, by Waste Type
- 8.4.6.3.2. Market size and forecast, by Method
- 8.4.6.3.3. Market size and forecast, by Source
- 8.4.6.3.4. Market size and forecast, by Product
- 8.4.6.4. South Korea
- 8.4.6.4.1. Market size and forecast, by Waste Type
- 8.4.6.4.2. Market size and forecast, by Method
- 8.4.6.4.3. Market size and forecast, by Source
- 8.4.6.4.4. Market size and forecast, by Product
- 8.4.6.5. Rest of Asia-Pacific
- 8.4.6.5.1. Market size and forecast, by Waste Type
- 8.4.6.5.2. Market size and forecast, by Method
- 8.4.6.5.3. Market size and forecast, by Source
- 8.4.6.5.4. Market size and forecast, by Product
- 8.5. LAMEA
- 8.5.1. Key market trends, growth factors and opportunities
- 8.5.2. Market size and forecast, by Waste Type
- 8.5.3. Market size and forecast, by Method
- 8.5.4. Market size and forecast, by Source
- 8.5.5. Market size and forecast, by Product
- 8.5.6. Market size and forecast, by country
- 8.5.6.1. Latin America
- 8.5.6.1.1. Market size and forecast, by Waste Type
- 8.5.6.1.2. Market size and forecast, by Method
- 8.5.6.1.3. Market size and forecast, by Source
- 8.5.6.1.4. Market size and forecast, by Product
- 8.5.6.2. Middle East
- 8.5.6.2.1. Market size and forecast, by Waste Type
- 8.5.6.2.2. Market size and forecast, by Method
- 8.5.6.2.3. Market size and forecast, by Source
- 8.5.6.2.4. Market size and forecast, by Product
- 8.5.6.3. Africa
- 8.5.6.3.1. Market size and forecast, by Waste Type
- 8.5.6.3.2. Market size and forecast, by Method
- 8.5.6.3.3. Market size and forecast, by Source
- 8.5.6.3.4. Market size and forecast, by Product
CHAPTER 9: COMPETITIVE LANDSCAPE
- 9.1. Introduction
- 9.2. Top winning strategies
- 9.3. Product mapping of top 10 player
- 9.4. Competitive dashboard
- 9.5. Competitive heatmap
- 9.6. Top player positioning, 2023
CHAPTER 10: COMPANY PROFILES
- 10.1. Veolia Environnement S.A.
- 10.1.1. Company overview
- 10.1.2. Key executives
- 10.1.3. Company snapshot
- 10.1.4. Operating business segments
- 10.1.5. Product portfolio
- 10.1.6. Business performance
- 10.1.7. Key strategic moves and developments
- 10.2. Ecube Labs Co. Ltd.
- 10.2.1. Company overview
- 10.2.2. Key executives
- 10.2.3. Company snapshot
- 10.2.4. Operating business segments
- 10.2.5. Product portfolio
- 10.3. Waste Management Inc.
- 10.3.1. Company overview
- 10.3.2. Key executives
- 10.3.3. Company snapshot
- 10.3.4. Operating business segments
- 10.3.5. Product portfolio
- 10.3.6. Business performance
- 10.3.7. Key strategic moves and developments
- 10.4. SUEZ Environmental Services.
- 10.4.1. Company overview
- 10.4.2. Key executives
- 10.4.3. Company snapshot
- 10.4.4. Operating business segments
- 10.4.5. Product portfolio
- 10.4.6. Business performance
- 10.4.7. Key strategic moves and developments
- 10.5. Enevo, Inc
- 10.5.1. Company overview
- 10.5.2. Key executives
- 10.5.3. Company snapshot
- 10.5.4. Operating business segments
- 10.5.5. Product portfolio
- 10.6. Bigbelly, Inc.
- 10.6.1. Company overview
- 10.6.2. Key executives
- 10.6.3. Company snapshot
- 10.6.4. Operating business segments
- 10.6.5. Product portfolio
- 10.6.6. Key strategic moves and developments
- 10.7. Sensoneo j. s. a.
- 10.7.1. Company overview
- 10.7.2. Key executives
- 10.7.3. Company snapshot
- 10.7.4. Operating business segments
- 10.7.5. Product portfolio
- 10.8. Rubicon Technologies, Inc.
- 10.8.1. Company overview
- 10.8.2. Key executives
- 10.8.3. Company snapshot
- 10.8.4. Operating business segments
- 10.8.5. Product portfolio
- 10.8.6. Business performance
- 10.8.7. Key strategic moves and developments
- 10.9. Bine Sp. z o.o.
- 10.9.1. Company overview
- 10.9.2. Key executives
- 10.9.3. Company snapshot
- 10.9.4. Operating business segments
- 10.9.5. Product portfolio
- 10.10. SAP SE
- 10.10.1. Company overview
- 10.10.2. Key executives
- 10.10.3. Company snapshot
- 10.10.4. Operating business segments
- 10.10.5. Product portfolio
- 10.10.6. Business performance
- 10.10.7. Key strategic moves and developments

