
PUBLISHER: Allied Market Research | PRODUCT CODE: 1641753

PUBLISHER: Allied Market Research | PRODUCT CODE: 1641753
Composites Testing Market By Type , By Test Type By End-Use Industry : Global Opportunity Analysis and Industry Forecast, 2024-2033
Composites Testing Market
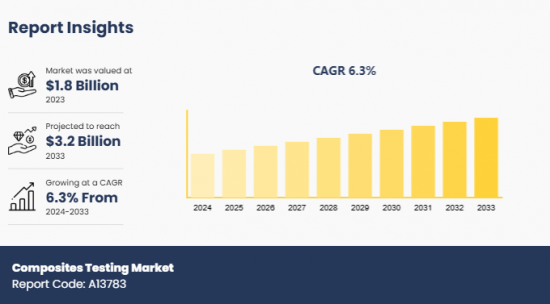
The composites testing market was valued at $1.8 billion in 2023 and is projected to reach $3.2 billion by 2033, growing at a CAGR of 6.3% from 2024 to 2033.
Composites testing involves the examination of mechanical, thermal, physical, and environmental properties of composite materials to ensure they cater to the essential performance criteria across diverse applications. A composite is formed by the combination of two or more components with distinguished characteristics, resulting in a material with superior properties as compared to the individual elements. Conducting robust testing is crucial as composites tend to behave differently from metals or polymers owing to their anisotropic properties and sensitivity to environmental conditions.
Increase in demand for composites from the automotive and aerospace industries owing to their lightweight property has boosted the development & testing of these elements, which is driving the growth of the market. In addition, innovations in the development procedures of composites have fueled the testing process to ensure the reliability of these processes, thereby augmenting the market growth notably. To enhance precision in the testing process, the integration of Industry 4.0 technologies such as AI, ML, and the Internet of Things is currently trending. These technologies enhance the efficiency of testing procedures through predictive modeling and real-time monitoring.
However, the high cost of technologies associated with composites testing restricts its adoption among budget-sensitive manufacturers and research institutions, which hinders the growth of the market. Furthermore, lack of standardization in testing procedures delays the certification and acceptance of new composites, restraining the market development. On the contrary, rise in the usage of composites to produce energy from renewable sources is projected to open new avenues for the composites testing market. According to the International Energy Agency, the consumption of renewable energy in the power, heat, and transport sectors is projected to increase by 60% by 2030. This is poised to fuel the need for ingenious testing solutions to examine the load-bearing capacity and effectiveness of composites against fatigue & weather-induced degradation.
Segment Review
The composites testing market is segmented into type, test type, end-use industry, and region. On the basis of type, the market is divided into ceramic matrics composites, polymer matrics composites, metal matrics composites, fiber reinforced composites, and others. As per test type, it is bifurcated into destructive test and non-destructive test. Depending on end-use industry, it is categorized into aerospace, automotive, construction, and others. Region wise, it is analyzed across North America, Europe, Asia-Pacific, and LAMEA.
Key Findings
On the basis of type, the fiber reinforced composites segment held the highest market share in 2023.
As per test type, the non-destructive test segment dominated the market in 2023.
Depending on end-use industry, the aerospace segment acquired a notable stake in the market in 2023.
Region wise, Europe was the highest revenue generator in 2023.
Competition Analysis
The major players in the global composites testing market include Intertek Group plc, TA Instruments, Micro Materials, Element Materials Technology, Thermtest Inc., Kinectrics, SGS General Surveillance Company SA, Henkel AG & Co. KGaA, Instron Corporation, and R-TECH MATERIALS. These major players have adopted various key development strategies such as business expansion, new product launches, and partnerships to strengthen their foothold in the competitive market.
Additional benefits you will get with this purchase are:
- Quarterly Update and* (only available with a corporate license, on listed price)
- 5 additional Company Profile of client Choice pre- or Post-purchase, as a free update.
- Free Upcoming Version on the Purchase of Five and Enterprise User License.
- 16 analyst hours of support* (post-purchase, if you find additional data requirements upon review of the report, you may receive support amounting to 16 analyst hours to solve questions, and post-sale queries)
- 15% Free Customization* (in case the scope or segment of the report does not match your requirements, 15% is equivalent to 3 working days of free work, applicable once)
- Free data Pack on the Five and Enterprise User License. (Excel version of the report)
- Free Updated report if the report is 6-12 months old or older.
- 24-hour priority response*
- Free Industry updates and white papers.
Possible Customization with this report (with additional cost and timeline, please talk to the sales executive to know more)
- Capital Investment breakdown
- Consumer Buying Behavior Analysis
- End user preferences and pain points
- Product Benchmarking / Product specification and applications
- Product Life Cycles
- Supply Chain Analysis & Vendor Margins
- Upcoming/New Entrant by Regions
- Technology Trend Analysis
- Distributor margin Analysis
- Go To Market Strategy
- Market share analysis of players by products/segments
- New Product Development/ Product Matrix of Key Players
- Regulatory Guidelines
- Additional company profiles with specific to client's interest
- Additional country or region analysis- market size and forecast
- Brands Share Analysis
- Historic market data
- Import Export Analysis/Data
- Key player details (including location, contact details, supplier/vendor network etc. in excel format)
- Per Capita Consumption Trends
- Product Consumption Analysis
- SWOT Analysis
Key Market Segments
By Type
- Ceramic Matrics Composites
- Polymer Matrics Composites
- Metal Matrics Composites
- Fiber Reinforced Composites
- Others
By Test Type
- Destructive Test
- Non-Destructive Test
By End-Use Industry
- Aerospace
- Automotive
- Construction
- Others
By Region
- North America
- U.S.
- Canada
- Mexico
- Europe
- France
- Germany
- Italy
- Spain
- UK
- Rest of Europe
- Asia-Pacific
- China
- Japan
- India
- South Korea
- Australia
- Rest of Asia-Pacific
- LAMEA
- Brazil
- South Africa
- Saudi Arabia
- Rest of LAMEA
Key Market Players:
- Intertek Group plc
- TA Instruments
- Micro Materials
- Element Materials Technology
- Thermtest Inc.
- Kinectrics
- SGS General Surveillance Company SA
- Henkel AG & Co. KGaA
- Instron Corporation
- R-TECH MATERIALS
TABLE OF CONTENTS
CHAPTER 1: INTRODUCTION
- 1.1. Report Description
- 1.2. Key Market Segments
- 1.3. Key Benefits
- 1.4. Research Methodology
- 1.4.1. Primary Research
- 1.4.2. Secondary Research
- 1.4.3. Analyst Tools and Models
CHAPTER 2: EXECUTIVE SUMMARY
- 2.1. CXO Perspective
CHAPTER 3: MARKET LANDSCAPE
- 3.1. Market Definition and Scope
- 3.2. Key Findings
- 3.2.1. Top Investment Pockets
- 3.2.2. Top Winning Strategies
- 3.3. Porter's Five Forces Analysis
- 3.3.1. Bargaining Power of Suppliers
- 3.3.2. Threat of New Entrants
- 3.3.3. Threat of Substitutes
- 3.3.4. Competitive Rivalry
- 3.3.5. Bargaining Power among Buyers
- 3.4. Market Dynamics
- 3.4.1. Drivers
- 3.4.2. Restraints
- 3.4.3. Opportunities
CHAPTER 4: COMPOSITES TESTING MARKET, BY TYPE
- 4.1. Market Overview
- 4.1.1 Market Size and Forecast, By Type
- 4.2. Ceramic Matrics Composites
- 4.2.1. Key Market Trends, Growth Factors and Opportunities
- 4.2.2. Market Size and Forecast, By Region
- 4.2.3. Market Share Analysis, By Country
- 4.3. Polymer Matrics Composites
- 4.3.1. Key Market Trends, Growth Factors and Opportunities
- 4.3.2. Market Size and Forecast, By Region
- 4.3.3. Market Share Analysis, By Country
- 4.4. Metal Matrics Composites
- 4.4.1. Key Market Trends, Growth Factors and Opportunities
- 4.4.2. Market Size and Forecast, By Region
- 4.4.3. Market Share Analysis, By Country
- 4.5. Fiber Reinforced Composites
- 4.5.1. Key Market Trends, Growth Factors and Opportunities
- 4.5.2. Market Size and Forecast, By Region
- 4.5.3. Market Share Analysis, By Country
- 4.6. Others
- 4.6.1. Key Market Trends, Growth Factors and Opportunities
- 4.6.2. Market Size and Forecast, By Region
- 4.6.3. Market Share Analysis, By Country
CHAPTER 5: COMPOSITES TESTING MARKET, BY TEST TYPE
- 5.1. Market Overview
- 5.1.1 Market Size and Forecast, By Test Type
- 5.2. Destructive Test
- 5.2.1. Key Market Trends, Growth Factors and Opportunities
- 5.2.2. Market Size and Forecast, By Region
- 5.2.3. Market Share Analysis, By Country
- 5.3. Non-Destructive Test
- 5.3.1. Key Market Trends, Growth Factors and Opportunities
- 5.3.2. Market Size and Forecast, By Region
- 5.3.3. Market Share Analysis, By Country
CHAPTER 6: COMPOSITES TESTING MARKET, BY END-USE INDUSTRY
- 6.1. Market Overview
- 6.1.1 Market Size and Forecast, By End-use Industry
- 6.2. Aerospace
- 6.2.1. Key Market Trends, Growth Factors and Opportunities
- 6.2.2. Market Size and Forecast, By Region
- 6.2.3. Market Share Analysis, By Country
- 6.3. Automotive
- 6.3.1. Key Market Trends, Growth Factors and Opportunities
- 6.3.2. Market Size and Forecast, By Region
- 6.3.3. Market Share Analysis, By Country
- 6.4. Construction
- 6.4.1. Key Market Trends, Growth Factors and Opportunities
- 6.4.2. Market Size and Forecast, By Region
- 6.4.3. Market Share Analysis, By Country
- 6.5. Others
- 6.5.1. Key Market Trends, Growth Factors and Opportunities
- 6.5.2. Market Size and Forecast, By Region
- 6.5.3. Market Share Analysis, By Country
CHAPTER 7: COMPOSITES TESTING MARKET, BY REGION
- 7.1. Market Overview
- 7.1.1 Market Size and Forecast, By Region
- 7.2. North America
- 7.2.1. Key Market Trends and Opportunities
- 7.2.2. Market Size and Forecast, By Type
- 7.2.3. Market Size and Forecast, By Test Type
- 7.2.4. Market Size and Forecast, By End-use Industry
- 7.2.5. Market Size and Forecast, By Country
- 7.2.6. U.S. Composites Testing Market
- 7.2.6.1. Market Size and Forecast, By Type
- 7.2.6.2. Market Size and Forecast, By Test Type
- 7.2.6.3. Market Size and Forecast, By End-use Industry
- 7.2.7. Canada Composites Testing Market
- 7.2.7.1. Market Size and Forecast, By Type
- 7.2.7.2. Market Size and Forecast, By Test Type
- 7.2.7.3. Market Size and Forecast, By End-use Industry
- 7.2.8. Mexico Composites Testing Market
- 7.2.8.1. Market Size and Forecast, By Type
- 7.2.8.2. Market Size and Forecast, By Test Type
- 7.2.8.3. Market Size and Forecast, By End-use Industry
- 7.3. Europe
- 7.3.1. Key Market Trends and Opportunities
- 7.3.2. Market Size and Forecast, By Type
- 7.3.3. Market Size and Forecast, By Test Type
- 7.3.4. Market Size and Forecast, By End-use Industry
- 7.3.5. Market Size and Forecast, By Country
- 7.3.6. France Composites Testing Market
- 7.3.6.1. Market Size and Forecast, By Type
- 7.3.6.2. Market Size and Forecast, By Test Type
- 7.3.6.3. Market Size and Forecast, By End-use Industry
- 7.3.7. Germany Composites Testing Market
- 7.3.7.1. Market Size and Forecast, By Type
- 7.3.7.2. Market Size and Forecast, By Test Type
- 7.3.7.3. Market Size and Forecast, By End-use Industry
- 7.3.8. Italy Composites Testing Market
- 7.3.8.1. Market Size and Forecast, By Type
- 7.3.8.2. Market Size and Forecast, By Test Type
- 7.3.8.3. Market Size and Forecast, By End-use Industry
- 7.3.9. Spain Composites Testing Market
- 7.3.9.1. Market Size and Forecast, By Type
- 7.3.9.2. Market Size and Forecast, By Test Type
- 7.3.9.3. Market Size and Forecast, By End-use Industry
- 7.3.10. UK Composites Testing Market
- 7.3.10.1. Market Size and Forecast, By Type
- 7.3.10.2. Market Size and Forecast, By Test Type
- 7.3.10.3. Market Size and Forecast, By End-use Industry
- 7.3.11. Rest Of Europe Composites Testing Market
- 7.3.11.1. Market Size and Forecast, By Type
- 7.3.11.2. Market Size and Forecast, By Test Type
- 7.3.11.3. Market Size and Forecast, By End-use Industry
- 7.4. Asia-Pacific
- 7.4.1. Key Market Trends and Opportunities
- 7.4.2. Market Size and Forecast, By Type
- 7.4.3. Market Size and Forecast, By Test Type
- 7.4.4. Market Size and Forecast, By End-use Industry
- 7.4.5. Market Size and Forecast, By Country
- 7.4.6. China Composites Testing Market
- 7.4.6.1. Market Size and Forecast, By Type
- 7.4.6.2. Market Size and Forecast, By Test Type
- 7.4.6.3. Market Size and Forecast, By End-use Industry
- 7.4.7. Japan Composites Testing Market
- 7.4.7.1. Market Size and Forecast, By Type
- 7.4.7.2. Market Size and Forecast, By Test Type
- 7.4.7.3. Market Size and Forecast, By End-use Industry
- 7.4.8. India Composites Testing Market
- 7.4.8.1. Market Size and Forecast, By Type
- 7.4.8.2. Market Size and Forecast, By Test Type
- 7.4.8.3. Market Size and Forecast, By End-use Industry
- 7.4.9. South Korea Composites Testing Market
- 7.4.9.1. Market Size and Forecast, By Type
- 7.4.9.2. Market Size and Forecast, By Test Type
- 7.4.9.3. Market Size and Forecast, By End-use Industry
- 7.4.10. Australia Composites Testing Market
- 7.4.10.1. Market Size and Forecast, By Type
- 7.4.10.2. Market Size and Forecast, By Test Type
- 7.4.10.3. Market Size and Forecast, By End-use Industry
- 7.4.11. Rest of Asia-Pacific Composites Testing Market
- 7.4.11.1. Market Size and Forecast, By Type
- 7.4.11.2. Market Size and Forecast, By Test Type
- 7.4.11.3. Market Size and Forecast, By End-use Industry
- 7.5. LAMEA
- 7.5.1. Key Market Trends and Opportunities
- 7.5.2. Market Size and Forecast, By Type
- 7.5.3. Market Size and Forecast, By Test Type
- 7.5.4. Market Size and Forecast, By End-use Industry
- 7.5.5. Market Size and Forecast, By Country
- 7.5.6. Brazil Composites Testing Market
- 7.5.6.1. Market Size and Forecast, By Type
- 7.5.6.2. Market Size and Forecast, By Test Type
- 7.5.6.3. Market Size and Forecast, By End-use Industry
- 7.5.7. South Africa Composites Testing Market
- 7.5.7.1. Market Size and Forecast, By Type
- 7.5.7.2. Market Size and Forecast, By Test Type
- 7.5.7.3. Market Size and Forecast, By End-use Industry
- 7.5.8. Saudi Arabia Composites Testing Market
- 7.5.8.1. Market Size and Forecast, By Type
- 7.5.8.2. Market Size and Forecast, By Test Type
- 7.5.8.3. Market Size and Forecast, By End-use Industry
- 7.5.9. Rest of LAMEA Composites Testing Market
- 7.5.9.1. Market Size and Forecast, By Type
- 7.5.9.2. Market Size and Forecast, By Test Type
- 7.5.9.3. Market Size and Forecast, By End-use Industry
CHAPTER 8: COMPETITIVE LANDSCAPE
- 8.1. Introduction
- 8.2. Top Winning Strategies
- 8.3. Product Mapping Of Top 10 Player
- 8.4. Competitive Dashboard
- 8.5. Competitive Heatmap
- 8.6. Top Player Positioning, 2023
CHAPTER 9: COMPANY PROFILES
- 9.1. Intertek Group Plc
- 9.1.1. Company Overview
- 9.1.2. Key Executives
- 9.1.3. Company Snapshot
- 9.1.4. Operating Business Segments
- 9.1.5. Product Portfolio
- 9.1.6. Business Performance
- 9.1.7. Key Strategic Moves and Developments
- 9.2. TA Instruments
- 9.2.1. Company Overview
- 9.2.2. Key Executives
- 9.2.3. Company Snapshot
- 9.2.4. Operating Business Segments
- 9.2.5. Product Portfolio
- 9.2.6. Business Performance
- 9.2.7. Key Strategic Moves and Developments
- 9.3. Micro Materials
- 9.3.1. Company Overview
- 9.3.2. Key Executives
- 9.3.3. Company Snapshot
- 9.3.4. Operating Business Segments
- 9.3.5. Product Portfolio
- 9.3.6. Business Performance
- 9.3.7. Key Strategic Moves and Developments
- 9.4. Element Materials Technology
- 9.4.1. Company Overview
- 9.4.2. Key Executives
- 9.4.3. Company Snapshot
- 9.4.4. Operating Business Segments
- 9.4.5. Product Portfolio
- 9.4.6. Business Performance
- 9.4.7. Key Strategic Moves and Developments
- 9.5. Thermtest Inc.
- 9.5.1. Company Overview
- 9.5.2. Key Executives
- 9.5.3. Company Snapshot
- 9.5.4. Operating Business Segments
- 9.5.5. Product Portfolio
- 9.5.6. Business Performance
- 9.5.7. Key Strategic Moves and Developments
- 9.6. Kinectrics
- 9.6.1. Company Overview
- 9.6.2. Key Executives
- 9.6.3. Company Snapshot
- 9.6.4. Operating Business Segments
- 9.6.5. Product Portfolio
- 9.6.6. Business Performance
- 9.6.7. Key Strategic Moves and Developments
- 9.7. SGS General Surveillance Company SA
- 9.7.1. Company Overview
- 9.7.2. Key Executives
- 9.7.3. Company Snapshot
- 9.7.4. Operating Business Segments
- 9.7.5. Product Portfolio
- 9.7.6. Business Performance
- 9.7.7. Key Strategic Moves and Developments
- 9.8. Henkel AG And Co. KGaA
- 9.8.1. Company Overview
- 9.8.2. Key Executives
- 9.8.3. Company Snapshot
- 9.8.4. Operating Business Segments
- 9.8.5. Product Portfolio
- 9.8.6. Business Performance
- 9.8.7. Key Strategic Moves and Developments
- 9.9. Instron Corporation
- 9.9.1. Company Overview
- 9.9.2. Key Executives
- 9.9.3. Company Snapshot
- 9.9.4. Operating Business Segments
- 9.9.5. Product Portfolio
- 9.9.6. Business Performance
- 9.9.7. Key Strategic Moves and Developments
- 9.10. R-TECH MATERIALS
- 9.10.1. Company Overview
- 9.10.2. Key Executives
- 9.10.3. Company Snapshot
- 9.10.4. Operating Business Segments
- 9.10.5. Product Portfolio
- 9.10.6. Business Performance
- 9.10.7. Key Strategic Moves and Developments

