
Need help finding what you are looking for?
Contact Us
PUBLISHER: Allied Market Research | PRODUCT CODE: 1513425

PUBLISHER: Allied Market Research | PRODUCT CODE: 1513425
Staple Food Market By Product Type, By Nature, By Distribution Channel (Direct-to-Consumer, Retail Stores, Wholesale Distributors, Online Retailers, Others): Global Opportunity Analysis and Industry Forecast, 2023-2032
PUBLISHED:
PAGES: 340 Pages
DELIVERY TIME: 2-3 business days
SELECT AN OPTION
The global staple food market is anticipated to reach $3,210.2 billion by 2032, growing from $1,684.4 billion in 2022 at a CAGR of 7.2% from 2023 to 2032.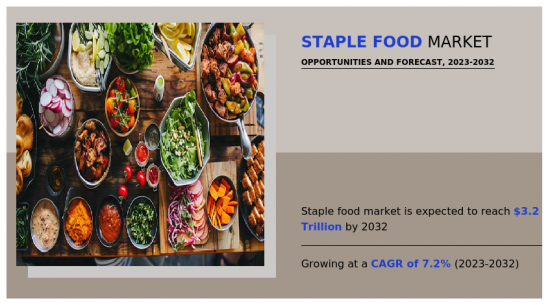 A staple food is a basic and commonly consumed food item that serves as a significant source of nutrients and energy in a specific culture or region. Staples are usually inexpensive, widely available, and easy to store. Staple foods can be derived from a variety of sources such as cereals (like rice, wheat, and corn), tubers (like potatoes and cassava), legumes (like beans and lentils), and other carbohydrate-rich foods. The specific staple foods in a diet can vary widely depending on cultural, geographical, and economic factors.Clean labels on food products have become a significant trend in the food industry, impacting consumer choices and driving market growth, especially in the staple food sector. The term clean label generally refers to food products with minimal, simple, and transparent ingredients, often avoiding artificial additives, preservatives, and synthetic chemicals. This trend aligns with the growing consumer demand for healthier and more natural food choices. As consumers become more health-conscious, they are increasingly seeking foods that align with healthier lifestyles. Clean labels on staple foods indicate fewer artificial ingredients, suggesting that these products are healthier. The clean label trend often goes hand-in-hand with a preference for natural and organic products. Staple food producers who adopt this approach are likely to attract consumers looking for less processed and more natural food options.Staple foods require a complex supply chain to reach consumers, including transportation, storage, and distribution networks. Disruptions due to geopolitical issues, pandemics, strikes, or natural disasters can hamper the availability of these foods, causing price fluctuations and shortages. Tariffs, import/export restrictions, and other trade barriers can limit the movement of staple foods across borders. Regulations related to food safety, quality standards, and labeling can also pose challenges for producers and distributors. These factors are anticipated to restrain the staple food market growth.Rising interest in plant-based diets creates opportunities for staple food producers to offer innovative products. For example, plant-based proteins like lentils, chickpeas, and quinoa can complement or replace traditional staples, appealing to health-conscious and environmentally aware consumers. Consumers are increasingly concerned about the environmental impact of food production. Companies can seize the opportunity by adopting sustainable practices such as regenerative agriculture, reduced water usage, and eco-friendly packaging. These efforts can attract environmentally conscious consumers and support long-term sustainability. The trend toward functional foods is growing, offering opportunities to enhance staple foods with added nutrients like vitamins, minerals, and antioxidants. This could involve fortifying staple grains with key nutrients to address common deficiencies.The key players profiled in this report include Nestle, PepsiCo, Cargill, ADM Company, Coca-Cola, AB InBev, JBS S.A., Mondelez, Danone, and Diageo plc. The market players are continuously striving to achieve an upper hand in this competitive market using strategies such as collaborations and acquisitions.
Key Benefits For Stakeholders
- This report provides a quantitative analysis of the market segments, current trends, estimations, and dynamics of the staple food market analysis from 2022 to 2032 to identify the prevailing staple food market opportunities.
- The market research is offered along with information related to key drivers, restraints, and opportunities.
- Porter's five forces analysis highlights the potency of buyers and suppliers to enable stakeholders make profit-oriented business decisions and strengthen their supplier-buyer network.
- In-depth analysis of the staple food market segmentation assists to determine the prevailing market opportunities.
- Major countries in each region are mapped according to their revenue contribution to the global market.
- Market player positioning facilitates benchmarking and provides a clear understanding of the present position of the market players.
- The report includes the analysis of the regional as well as global staple food market trends, key players, market segments, application areas, and market growth strategies.Additional benefits you will get with this purchase are:
- Quarterly Update and* (only available with a corporate license, on listed price)
- 5 additional Company Profile of client Choice pre- or Post-purchase, as a free update.
- Free Upcoming Version on the Purchase of Five and Enterprise User License.
- 16 analyst hours of support* (post-purchase, if you find additional data requirements upon review of the report, you may receive support amounting to 16 analyst hours to solve questions, and post-sale queries)
- 15% Free Customization* (in case the scope or segment of the report does not match your requirements, 15% is equivalent to 3 working days of free work, applicable once)
- Free data Pack on the Five and Enterprise User License. (Excel version of the report)
- Free Updated report if the report is 6-12 months old or older.
- 24-hour priority response*
- Free Industry updates and white papers.Possible Customization with this report (with additional cost and timeline, please talk to the sales executive to know more)
- Analysis of raw material in a product (by %)
- End user preferences and pain points
- Investment Opportunities
- Product Life Cycle
- Upcoming/New Entrant by Regions
- Average Consumer Expenditure
- Distributor margin Analysis
- Market share analysis of players by products/segments
- Regulatory Guidelines
- Strategic Recommendations
- Additional company profiles with specific to client's interest
- Additional country or region analysis- market size and forecast
- Average Selling Price Analysis / Price Point Analysis
- Criss-cross segment analysis- market size and forecast
- Expanded list for Company Profiles
- Historic market data
- Key player details (including location, contact details, supplier/vendor network etc. in excel format)
- Market share analysis of players at global/region/country level
- SWOT Analysis
- Volume Market Size and Forecast
Key Market Segments
By Product Type
- Cereals
- Sugar
- Roots and Tuber
- Fruit
- Vegetables
- Oil
- Others
By Nature
- Organic
- Conventional
By Distribution Channel
- Wholesale Distributors
- Online Retailers
- Others
- Direct-to-Consumer (D2C)
- Retail Stores
By Region
- North America
- U.S.
- Canada
- Mexico
- Europe
- Germany
- UK
- France
- Spain
- Italy
- Rest of Europe
- Asia-Pacific
- China
- Japan
- India
- South Korea
- Australia
- Rest of Asia-Pacific
- LAMEA
- Brazil
- South Africa,
- United Arab Emirates
- South Africa
- Rest of LAMEA
Key Market Players:
- Nestle
- PepsiCo
- Cargill
- ADM Company
- Coca-Cola
- AB InBev
- JBS S.A.
- Mondelez
- Danone
- DIAGEO PLC
Product Code: A323381
TABLE OF CONTENTS
CHAPTER 1: INTRODUCTION
- 1.1. Report description
- 1.2. Key market segments
- 1.3. Key benefits to the stakeholders
- 1.4. Research methodology
- 1.4.1. Primary research
- 1.4.2. Secondary research
- 1.4.3. Analyst tools and models
CHAPTER 2: EXECUTIVE SUMMARY
- 2.1. CXO perspective
CHAPTER 3: MARKET OVERVIEW
- 3.1. Market definition and scope
- 3.2. Key findings
- 3.2.1. Top impacting factors
- 3.2.2. Top investment pockets
- 3.3. Porter's five forces analysis
- 3.4. Market dynamics
- 3.4.1. Drivers
- 3.4.2. Restraints
- 3.4.3. Opportunities
- 3.5. Average Selling Price
- 3.6. Market Share Analysis
- 3.7. Brand Share Analysis
- 3.8. Trade Data Analysis
- 3.9. Product Consumption
- 3.10. Value Chain Analysis
- 3.11. Key Players Details
- 3.12. Key Regulation Analysis
- 3.13. Regulatory Guidelines
- 3.14. Patent Landscape
- 3.15. Reimbursement Scenario
CHAPTER 4: STAPLE FOOD MARKET, BY PRODUCT TYPE
- 4.1. Overview
- 4.1.1. Market size and forecast
- 4.2. Cereals
- 4.2.1. Key market trends, growth factors and opportunities
- 4.2.2. Market size and forecast, by region
- 4.2.3. Market share analysis by country
- 4.3. Sugar
- 4.3.1. Key market trends, growth factors and opportunities
- 4.3.2. Market size and forecast, by region
- 4.3.3. Market share analysis by country
- 4.4. Roots and Tuber
- 4.4.1. Key market trends, growth factors and opportunities
- 4.4.2. Market size and forecast, by region
- 4.4.3. Market share analysis by country
- 4.5. Fruit
- 4.5.1. Key market trends, growth factors and opportunities
- 4.5.2. Market size and forecast, by region
- 4.5.3. Market share analysis by country
- 4.6. Vegetables
- 4.6.1. Key market trends, growth factors and opportunities
- 4.6.2. Market size and forecast, by region
- 4.6.3. Market share analysis by country
- 4.7. Oil
- 4.7.1. Key market trends, growth factors and opportunities
- 4.7.2. Market size and forecast, by region
- 4.7.3. Market share analysis by country
- 4.8. Others
- 4.8.1. Key market trends, growth factors and opportunities
- 4.8.2. Market size and forecast, by region
- 4.8.3. Market share analysis by country
CHAPTER 5: STAPLE FOOD MARKET, BY NATURE
- 5.1. Overview
- 5.1.1. Market size and forecast
- 5.2. Organic
- 5.2.1. Key market trends, growth factors and opportunities
- 5.2.2. Market size and forecast, by region
- 5.2.3. Market share analysis by country
- 5.3. Conventional
- 5.3.1. Key market trends, growth factors and opportunities
- 5.3.2. Market size and forecast, by region
- 5.3.3. Market share analysis by country
CHAPTER 6: STAPLE FOOD MARKET, BY DISTRIBUTION CHANNEL
- 6.1. Overview
- 6.1.1. Market size and forecast
- 6.2. Direct-to-Consumer (D2C)
- 6.2.1. Key market trends, growth factors and opportunities
- 6.2.2. Market size and forecast, by region
- 6.2.3. Market share analysis by country
- 6.3. Retail Stores
- 6.3.1. Key market trends, growth factors and opportunities
- 6.3.2. Market size and forecast, by region
- 6.3.3. Market share analysis by country
- 6.4. Wholesale Distributors
- 6.4.1. Key market trends, growth factors and opportunities
- 6.4.2. Market size and forecast, by region
- 6.4.3. Market share analysis by country
- 6.5. Online Retailers
- 6.5.1. Key market trends, growth factors and opportunities
- 6.5.2. Market size and forecast, by region
- 6.5.3. Market share analysis by country
- 6.6. Others
- 6.6.1. Key market trends, growth factors and opportunities
- 6.6.2. Market size and forecast, by region
- 6.6.3. Market share analysis by country
CHAPTER 7: STAPLE FOOD MARKET, BY REGION
- 7.1. Overview
- 7.1.1. Market size and forecast By Region
- 7.2. North America
- 7.2.1. Key market trends, growth factors and opportunities
- 7.2.2. Market size and forecast, by Product Type
- 7.2.3. Market size and forecast, by Nature
- 7.2.4. Market size and forecast, by Distribution Channel
- 7.2.5. Market size and forecast, by country
- 7.2.5.1. U.S.
- 7.2.5.1.1. Market size and forecast, by Product Type
- 7.2.5.1.2. Market size and forecast, by Nature
- 7.2.5.1.3. Market size and forecast, by Distribution Channel
- 7.2.5.2. Canada
- 7.2.5.2.1. Market size and forecast, by Product Type
- 7.2.5.2.2. Market size and forecast, by Nature
- 7.2.5.2.3. Market size and forecast, by Distribution Channel
- 7.2.5.3. Mexico
- 7.2.5.3.1. Market size and forecast, by Product Type
- 7.2.5.3.2. Market size and forecast, by Nature
- 7.2.5.3.3. Market size and forecast, by Distribution Channel
- 7.3. Europe
- 7.3.1. Key market trends, growth factors and opportunities
- 7.3.2. Market size and forecast, by Product Type
- 7.3.3. Market size and forecast, by Nature
- 7.3.4. Market size and forecast, by Distribution Channel
- 7.3.5. Market size and forecast, by country
- 7.3.5.1. Germany
- 7.3.5.1.1. Market size and forecast, by Product Type
- 7.3.5.1.2. Market size and forecast, by Nature
- 7.3.5.1.3. Market size and forecast, by Distribution Channel
- 7.3.5.2. UK
- 7.3.5.2.1. Market size and forecast, by Product Type
- 7.3.5.2.2. Market size and forecast, by Nature
- 7.3.5.2.3. Market size and forecast, by Distribution Channel
- 7.3.5.3. France
- 7.3.5.3.1. Market size and forecast, by Product Type
- 7.3.5.3.2. Market size and forecast, by Nature
- 7.3.5.3.3. Market size and forecast, by Distribution Channel
- 7.3.5.4. Spain
- 7.3.5.4.1. Market size and forecast, by Product Type
- 7.3.5.4.2. Market size and forecast, by Nature
- 7.3.5.4.3. Market size and forecast, by Distribution Channel
- 7.3.5.5. Italy
- 7.3.5.5.1. Market size and forecast, by Product Type
- 7.3.5.5.2. Market size and forecast, by Nature
- 7.3.5.5.3. Market size and forecast, by Distribution Channel
- 7.3.5.6. Rest of Europe
- 7.3.5.6.1. Market size and forecast, by Product Type
- 7.3.5.6.2. Market size and forecast, by Nature
- 7.3.5.6.3. Market size and forecast, by Distribution Channel
- 7.4. Asia-Pacific
- 7.4.1. Key market trends, growth factors and opportunities
- 7.4.2. Market size and forecast, by Product Type
- 7.4.3. Market size and forecast, by Nature
- 7.4.4. Market size and forecast, by Distribution Channel
- 7.4.5. Market size and forecast, by country
- 7.4.5.1. China
- 7.4.5.1.1. Market size and forecast, by Product Type
- 7.4.5.1.2. Market size and forecast, by Nature
- 7.4.5.1.3. Market size and forecast, by Distribution Channel
- 7.4.5.2. Japan
- 7.4.5.2.1. Market size and forecast, by Product Type
- 7.4.5.2.2. Market size and forecast, by Nature
- 7.4.5.2.3. Market size and forecast, by Distribution Channel
- 7.4.5.3. India
- 7.4.5.3.1. Market size and forecast, by Product Type
- 7.4.5.3.2. Market size and forecast, by Nature
- 7.4.5.3.3. Market size and forecast, by Distribution Channel
- 7.4.5.4. South Korea
- 7.4.5.4.1. Market size and forecast, by Product Type
- 7.4.5.4.2. Market size and forecast, by Nature
- 7.4.5.4.3. Market size and forecast, by Distribution Channel
- 7.4.5.5. Australia
- 7.4.5.5.1. Market size and forecast, by Product Type
- 7.4.5.5.2. Market size and forecast, by Nature
- 7.4.5.5.3. Market size and forecast, by Distribution Channel
- 7.4.5.6. Rest of Asia-Pacific
- 7.4.5.6.1. Market size and forecast, by Product Type
- 7.4.5.6.2. Market size and forecast, by Nature
- 7.4.5.6.3. Market size and forecast, by Distribution Channel
- 7.5. LAMEA
- 7.5.1. Key market trends, growth factors and opportunities
- 7.5.2. Market size and forecast, by Product Type
- 7.5.3. Market size and forecast, by Nature
- 7.5.4. Market size and forecast, by Distribution Channel
- 7.5.5. Market size and forecast, by country
- 7.5.5.1. Brazil
- 7.5.5.1.1. Market size and forecast, by Product Type
- 7.5.5.1.2. Market size and forecast, by Nature
- 7.5.5.1.3. Market size and forecast, by Distribution Channel
- 7.5.5.2. South Africa,
- 7.5.5.2.1. Market size and forecast, by Product Type
- 7.5.5.2.2. Market size and forecast, by Nature
- 7.5.5.2.3. Market size and forecast, by Distribution Channel
- 7.5.5.3. United Arab Emirates
- 7.5.5.3.1. Market size and forecast, by Product Type
- 7.5.5.3.2. Market size and forecast, by Nature
- 7.5.5.3.3. Market size and forecast, by Distribution Channel
- 7.5.5.4. South Africa
- 7.5.5.4.1. Market size and forecast, by Product Type
- 7.5.5.4.2. Market size and forecast, by Nature
- 7.5.5.4.3. Market size and forecast, by Distribution Channel
- 7.5.5.5. Rest of LAMEA
- 7.5.5.5.1. Market size and forecast, by Product Type
- 7.5.5.5.2. Market size and forecast, by Nature
- 7.5.5.5.3. Market size and forecast, by Distribution Channel
CHAPTER 8: COMPETITIVE LANDSCAPE
- 8.1. Introduction
- 8.2. Top winning strategies
- 8.3. Product mapping of top 10 player
- 8.4. Competitive dashboard
- 8.5. Competitive heatmap
- 8.6. Top player positioning, 2022
CHAPTER 9: COMPANY PROFILES
- 9.1. Nestle
- 9.1.1. Company overview
- 9.1.2. Key executives
- 9.1.3. Company snapshot
- 9.2. PepsiCo
- 9.2.1. Company overview
- 9.2.2. Key executives
- 9.2.3. Company snapshot
- 9.3. Cargill
- 9.3.1. Company overview
- 9.3.2. Key executives
- 9.3.3. Company snapshot
- 9.4. ADM Company
- 9.4.1. Company overview
- 9.4.2. Key executives
- 9.4.3. Company snapshot
- 9.5. Coca-Cola
- 9.5.1. Company overview
- 9.5.2. Key executives
- 9.5.3. Company snapshot
- 9.6. AB InBev
- 9.6.1. Company overview
- 9.6.2. Key executives
- 9.6.3. Company snapshot
- 9.7. JBS S.A.
- 9.7.1. Company overview
- 9.7.2. Key executives
- 9.7.3. Company snapshot
- 9.8. Mondelez
- 9.8.1. Company overview
- 9.8.2. Key executives
- 9.8.3. Company snapshot
- 9.9. Danone
- 9.9.1. Company overview
- 9.9.2. Key executives
- 9.9.3. Company snapshot
- 9.10. DIAGEO PLC
- 9.10.1. Company overview
- 9.10.2. Key executives
- 9.10.3. Company snapshot
Product Code: A323381
LIST OF TABLES
- TABLE 01. GLOBAL STAPLE FOOD MARKET, BY PRODUCT TYPE, 2022-2032 ($BILLION)
- TABLE 02. STAPLE FOOD MARKET FOR CEREALS, BY REGION, 2022-2032 ($BILLION)
- TABLE 03. STAPLE FOOD MARKET FOR SUGAR, BY REGION, 2022-2032 ($BILLION)
- TABLE 04. STAPLE FOOD MARKET FOR ROOTS AND TUBER, BY REGION, 2022-2032 ($BILLION)
- TABLE 05. STAPLE FOOD MARKET FOR FRUIT, BY REGION, 2022-2032 ($BILLION)
- TABLE 06. STAPLE FOOD MARKET FOR VEGETABLES, BY REGION, 2022-2032 ($BILLION)
- TABLE 07. STAPLE FOOD MARKET FOR OIL, BY REGION, 2022-2032 ($BILLION)
- TABLE 08. STAPLE FOOD MARKET FOR OTHERS, BY REGION, 2022-2032 ($BILLION)
- TABLE 09. GLOBAL STAPLE FOOD MARKET, BY NATURE, 2022-2032 ($BILLION)
- TABLE 10. STAPLE FOOD MARKET FOR ORGANIC, BY REGION, 2022-2032 ($BILLION)
- TABLE 11. STAPLE FOOD MARKET FOR CONVENTIONAL, BY REGION, 2022-2032 ($BILLION)
- TABLE 12. GLOBAL STAPLE FOOD MARKET, BY DISTRIBUTION CHANNEL, 2022-2032 ($BILLION)
- TABLE 13. STAPLE FOOD MARKET FOR DIRECT-TO-CONSUMER (D2C), BY REGION, 2022-2032 ($BILLION)
- TABLE 14. STAPLE FOOD MARKET FOR RETAIL STORES, BY REGION, 2022-2032 ($BILLION)
- TABLE 15. STAPLE FOOD MARKET FOR WHOLESALE DISTRIBUTORS, BY REGION, 2022-2032 ($BILLION)
- TABLE 16. STAPLE FOOD MARKET FOR ONLINE RETAILERS, BY REGION, 2022-2032 ($BILLION)
- TABLE 17. STAPLE FOOD MARKET FOR OTHERS, BY REGION, 2022-2032 ($BILLION)
- TABLE 18. STAPLE FOOD MARKET, BY REGION, 2022-2032 ($BILLION)
- TABLE 19. NORTH AMERICA STAPLE FOOD MARKET, BY PRODUCT TYPE, 2022-2032 ($BILLION)
- TABLE 20. NORTH AMERICA STAPLE FOOD MARKET, BY NATURE, 2022-2032 ($BILLION)
- TABLE 21. NORTH AMERICA STAPLE FOOD MARKET, BY DISTRIBUTION CHANNEL, 2022-2032 ($BILLION)
- TABLE 22. NORTH AMERICA STAPLE FOOD MARKET, BY COUNTRY, 2022-2032 ($BILLION)
- TABLE 23. U.S. STAPLE FOOD MARKET, BY PRODUCT TYPE, 2022-2032 ($BILLION)
- TABLE 24. U.S. STAPLE FOOD MARKET, BY NATURE, 2022-2032 ($BILLION)
- TABLE 25. U.S. STAPLE FOOD MARKET, BY DISTRIBUTION CHANNEL, 2022-2032 ($BILLION)
- TABLE 26. CANADA STAPLE FOOD MARKET, BY PRODUCT TYPE, 2022-2032 ($BILLION)
- TABLE 27. CANADA STAPLE FOOD MARKET, BY NATURE, 2022-2032 ($BILLION)
- TABLE 28. CANADA STAPLE FOOD MARKET, BY DISTRIBUTION CHANNEL, 2022-2032 ($BILLION)
- TABLE 29. MEXICO STAPLE FOOD MARKET, BY PRODUCT TYPE, 2022-2032 ($BILLION)
- TABLE 30. MEXICO STAPLE FOOD MARKET, BY NATURE, 2022-2032 ($BILLION)
- TABLE 31. MEXICO STAPLE FOOD MARKET, BY DISTRIBUTION CHANNEL, 2022-2032 ($BILLION)
- TABLE 32. EUROPE STAPLE FOOD MARKET, BY PRODUCT TYPE, 2022-2032 ($BILLION)
- TABLE 33. EUROPE STAPLE FOOD MARKET, BY NATURE, 2022-2032 ($BILLION)
- TABLE 34. EUROPE STAPLE FOOD MARKET, BY DISTRIBUTION CHANNEL, 2022-2032 ($BILLION)
- TABLE 35. EUROPE STAPLE FOOD MARKET, BY COUNTRY, 2022-2032 ($BILLION)
- TABLE 36. GERMANY STAPLE FOOD MARKET, BY PRODUCT TYPE, 2022-2032 ($BILLION)
- TABLE 37. GERMANY STAPLE FOOD MARKET, BY NATURE, 2022-2032 ($BILLION)
- TABLE 38. GERMANY STAPLE FOOD MARKET, BY DISTRIBUTION CHANNEL, 2022-2032 ($BILLION)
- TABLE 39. UK STAPLE FOOD MARKET, BY PRODUCT TYPE, 2022-2032 ($BILLION)
- TABLE 40. UK STAPLE FOOD MARKET, BY NATURE, 2022-2032 ($BILLION)
- TABLE 41. UK STAPLE FOOD MARKET, BY DISTRIBUTION CHANNEL, 2022-2032 ($BILLION)
- TABLE 42. FRANCE STAPLE FOOD MARKET, BY PRODUCT TYPE, 2022-2032 ($BILLION)
- TABLE 43. FRANCE STAPLE FOOD MARKET, BY NATURE, 2022-2032 ($BILLION)
- TABLE 44. FRANCE STAPLE FOOD MARKET, BY DISTRIBUTION CHANNEL, 2022-2032 ($BILLION)
- TABLE 45. SPAIN STAPLE FOOD MARKET, BY PRODUCT TYPE, 2022-2032 ($BILLION)
- TABLE 46. SPAIN STAPLE FOOD MARKET, BY NATURE, 2022-2032 ($BILLION)
- TABLE 47. SPAIN STAPLE FOOD MARKET, BY DISTRIBUTION CHANNEL, 2022-2032 ($BILLION)
- TABLE 48. ITALY STAPLE FOOD MARKET, BY PRODUCT TYPE, 2022-2032 ($BILLION)
- TABLE 49. ITALY STAPLE FOOD MARKET, BY NATURE, 2022-2032 ($BILLION)
- TABLE 50. ITALY STAPLE FOOD MARKET, BY DISTRIBUTION CHANNEL, 2022-2032 ($BILLION)
- TABLE 51. REST OF EUROPE STAPLE FOOD MARKET, BY PRODUCT TYPE, 2022-2032 ($BILLION)
- TABLE 52. REST OF EUROPE STAPLE FOOD MARKET, BY NATURE, 2022-2032 ($BILLION)
- TABLE 53. REST OF EUROPE STAPLE FOOD MARKET, BY DISTRIBUTION CHANNEL, 2022-2032 ($BILLION)
- TABLE 54. ASIA-PACIFIC STAPLE FOOD MARKET, BY PRODUCT TYPE, 2022-2032 ($BILLION)
- TABLE 55. ASIA-PACIFIC STAPLE FOOD MARKET, BY NATURE, 2022-2032 ($BILLION)
- TABLE 56. ASIA-PACIFIC STAPLE FOOD MARKET, BY DISTRIBUTION CHANNEL, 2022-2032 ($BILLION)
- TABLE 57. ASIA-PACIFIC STAPLE FOOD MARKET, BY COUNTRY, 2022-2032 ($BILLION)
- TABLE 58. CHINA STAPLE FOOD MARKET, BY PRODUCT TYPE, 2022-2032 ($BILLION)
- TABLE 59. CHINA STAPLE FOOD MARKET, BY NATURE, 2022-2032 ($BILLION)
- TABLE 60. CHINA STAPLE FOOD MARKET, BY DISTRIBUTION CHANNEL, 2022-2032 ($BILLION)
- TABLE 61. JAPAN STAPLE FOOD MARKET, BY PRODUCT TYPE, 2022-2032 ($BILLION)
- TABLE 62. JAPAN STAPLE FOOD MARKET, BY NATURE, 2022-2032 ($BILLION)
- TABLE 63. JAPAN STAPLE FOOD MARKET, BY DISTRIBUTION CHANNEL, 2022-2032 ($BILLION)
- TABLE 64. INDIA STAPLE FOOD MARKET, BY PRODUCT TYPE, 2022-2032 ($BILLION)
- TABLE 65. INDIA STAPLE FOOD MARKET, BY NATURE, 2022-2032 ($BILLION)
- TABLE 66. INDIA STAPLE FOOD MARKET, BY DISTRIBUTION CHANNEL, 2022-2032 ($BILLION)
- TABLE 67. SOUTH KOREA STAPLE FOOD MARKET, BY PRODUCT TYPE, 2022-2032 ($BILLION)
- TABLE 68. SOUTH KOREA STAPLE FOOD MARKET, BY NATURE, 2022-2032 ($BILLION)
- TABLE 69. SOUTH KOREA STAPLE FOOD MARKET, BY DISTRIBUTION CHANNEL, 2022-2032 ($BILLION)
- TABLE 70. AUSTRALIA STAPLE FOOD MARKET, BY PRODUCT TYPE, 2022-2032 ($BILLION)
- TABLE 71. AUSTRALIA STAPLE FOOD MARKET, BY NATURE, 2022-2032 ($BILLION)
- TABLE 72. AUSTRALIA STAPLE FOOD MARKET, BY DISTRIBUTION CHANNEL, 2022-2032 ($BILLION)
- TABLE 73. REST OF ASIA-PACIFIC STAPLE FOOD MARKET, BY PRODUCT TYPE, 2022-2032 ($BILLION)
- TABLE 74. REST OF ASIA-PACIFIC STAPLE FOOD MARKET, BY NATURE, 2022-2032 ($BILLION)
- TABLE 75. REST OF ASIA-PACIFIC STAPLE FOOD MARKET, BY DISTRIBUTION CHANNEL, 2022-2032 ($BILLION)
- TABLE 76. LAMEA STAPLE FOOD MARKET, BY PRODUCT TYPE, 2022-2032 ($BILLION)
- TABLE 77. LAMEA STAPLE FOOD MARKET, BY NATURE, 2022-2032 ($BILLION)
- TABLE 78. LAMEA STAPLE FOOD MARKET, BY DISTRIBUTION CHANNEL, 2022-2032 ($BILLION)
- TABLE 79. LAMEA STAPLE FOOD MARKET, BY COUNTRY, 2022-2032 ($BILLION)
- TABLE 80. BRAZIL STAPLE FOOD MARKET, BY PRODUCT TYPE, 2022-2032 ($BILLION)
- TABLE 81. BRAZIL STAPLE FOOD MARKET, BY NATURE, 2022-2032 ($BILLION)
- TABLE 82. BRAZIL STAPLE FOOD MARKET, BY DISTRIBUTION CHANNEL, 2022-2032 ($BILLION)
- TABLE 83. SOUTH AFRICA, STAPLE FOOD MARKET, BY PRODUCT TYPE, 2022-2032 ($BILLION)
- TABLE 84. SOUTH AFRICA, STAPLE FOOD MARKET, BY NATURE, 2022-2032 ($BILLION)
- TABLE 85. SOUTH AFRICA, STAPLE FOOD MARKET, BY DISTRIBUTION CHANNEL, 2022-2032 ($BILLION)
- TABLE 86. UNITED ARAB EMIRATES STAPLE FOOD MARKET, BY PRODUCT TYPE, 2022-2032 ($BILLION)
- TABLE 87. UNITED ARAB EMIRATES STAPLE FOOD MARKET, BY NATURE, 2022-2032 ($BILLION)
- TABLE 88. UNITED ARAB EMIRATES STAPLE FOOD MARKET, BY DISTRIBUTION CHANNEL, 2022-2032 ($BILLION)
- TABLE 89. SOUTH AFRICA STAPLE FOOD MARKET, BY PRODUCT TYPE, 2022-2032 ($BILLION)
- TABLE 90. SOUTH AFRICA STAPLE FOOD MARKET, BY NATURE, 2022-2032 ($BILLION)
- TABLE 91. SOUTH AFRICA STAPLE FOOD MARKET, BY DISTRIBUTION CHANNEL, 2022-2032 ($BILLION)
- TABLE 92. REST OF LAMEA STAPLE FOOD MARKET, BY PRODUCT TYPE, 2022-2032 ($BILLION)
- TABLE 93. REST OF LAMEA STAPLE FOOD MARKET, BY NATURE, 2022-2032 ($BILLION)
- TABLE 94. REST OF LAMEA STAPLE FOOD MARKET, BY DISTRIBUTION CHANNEL, 2022-2032 ($BILLION)
- TABLE 95. NESTLE: KEY EXECUTIVES
- TABLE 96. NESTLE: COMPANY SNAPSHOT
- TABLE 97. PEPSICO: KEY EXECUTIVES
- TABLE 98. PEPSICO: COMPANY SNAPSHOT
- TABLE 99. CARGILL: KEY EXECUTIVES
- TABLE 100. CARGILL: COMPANY SNAPSHOT
- TABLE 101. ADM COMPANY: KEY EXECUTIVES
- TABLE 102. ADM COMPANY: COMPANY SNAPSHOT
- TABLE 103. COCA-COLA: KEY EXECUTIVES
- TABLE 104. COCA-COLA: COMPANY SNAPSHOT
- TABLE 105. AB INBEV: KEY EXECUTIVES
- TABLE 106. AB INBEV: COMPANY SNAPSHOT
- TABLE 107. JBS S.A.: KEY EXECUTIVES
- TABLE 108. JBS S.A.: COMPANY SNAPSHOT
- TABLE 109. MONDELEZ: KEY EXECUTIVES
- TABLE 110. MONDELEZ: COMPANY SNAPSHOT
- TABLE 111. DANONE: KEY EXECUTIVES
- TABLE 112. DANONE: COMPANY SNAPSHOT
- TABLE 113. DIAGEO PLC: KEY EXECUTIVES
- TABLE 114. DIAGEO PLC: COMPANY SNAPSHOT
LIST OF FIGURES
- FIGURE 01. STAPLE FOOD MARKET, 2022-2032
- FIGURE 02. SEGMENTATION OF STAPLE FOOD MARKET,2022-2032
- FIGURE 03. TOP IMPACTING FACTORS IN STAPLE FOOD MARKET
- FIGURE 04. TOP INVESTMENT POCKETS IN STAPLE FOOD MARKET (2023-2032)
- FIGURE 05. BARGAINING POWER OF SUPPLIERS
- FIGURE 06. BARGAINING POWER OF BUYERS
- FIGURE 07. THREAT OF SUBSTITUTION
- FIGURE 08. THREAT OF SUBSTITUTION
- FIGURE 09. COMPETITIVE RIVALRY
- FIGURE 10. GLOBAL STAPLE FOOD MARKET:DRIVERS, RESTRAINTS AND OPPORTUNITIES
- FIGURE 11. IMPACT OF KEY REGULATION: STAPLE FOOD MARKET
- FIGURE 12. PATENT ANALYSIS BY COMPANY
- FIGURE 13. PATENT ANALYSIS BY COUNTRY
- FIGURE 14. STAPLE FOOD MARKET, BY PRODUCT TYPE, 2022 AND 2032(%)
- FIGURE 15. COMPARATIVE SHARE ANALYSIS OF STAPLE FOOD MARKET FOR CEREALS, BY COUNTRY 2022 AND 2032(%)
- FIGURE 16. COMPARATIVE SHARE ANALYSIS OF STAPLE FOOD MARKET FOR SUGAR, BY COUNTRY 2022 AND 2032(%)
- FIGURE 17. COMPARATIVE SHARE ANALYSIS OF STAPLE FOOD MARKET FOR ROOTS AND TUBER, BY COUNTRY 2022 AND 2032(%)
- FIGURE 18. COMPARATIVE SHARE ANALYSIS OF STAPLE FOOD MARKET FOR FRUIT, BY COUNTRY 2022 AND 2032(%)
- FIGURE 19. COMPARATIVE SHARE ANALYSIS OF STAPLE FOOD MARKET FOR VEGETABLES, BY COUNTRY 2022 AND 2032(%)
- FIGURE 20. COMPARATIVE SHARE ANALYSIS OF STAPLE FOOD MARKET FOR OIL, BY COUNTRY 2022 AND 2032(%)
- FIGURE 21. COMPARATIVE SHARE ANALYSIS OF STAPLE FOOD MARKET FOR OTHERS, BY COUNTRY 2022 AND 2032(%)
- FIGURE 22. STAPLE FOOD MARKET, BY NATURE, 2022 AND 2032(%)
- FIGURE 23. COMPARATIVE SHARE ANALYSIS OF STAPLE FOOD MARKET FOR ORGANIC, BY COUNTRY 2022 AND 2032(%)
- FIGURE 24. COMPARATIVE SHARE ANALYSIS OF STAPLE FOOD MARKET FOR CONVENTIONAL, BY COUNTRY 2022 AND 2032(%)
- FIGURE 25. STAPLE FOOD MARKET, BY DISTRIBUTION CHANNEL, 2022 AND 2032(%)
- FIGURE 26. COMPARATIVE SHARE ANALYSIS OF STAPLE FOOD MARKET FOR DIRECT-TO-CONSUMER (D2C), BY COUNTRY 2022 AND 2032(%)
- FIGURE 27. COMPARATIVE SHARE ANALYSIS OF STAPLE FOOD MARKET FOR RETAIL STORES, BY COUNTRY 2022 AND 2032(%)
- FIGURE 28. COMPARATIVE SHARE ANALYSIS OF STAPLE FOOD MARKET FOR WHOLESALE DISTRIBUTORS, BY COUNTRY 2022 AND 2032(%)
- FIGURE 29. COMPARATIVE SHARE ANALYSIS OF STAPLE FOOD MARKET FOR ONLINE RETAILERS, BY COUNTRY 2022 AND 2032(%)
- FIGURE 30. COMPARATIVE SHARE ANALYSIS OF STAPLE FOOD MARKET FOR OTHERS, BY COUNTRY 2022 AND 2032(%)
- FIGURE 31. STAPLE FOOD MARKET BY REGION, 2022 AND 2032(%)
- FIGURE 32. U.S. STAPLE FOOD MARKET, 2022-2032 ($BILLION)
- FIGURE 33. CANADA STAPLE FOOD MARKET, 2022-2032 ($BILLION)
- FIGURE 34. MEXICO STAPLE FOOD MARKET, 2022-2032 ($BILLION)
- FIGURE 35. GERMANY STAPLE FOOD MARKET, 2022-2032 ($BILLION)
- FIGURE 36. UK STAPLE FOOD MARKET, 2022-2032 ($BILLION)
- FIGURE 37. FRANCE STAPLE FOOD MARKET, 2022-2032 ($BILLION)
- FIGURE 38. SPAIN STAPLE FOOD MARKET, 2022-2032 ($BILLION)
- FIGURE 39. ITALY STAPLE FOOD MARKET, 2022-2032 ($BILLION)
- FIGURE 40. REST OF EUROPE STAPLE FOOD MARKET, 2022-2032 ($BILLION)
- FIGURE 41. CHINA STAPLE FOOD MARKET, 2022-2032 ($BILLION)
- FIGURE 42. JAPAN STAPLE FOOD MARKET, 2022-2032 ($BILLION)
- FIGURE 43. INDIA STAPLE FOOD MARKET, 2022-2032 ($BILLION)
- FIGURE 44. SOUTH KOREA STAPLE FOOD MARKET, 2022-2032 ($BILLION)
- FIGURE 45. AUSTRALIA STAPLE FOOD MARKET, 2022-2032 ($BILLION)
- FIGURE 46. REST OF ASIA-PACIFIC STAPLE FOOD MARKET, 2022-2032 ($BILLION)
- FIGURE 47. BRAZIL STAPLE FOOD MARKET, 2022-2032 ($BILLION)
- FIGURE 48. SOUTH AFRICA, STAPLE FOOD MARKET, 2022-2032 ($BILLION)
- FIGURE 49. UNITED ARAB EMIRATES STAPLE FOOD MARKET, 2022-2032 ($BILLION)
- FIGURE 50. SOUTH AFRICA STAPLE FOOD MARKET, 2022-2032 ($BILLION)
- FIGURE 51. REST OF LAMEA STAPLE FOOD MARKET, 2022-2032 ($BILLION)
- FIGURE 52. PRODUCT MAPPING OF TOP 10 PLAYERS
- FIGURE 53. COMPETITIVE DASHBOARD
- FIGURE 54. COMPETITIVE HEATMAP: STAPLE FOOD MARKET
- FIGURE 55. TOP PLAYER POSITIONING, 2022
Have a question?


SELECT AN OPTION
Have a question?
Questions? Please give us a call or visit the contact form.