
PUBLISHER: Allied Market Research | PRODUCT CODE: 1513403

PUBLISHER: Allied Market Research | PRODUCT CODE: 1513403
Flexible Sensor Market By Product Type (Flexible Pressure Sensor, Flexible Gas Sensor), By End-USER (Industrial, Consumer Electronics, Medical, Automotive): Global Opportunity Analysis and Industry Forecast, 2023-2032
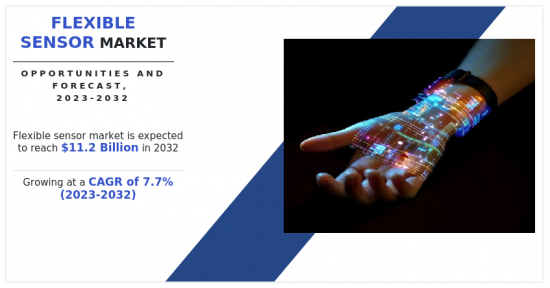
The global flexible sensor market is anticipated to reach $11,184.00 million by 2032, growing from $5,388.70 million in 2022 at a CAGR of 7.7% from 2023 to 2032.
A flexible sensor is a type of sensor that is designed to be bendable or deformable, allowing it to conform to the shape of the object or surface it is applied to. Unlike traditional rigid sensors, flexible sensors are made from materials that can withstand bending, stretching, or other forms of deformation without compromising their functionality. Flexible sensors are used in various applications where conformability and adaptability to irregular shapes are essential. These sensors often employ flexible substrates and materials, such as polymers or flexible electronics, to enable their flexibility. Common examples of flexible sensors include those used in wearable devices, medical applications, robotics, and flexible electronics.
The trend toward electric vehicles (EVs) and autonomous driving has led to increased integration of advanced sensor technologies in vehicles. Flexible sensors play a crucial role in the development of autonomous vehicles by providing real-time data for navigation, obstacle detection, and other safety features. Flexible sensors enable the creation of lightweight and space-efficient designs, aligning with the automotive industry's focus on improving fuel efficiency and overall vehicle performance. These sensors can be seamlessly integrated into curved surfaces, allowing for more creative and aerodynamic vehicle designs.
The automotive industry is increasingly focused on enhancing the human-machine interface within vehicles to provide a more intuitive and interactive driving experience. Flexible sensors are used in the development of touch-sensitive displays, control panels, and other interactive surfaces, contributing to improved user interfaces. The growing consumer demand for in-car connectivity and entertainment systems has led to the incorporation of flexible sensors in the development of interactive and touch-responsive infotainment displays.
The materials used in flexible sensors need to be both flexible and durable. Finding materials that can maintain their structural integrity while being subjected to bending, stretching, and other deformations is a significant challenge. Some materials may degrade over time due to environmental factors such as exposure to moisture, temperature variations, and UV radiation, leading to a decrease in sensor performance.
Frequent bending and flexing can lead to wear and tear in flexible sensors, affecting their overall lifespan. This is a critical concern, especially in applications where sensors undergo continuous movement or mechanical stress. Flexible sensors may be used in diverse environments, including those with extreme temperatures, humidity, and exposure to chemicals. Ensuring that sensors remain reliable under such conditions requires careful consideration of the materials and design to prevent degradation or malfunction.
Flexible sensors can be incorporated into wearable devices to monitor soldiers' health in real-time. This includes tracking vital signs such as heart rate, body temperature, and hydration levels, providing crucial data for medical support and ensuring optimal performance in the field. Flexible sensors can enhance communication devices, enabling hands-free operation and improve situational awareness for soldiers on the battlefield.
Flexible displays with embedded sensors can be integrated into military equipment, providing real-time information, and enhancing situational awareness for soldiers. This includes displaying maps, navigation data, and other critical information directly on flexible surfaces. Flexible displays are generally lighter and more compact than traditional displays, contributing to the development of lightweight and portable military equipment. Flexible sensors can be utilized in camouflage systems to adapt to the surrounding environment, making military vehicles and equipment less visible to the enemy.
The key players profiled in this report include FlexEnable Limited, Brewer Science, Inc., Interlink Electronics, Inc., Peratech Holdco Ltd, TE Connectivity, Bloodhound Technology, Soft Materials, Integrated Device Technology, KEMET Corporation, and ELMOS Semiconductor SE. The market players are continuously striving to achieve a dominant position in this competitive market using strategies such as product innovation and development of flexible sensor.
Key Benefits For Stakeholders
- This report provides a quantitative analysis of the market segments, current trends, estimations, and dynamics of the flexible sensor market analysis from 2022 to 2032 to identify the prevailing flexible sensor market opportunities.
- The market research is offered along with information related to key drivers, restraints, and opportunities.
- Porter's five forces analysis highlights the potency of buyers and suppliers to enable stakeholders make profit-oriented business decisions and strengthen their supplier-buyer network.
- In-depth analysis of the flexible sensor market segmentation assists to determine the prevailing market opportunities.
- Major countries in each region are mapped according to their revenue contribution to the global market.
- Market player positioning facilitates benchmarking and provides a clear understanding of the present position of the market players.
- The report includes the analysis of the regional as well as global flexible sensor market trends, key players, market segments, application areas, and market growth strategies.
Additional benefits you will get with this purchase are:
- Quarterly Update and* (only available with a corporate license, on listed price)
- 5 additional Company Profile of client Choice pre- or Post-purchase, as a free update.
- Free Upcoming Version on the Purchase of Five and Enterprise User License.
- 16 analyst hours of support* (post-purchase, if you find additional data requirements upon review of the report, you may receive support amounting to 16 analyst hours to solve questions, and post-sale queries)
- 15% Free Customization* (in case the scope or segment of the report does not match your requirements, 15% is equivalent to 3 working days of free work, applicable once)
- Free data Pack on the Five and Enterprise User License. (Excel version of the report)
- Free Updated report if the report is 6-12 months old or older.
- 24-hour priority response*
- Free Industry updates and white papers.
Possible Customization with this report (with additional cost and timeline, please talk to the sales executive to know more)
- Consumer Buying Behavior Analysis
- End user preferences and pain points
- Investment Opportunities
- Upcoming/New Entrant by Regions
- Technology Trend Analysis
- Go To Market Strategy
- Market share analysis of players by products/segments
- Pain Point Analysis
- Regulatory Guidelines
- Strategic Recommendations
- Additional company profiles with specific to client's interest
- Additional country or region analysis- market size and forecast
- Criss-cross segment analysis- market size and forecast
- Expanded list for Company Profiles
- Historic market data
- Key player details (including location, contact details, supplier/vendor network etc. in excel format)
- Market share analysis of players at global/region/country level
- SWOT Analysis
Key Market Segments
By Product Type
- Flexible Gas Sensor
- Flexible Pressure Sensor
By End-User
- Industrial
- Consumer Electronics
- Medical
- Automotive
By Region
- North America
- U.S.
- Canada
- Mexico
- Europe
- Germany
- UK
- France
- Spain
- Italy
- Rest of Europe
- Asia-Pacific
- China
- Japan
- India
- South Korea
- Australia
- Rest of Asia-Pacific
- LAMEA
- Brazil
- Saudi Arabia
- UAE
- South Africa
- Rest of LAMEA
Key Market Players:
- KEMET Corporation
- Elmos Semiconductor SE
- Flexenable Limited
- Brewer Science, Inc.
- Interlink Electronics, Inc.
- peratech holdco limited
- TE Connectivity
- Bloodhound Technology
- Soft Materials
- Integrated Device Technology
TABLE OF CONTENTS
CHAPTER 1: INTRODUCTION
- 1.1. Report description
- 1.2. Key market segments
- 1.3. Key benefits to the stakeholders
- 1.4. Research methodology
- 1.4.1. Primary research
- 1.4.2. Secondary research
- 1.4.3. Analyst tools and models
CHAPTER 2: EXECUTIVE SUMMARY
- 2.1. CXO perspective
CHAPTER 3: MARKET OVERVIEW
- 3.1. Market definition and scope
- 3.2. Key findings
- 3.2.1. Top impacting factors
- 3.2.2. Top investment pockets
- 3.3. Porter's five forces analysis
- 3.4. Market dynamics
- 3.4.1. Drivers
- 3.4.2. Restraints
- 3.4.3. Opportunities
- 3.5. Average Selling Price
- 3.6. Market Share Analysis
- 3.7. Brand Share Analysis
- 3.8. Trade Data Analysis
- 3.9. Product Consumption
- 3.10. Value Chain Analysis
- 3.11. Key Players Details
- 3.12. Key Regulation Analysis
- 3.13. Regulatory Guidelines
- 3.14. Patent Landscape
- 3.15. Reimbursement Scenario
CHAPTER 4: FLEXIBLE SENSOR MARKET, BY PRODUCT TYPE
- 4.1. Overview
- 4.1.1. Market size and forecast
- 4.2. Flexible Pressure Sensor
- 4.2.1. Key market trends, growth factors and opportunities
- 4.2.2. Market size and forecast, by region
- 4.2.3. Market share analysis by country
- 4.3. Flexible Gas Sensor
- 4.3.1. Key market trends, growth factors and opportunities
- 4.3.2. Market size and forecast, by region
- 4.3.3. Market share analysis by country
CHAPTER 5: FLEXIBLE SENSOR MARKET, BY END-USER
- 5.1. Overview
- 5.1.1. Market size and forecast
- 5.2. Industrial
- 5.2.1. Key market trends, growth factors and opportunities
- 5.2.2. Market size and forecast, by region
- 5.2.3. Market share analysis by country
- 5.3. Consumer Electronics
- 5.3.1. Key market trends, growth factors and opportunities
- 5.3.2. Market size and forecast, by region
- 5.3.3. Market share analysis by country
- 5.4. Medical
- 5.4.1. Key market trends, growth factors and opportunities
- 5.4.2. Market size and forecast, by region
- 5.4.3. Market share analysis by country
- 5.5. Automotive
- 5.5.1. Key market trends, growth factors and opportunities
- 5.5.2. Market size and forecast, by region
- 5.5.3. Market share analysis by country
CHAPTER 6: FLEXIBLE SENSOR MARKET, BY REGION
- 6.1. Overview
- 6.1.1. Market size and forecast By Region
- 6.2. North America
- 6.2.1. Key market trends, growth factors and opportunities
- 6.2.2. Market size and forecast, by Product Type
- 6.2.3. Market size and forecast, by End-USER
- 6.2.4. Market size and forecast, by country
- 6.2.4.1. U.S.
- 6.2.4.1.1. Market size and forecast, by Product Type
- 6.2.4.1.2. Market size and forecast, by End-USER
- 6.2.4.2. Canada
- 6.2.4.2.1. Market size and forecast, by Product Type
- 6.2.4.2.2. Market size and forecast, by End-USER
- 6.2.4.3. Mexico
- 6.2.4.3.1. Market size and forecast, by Product Type
- 6.2.4.3.2. Market size and forecast, by End-USER
- 6.3. Europe
- 6.3.1. Key market trends, growth factors and opportunities
- 6.3.2. Market size and forecast, by Product Type
- 6.3.3. Market size and forecast, by End-USER
- 6.3.4. Market size and forecast, by country
- 6.3.4.1. Germany
- 6.3.4.1.1. Market size and forecast, by Product Type
- 6.3.4.1.2. Market size and forecast, by End-USER
- 6.3.4.2. UK
- 6.3.4.2.1. Market size and forecast, by Product Type
- 6.3.4.2.2. Market size and forecast, by End-USER
- 6.3.4.3. France
- 6.3.4.3.1. Market size and forecast, by Product Type
- 6.3.4.3.2. Market size and forecast, by End-USER
- 6.3.4.4. Spain
- 6.3.4.4.1. Market size and forecast, by Product Type
- 6.3.4.4.2. Market size and forecast, by End-USER
- 6.3.4.5. Italy
- 6.3.4.5.1. Market size and forecast, by Product Type
- 6.3.4.5.2. Market size and forecast, by End-USER
- 6.3.4.6. Rest of Europe
- 6.3.4.6.1. Market size and forecast, by Product Type
- 6.3.4.6.2. Market size and forecast, by End-USER
- 6.4. Asia-Pacific
- 6.4.1. Key market trends, growth factors and opportunities
- 6.4.2. Market size and forecast, by Product Type
- 6.4.3. Market size and forecast, by End-USER
- 6.4.4. Market size and forecast, by country
- 6.4.4.1. China
- 6.4.4.1.1. Market size and forecast, by Product Type
- 6.4.4.1.2. Market size and forecast, by End-USER
- 6.4.4.2. Japan
- 6.4.4.2.1. Market size and forecast, by Product Type
- 6.4.4.2.2. Market size and forecast, by End-USER
- 6.4.4.3. India
- 6.4.4.3.1. Market size and forecast, by Product Type
- 6.4.4.3.2. Market size and forecast, by End-USER
- 6.4.4.4. South Korea
- 6.4.4.4.1. Market size and forecast, by Product Type
- 6.4.4.4.2. Market size and forecast, by End-USER
- 6.4.4.5. Australia
- 6.4.4.5.1. Market size and forecast, by Product Type
- 6.4.4.5.2. Market size and forecast, by End-USER
- 6.4.4.6. Rest of Asia-Pacific
- 6.4.4.6.1. Market size and forecast, by Product Type
- 6.4.4.6.2. Market size and forecast, by End-USER
- 6.5. LAMEA
- 6.5.1. Key market trends, growth factors and opportunities
- 6.5.2. Market size and forecast, by Product Type
- 6.5.3. Market size and forecast, by End-USER
- 6.5.4. Market size and forecast, by country
- 6.5.4.1. Brazil
- 6.5.4.1.1. Market size and forecast, by Product Type
- 6.5.4.1.2. Market size and forecast, by End-USER
- 6.5.4.2. Saudi Arabia
- 6.5.4.2.1. Market size and forecast, by Product Type
- 6.5.4.2.2. Market size and forecast, by End-USER
- 6.5.4.3. UAE
- 6.5.4.3.1. Market size and forecast, by Product Type
- 6.5.4.3.2. Market size and forecast, by End-USER
- 6.5.4.4. South Africa
- 6.5.4.4.1. Market size and forecast, by Product Type
- 6.5.4.4.2. Market size and forecast, by End-USER
- 6.5.4.5. Rest of LAMEA
- 6.5.4.5.1. Market size and forecast, by Product Type
- 6.5.4.5.2. Market size and forecast, by End-USER
CHAPTER 7: COMPETITIVE LANDSCAPE
- 7.1. Introduction
- 7.2. Top winning strategies
- 7.3. Product mapping of top 10 player
- 7.4. Competitive dashboard
- 7.5. Competitive heatmap
- 7.6. Top player positioning, 2022
CHAPTER 8: COMPANY PROFILES
- 8.1. KEMET Corporation
- 8.1.1. Company overview
- 8.1.2. Key executives
- 8.1.3. Company snapshot
- 8.2. Elmos Semiconductor SE
- 8.2.1. Company overview
- 8.2.2. Key executives
- 8.2.3. Company snapshot
- 8.3. Flexenable Limited
- 8.3.1. Company overview
- 8.3.2. Key executives
- 8.3.3. Company snapshot
- 8.4. Brewer Science, Inc.
- 8.4.1. Company overview
- 8.4.2. Key executives
- 8.4.3. Company snapshot
- 8.5. Interlink Electronics, Inc.
- 8.5.1. Company overview
- 8.5.2. Key executives
- 8.5.3. Company snapshot
- 8.6. peratech holdco limited
- 8.6.1. Company overview
- 8.6.2. Key executives
- 8.6.3. Company snapshot
- 8.7. TE Connectivity
- 8.7.1. Company overview
- 8.7.2. Key executives
- 8.7.3. Company snapshot
- 8.8. Bloodhound Technology
- 8.8.1. Company overview
- 8.8.2. Key executives
- 8.8.3. Company snapshot
- 8.9. Soft Materials
- 8.9.1. Company overview
- 8.9.2. Key executives
- 8.9.3. Company snapshot
- 8.10. Integrated Device Technology
- 8.10.1. Company overview
- 8.10.2. Key executives
- 8.10.3. Company snapshot
LIST OF TABLES
- TABLE 01. GLOBAL FLEXIBLE SENSOR MARKET, BY PRODUCT TYPE, 2022-2032 ($MILLION)
- TABLE 02. FLEXIBLE SENSOR MARKET FOR FLEXIBLE PRESSURE SENSOR, BY REGION, 2022-2032 ($MILLION)
- TABLE 03. FLEXIBLE SENSOR MARKET FOR FLEXIBLE GAS SENSOR, BY REGION, 2022-2032 ($MILLION)
- TABLE 04. GLOBAL FLEXIBLE SENSOR MARKET, BY END-USER, 2022-2032 ($MILLION)
- TABLE 05. FLEXIBLE SENSOR MARKET FOR INDUSTRIAL, BY REGION, 2022-2032 ($MILLION)
- TABLE 06. FLEXIBLE SENSOR MARKET FOR CONSUMER ELECTRONICS, BY REGION, 2022-2032 ($MILLION)
- TABLE 07. FLEXIBLE SENSOR MARKET FOR MEDICAL, BY REGION, 2022-2032 ($MILLION)
- TABLE 08. FLEXIBLE SENSOR MARKET FOR AUTOMOTIVE, BY REGION, 2022-2032 ($MILLION)
- TABLE 09. FLEXIBLE SENSOR MARKET, BY REGION, 2022-2032 ($MILLION)
- TABLE 10. NORTH AMERICA FLEXIBLE SENSOR MARKET, BY PRODUCT TYPE, 2022-2032 ($MILLION)
- TABLE 11. NORTH AMERICA FLEXIBLE SENSOR MARKET, BY END-USER, 2022-2032 ($MILLION)
- TABLE 12. NORTH AMERICA FLEXIBLE SENSOR MARKET, BY COUNTRY, 2022-2032 ($MILLION)
- TABLE 13. U.S. FLEXIBLE SENSOR MARKET, BY PRODUCT TYPE, 2022-2032 ($MILLION)
- TABLE 14. U.S. FLEXIBLE SENSOR MARKET, BY END-USER, 2022-2032 ($MILLION)
- TABLE 15. CANADA FLEXIBLE SENSOR MARKET, BY PRODUCT TYPE, 2022-2032 ($MILLION)
- TABLE 16. CANADA FLEXIBLE SENSOR MARKET, BY END-USER, 2022-2032 ($MILLION)
- TABLE 17. MEXICO FLEXIBLE SENSOR MARKET, BY PRODUCT TYPE, 2022-2032 ($MILLION)
- TABLE 18. MEXICO FLEXIBLE SENSOR MARKET, BY END-USER, 2022-2032 ($MILLION)
- TABLE 19. EUROPE FLEXIBLE SENSOR MARKET, BY PRODUCT TYPE, 2022-2032 ($MILLION)
- TABLE 20. EUROPE FLEXIBLE SENSOR MARKET, BY END-USER, 2022-2032 ($MILLION)
- TABLE 21. EUROPE FLEXIBLE SENSOR MARKET, BY COUNTRY, 2022-2032 ($MILLION)
- TABLE 22. GERMANY FLEXIBLE SENSOR MARKET, BY PRODUCT TYPE, 2022-2032 ($MILLION)
- TABLE 23. GERMANY FLEXIBLE SENSOR MARKET, BY END-USER, 2022-2032 ($MILLION)
- TABLE 24. UK FLEXIBLE SENSOR MARKET, BY PRODUCT TYPE, 2022-2032 ($MILLION)
- TABLE 25. UK FLEXIBLE SENSOR MARKET, BY END-USER, 2022-2032 ($MILLION)
- TABLE 26. FRANCE FLEXIBLE SENSOR MARKET, BY PRODUCT TYPE, 2022-2032 ($MILLION)
- TABLE 27. FRANCE FLEXIBLE SENSOR MARKET, BY END-USER, 2022-2032 ($MILLION)
- TABLE 28. SPAIN FLEXIBLE SENSOR MARKET, BY PRODUCT TYPE, 2022-2032 ($MILLION)
- TABLE 29. SPAIN FLEXIBLE SENSOR MARKET, BY END-USER, 2022-2032 ($MILLION)
- TABLE 30. ITALY FLEXIBLE SENSOR MARKET, BY PRODUCT TYPE, 2022-2032 ($MILLION)
- TABLE 31. ITALY FLEXIBLE SENSOR MARKET, BY END-USER, 2022-2032 ($MILLION)
- TABLE 32. REST OF EUROPE FLEXIBLE SENSOR MARKET, BY PRODUCT TYPE, 2022-2032 ($MILLION)
- TABLE 33. REST OF EUROPE FLEXIBLE SENSOR MARKET, BY END-USER, 2022-2032 ($MILLION)
- TABLE 34. ASIA-PACIFIC FLEXIBLE SENSOR MARKET, BY PRODUCT TYPE, 2022-2032 ($MILLION)
- TABLE 35. ASIA-PACIFIC FLEXIBLE SENSOR MARKET, BY END-USER, 2022-2032 ($MILLION)
- TABLE 36. ASIA-PACIFIC FLEXIBLE SENSOR MARKET, BY COUNTRY, 2022-2032 ($MILLION)
- TABLE 37. CHINA FLEXIBLE SENSOR MARKET, BY PRODUCT TYPE, 2022-2032 ($MILLION)
- TABLE 38. CHINA FLEXIBLE SENSOR MARKET, BY END-USER, 2022-2032 ($MILLION)
- TABLE 39. JAPAN FLEXIBLE SENSOR MARKET, BY PRODUCT TYPE, 2022-2032 ($MILLION)
- TABLE 40. JAPAN FLEXIBLE SENSOR MARKET, BY END-USER, 2022-2032 ($MILLION)
- TABLE 41. INDIA FLEXIBLE SENSOR MARKET, BY PRODUCT TYPE, 2022-2032 ($MILLION)
- TABLE 42. INDIA FLEXIBLE SENSOR MARKET, BY END-USER, 2022-2032 ($MILLION)
- TABLE 43. SOUTH KOREA FLEXIBLE SENSOR MARKET, BY PRODUCT TYPE, 2022-2032 ($MILLION)
- TABLE 44. SOUTH KOREA FLEXIBLE SENSOR MARKET, BY END-USER, 2022-2032 ($MILLION)
- TABLE 45. AUSTRALIA FLEXIBLE SENSOR MARKET, BY PRODUCT TYPE, 2022-2032 ($MILLION)
- TABLE 46. AUSTRALIA FLEXIBLE SENSOR MARKET, BY END-USER, 2022-2032 ($MILLION)
- TABLE 47. REST OF ASIA-PACIFIC FLEXIBLE SENSOR MARKET, BY PRODUCT TYPE, 2022-2032 ($MILLION)
- TABLE 48. REST OF ASIA-PACIFIC FLEXIBLE SENSOR MARKET, BY END-USER, 2022-2032 ($MILLION)
- TABLE 49. LAMEA FLEXIBLE SENSOR MARKET, BY PRODUCT TYPE, 2022-2032 ($MILLION)
- TABLE 50. LAMEA FLEXIBLE SENSOR MARKET, BY END-USER, 2022-2032 ($MILLION)
- TABLE 51. LAMEA FLEXIBLE SENSOR MARKET, BY COUNTRY, 2022-2032 ($MILLION)
- TABLE 52. BRAZIL FLEXIBLE SENSOR MARKET, BY PRODUCT TYPE, 2022-2032 ($MILLION)
- TABLE 53. BRAZIL FLEXIBLE SENSOR MARKET, BY END-USER, 2022-2032 ($MILLION)
- TABLE 54. SAUDI ARABIA FLEXIBLE SENSOR MARKET, BY PRODUCT TYPE, 2022-2032 ($MILLION)
- TABLE 55. SAUDI ARABIA FLEXIBLE SENSOR MARKET, BY END-USER, 2022-2032 ($MILLION)
- TABLE 56. UAE FLEXIBLE SENSOR MARKET, BY PRODUCT TYPE, 2022-2032 ($MILLION)
- TABLE 57. UAE FLEXIBLE SENSOR MARKET, BY END-USER, 2022-2032 ($MILLION)
- TABLE 58. SOUTH AFRICA FLEXIBLE SENSOR MARKET, BY PRODUCT TYPE, 2022-2032 ($MILLION)
- TABLE 59. SOUTH AFRICA FLEXIBLE SENSOR MARKET, BY END-USER, 2022-2032 ($MILLION)
- TABLE 60. REST OF LAMEA FLEXIBLE SENSOR MARKET, BY PRODUCT TYPE, 2022-2032 ($MILLION)
- TABLE 61. REST OF LAMEA FLEXIBLE SENSOR MARKET, BY END-USER, 2022-2032 ($MILLION)
- TABLE 62. KEMET CORPORATION: KEY EXECUTIVES
- TABLE 63. KEMET CORPORATION: COMPANY SNAPSHOT
- TABLE 64. ELMOS SEMICONDUCTOR SE: KEY EXECUTIVES
- TABLE 65. ELMOS SEMICONDUCTOR SE: COMPANY SNAPSHOT
- TABLE 66. FLEXENABLE LIMITED: KEY EXECUTIVES
- TABLE 67. FLEXENABLE LIMITED: COMPANY SNAPSHOT
- TABLE 68. BREWER SCIENCE, INC.: KEY EXECUTIVES
- TABLE 69. BREWER SCIENCE, INC.: COMPANY SNAPSHOT
- TABLE 70. INTERLINK ELECTRONICS, INC.: KEY EXECUTIVES
- TABLE 71. INTERLINK ELECTRONICS, INC.: COMPANY SNAPSHOT
- TABLE 72. PERATECH HOLDCO LIMITED: KEY EXECUTIVES
- TABLE 73. PERATECH HOLDCO LIMITED: COMPANY SNAPSHOT
- TABLE 74. TE CONNECTIVITY: KEY EXECUTIVES
- TABLE 75. TE CONNECTIVITY: COMPANY SNAPSHOT
- TABLE 76. BLOODHOUND TECHNOLOGY: KEY EXECUTIVES
- TABLE 77. BLOODHOUND TECHNOLOGY: COMPANY SNAPSHOT
- TABLE 78. SOFT MATERIALS: KEY EXECUTIVES
- TABLE 79. SOFT MATERIALS: COMPANY SNAPSHOT
- TABLE 80. INTEGRATED DEVICE TECHNOLOGY: KEY EXECUTIVES
- TABLE 81. INTEGRATED DEVICE TECHNOLOGY: COMPANY SNAPSHOT
LIST OF FIGURES
- FIGURE 01. FLEXIBLE SENSOR MARKET, 2022-2032
- FIGURE 02. SEGMENTATION OF FLEXIBLE SENSOR MARKET,2022-2032
- FIGURE 03. TOP IMPACTING FACTORS IN FLEXIBLE SENSOR MARKET
- FIGURE 04. TOP INVESTMENT POCKETS IN FLEXIBLE SENSOR MARKET (2023-2032)
- FIGURE 05. BARGAINING POWER OF SUPPLIERS
- FIGURE 06. BARGAINING POWER OF BUYERS
- FIGURE 07. THREAT OF SUBSTITUTION
- FIGURE 08. THREAT OF SUBSTITUTION
- FIGURE 09. COMPETITIVE RIVALRY
- FIGURE 10. GLOBAL FLEXIBLE SENSOR MARKET:DRIVERS, RESTRAINTS AND OPPORTUNITIES
- FIGURE 11. IMPACT OF KEY REGULATION: FLEXIBLE SENSOR MARKET
- FIGURE 12. PATENT ANALYSIS BY COMPANY
- FIGURE 13. PATENT ANALYSIS BY COUNTRY
- FIGURE 14. FLEXIBLE SENSOR MARKET, BY PRODUCT TYPE, 2022 AND 2032(%)
- FIGURE 15. COMPARATIVE SHARE ANALYSIS OF FLEXIBLE SENSOR MARKET FOR FLEXIBLE PRESSURE SENSOR, BY COUNTRY 2022 AND 2032(%)
- FIGURE 16. COMPARATIVE SHARE ANALYSIS OF FLEXIBLE SENSOR MARKET FOR FLEXIBLE GAS SENSOR, BY COUNTRY 2022 AND 2032(%)
- FIGURE 17. FLEXIBLE SENSOR MARKET, BY END-USER, 2022 AND 2032(%)
- FIGURE 18. COMPARATIVE SHARE ANALYSIS OF FLEXIBLE SENSOR MARKET FOR INDUSTRIAL, BY COUNTRY 2022 AND 2032(%)
- FIGURE 19. COMPARATIVE SHARE ANALYSIS OF FLEXIBLE SENSOR MARKET FOR CONSUMER ELECTRONICS, BY COUNTRY 2022 AND 2032(%)
- FIGURE 20. COMPARATIVE SHARE ANALYSIS OF FLEXIBLE SENSOR MARKET FOR MEDICAL, BY COUNTRY 2022 AND 2032(%)
- FIGURE 21. COMPARATIVE SHARE ANALYSIS OF FLEXIBLE SENSOR MARKET FOR AUTOMOTIVE, BY COUNTRY 2022 AND 2032(%)
- FIGURE 22. FLEXIBLE SENSOR MARKET BY REGION, 2022 AND 2032(%)
- FIGURE 23. U.S. FLEXIBLE SENSOR MARKET, 2022-2032 ($MILLION)
- FIGURE 24. CANADA FLEXIBLE SENSOR MARKET, 2022-2032 ($MILLION)
- FIGURE 25. MEXICO FLEXIBLE SENSOR MARKET, 2022-2032 ($MILLION)
- FIGURE 26. GERMANY FLEXIBLE SENSOR MARKET, 2022-2032 ($MILLION)
- FIGURE 27. UK FLEXIBLE SENSOR MARKET, 2022-2032 ($MILLION)
- FIGURE 28. FRANCE FLEXIBLE SENSOR MARKET, 2022-2032 ($MILLION)
- FIGURE 29. SPAIN FLEXIBLE SENSOR MARKET, 2022-2032 ($MILLION)
- FIGURE 30. ITALY FLEXIBLE SENSOR MARKET, 2022-2032 ($MILLION)
- FIGURE 31. REST OF EUROPE FLEXIBLE SENSOR MARKET, 2022-2032 ($MILLION)
- FIGURE 32. CHINA FLEXIBLE SENSOR MARKET, 2022-2032 ($MILLION)
- FIGURE 33. JAPAN FLEXIBLE SENSOR MARKET, 2022-2032 ($MILLION)
- FIGURE 34. INDIA FLEXIBLE SENSOR MARKET, 2022-2032 ($MILLION)
- FIGURE 35. SOUTH KOREA FLEXIBLE SENSOR MARKET, 2022-2032 ($MILLION)
- FIGURE 36. AUSTRALIA FLEXIBLE SENSOR MARKET, 2022-2032 ($MILLION)
- FIGURE 37. REST OF ASIA-PACIFIC FLEXIBLE SENSOR MARKET, 2022-2032 ($MILLION)
- FIGURE 38. BRAZIL FLEXIBLE SENSOR MARKET, 2022-2032 ($MILLION)
- FIGURE 39. SAUDI ARABIA FLEXIBLE SENSOR MARKET, 2022-2032 ($MILLION)
- FIGURE 40. UAE FLEXIBLE SENSOR MARKET, 2022-2032 ($MILLION)
- FIGURE 41. SOUTH AFRICA FLEXIBLE SENSOR MARKET, 2022-2032 ($MILLION)
- FIGURE 42. REST OF LAMEA FLEXIBLE SENSOR MARKET, 2022-2032 ($MILLION)
- FIGURE 43. PRODUCT MAPPING OF TOP 10 PLAYERS
- FIGURE 44. COMPETITIVE DASHBOARD
- FIGURE 45. COMPETITIVE HEATMAP: FLEXIBLE SENSOR MARKET
- FIGURE 46. TOP PLAYER POSITIONING, 2022

