
PUBLISHER: Allied Market Research | PRODUCT CODE: 1513387

PUBLISHER: Allied Market Research | PRODUCT CODE: 1513387
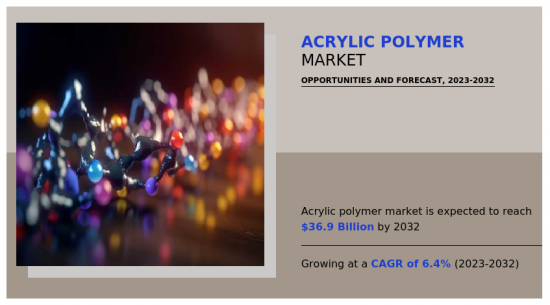
Acrylic Polymer Market By Type, By Application : Global Opportunity Analysis and Industry Forecast, 2023-2032
The acrylic polymers market was valued at $20.0 billion in 2022 and is estimated to reach $36.9 billion by 2032, exhibiting a CAGR of 6.4% from 2023 to 2032.
Factors such as increase in disposable income, technological upgrades, and spurring rise in original equipment manufacturers (OEMs) have led the automotive sector to witness a significant growth. For instance, according to an article published by The China Association of Automobile Manufacturers in January 2023, China's auto sell rose by 9.5% in 2022 as compared to 2021 owing to rise in sales of electric vehicles in the country.
Acrylic polymers play a critical role in enhancing the performance, aesthetics, and durability of automotive components, contributing to the advancement of modern vehicles. Their diverse properties make them indispensable across various automotive applications, from coatings and adhesives to interior trim and lighting. This factor is expected to foster the demand for acrylic polymer in the rise in automotive sector; thus, fueling the growth of the acrylic polymers market.
Furthermore, One of the primary reasons for the growing preference for water-based acrylic coatings is their eco-friendliness. These coatings have lower levels of volatile organic compounds (VOCs) as compared to solvent-based coatings. VOCs are harmful air pollutants that contribute to air quality deterioration and pose health risks to humans and the environment. As environmental regulations become more stringent worldwide, there is a greater emphasis on reducing VOC emissions, driving the shift towards water-based coatings. Additionally, water-based acrylic coatings align with sustainability initiatives pursued by many industries and consumers. With growth in awareness of environmental issues such as climate change and resource depletion, businesses are under pressure to adopt more sustainable practices. Water-based coatings, being less harmful to the environment, contribute to these sustainability goals, making them a preferred choice for environmentally conscious consumers and companies.
Furthermore, water-based acrylic coatings offer improved safety and health benefits compared to solvent-based coatings. They have lower toxicity levels, reducing the risks associated with exposure during application and use. This makes water-based coatings more suitable for indoor applications where ventilation may be limited, such as in residential and commercial buildings.
Moreover, technological advancements have also played a crucial role in enhancing the performance of water-based acrylic coatings. Manufacturers have developed formulations that provide excellent adhesion, durability, and resistance to various environmental factors such as UV radiation, moisture, and abrasion. These coatings can now achieve similar or even superior performance compared to solvent-based alternatives, driving wider adoption across different applications. These factors altogether are expected to surge the demand for water-based acrylic coatings across numerous end-use industries; thus, augmenting the growth of the acrylic polymers market.
However, one significant restraint facing the acrylic polymers market is the volatility in the prices of raw materials. Acrylic polymers are derived from petrochemical sources, primarily acrylic acid and methacrylic acid, which are sensitive to fluctuations in crude oil prices. Any instability in oil prices can directly impact the production costs of acrylic polymers, affecting profit margins for manufacturers. Additionally, the availability of raw materials can also be influenced by geopolitical factors, trade tensions, and supply chain disruptions, further exacerbating price volatility and uncertainty for industry players.
On the contrary, one significant opportunity for the acrylic polymers market lies in the growing demand for lightweight materials across various industries, including automotive, aerospace, packaging, and construction. Acrylic polymers offer a favorable combination of properties, including high strength-to-weight ratio, durability, and design flexibility, making them well-suited for lightweight applications. With increasing emphasis on fuel efficiency, emissions reduction, and sustainability, there is a growing need for lightweight materials that can help manufacturers achieve these objectives. Acrylic polymers can play a crucial role in meeting this demand by providing lightweight solutions for automotive components, aircraft interiors, packaging materials, and building materials, thereby opening new opportunities for market growth and expansion.
Moreover, another significant opportunity for the acrylic polymers market is the rising demand for sustainable solutions and eco-friendly materials. As awareness of environmental issues continues to grow, consumers, regulators, and businesses are increasingly prioritizing sustainability and seeking alternatives to conventional plastics derived from fossil fuels. Acrylic polymers can capitalize on this trend by offering sustainable solutions such as bio-based acrylics, recycled acrylics, and biodegradable acrylics. These eco-friendly alternatives can help reduce reliance on petrochemicals, minimize carbon footprint, and mitigate plastic pollution, thereby addressing the sustainability concerns of stakeholders across the value chain. By investing in research and development, innovation, and collaboration with partners in the bio-based and recycling industries, acrylic polymer manufacturers can position themselves as leaders in sustainable materials and capture new market opportunities.
The acrylic polymers market is segmented on the basis of type, application, and region. On the basis of type, the market is categorized into solvent borne and water borne. By application, the market is divided into paints and coatings, adhesives and sealants, industrial water treatment additives, textiles, cleaning/detergents, super absorbent polymer, and others. Region-wise, the market is studied across North America, Europe, Asia-Pacific, and LAMEA.
The global acrylic polymers market profiles leading players that include Dow Inc., BASF SE, Arkema, DuPont, Mitsui Chemicals, Inc., NIPPON SHOKUBAI. CO. LTD, The Lubrizol Corporation, Ashland Inc, TOAGOSEI CO., LTD., and Sumitomo Chemical Co., Ltd. The global acrylic polymers market report provides in-depth competitive analysis as well as profiles of these major players.
Key Benefits For Stakeholders
- This report provides a quantitative analysis of the market segments, current trends, estimations, and dynamics of the acrylic polymer market analysis from 2022 to 2032 to identify the prevailing acrylic polymer market opportunities.
- The market research is offered along with information related to key drivers, restraints, and opportunities.
- Porter's five forces analysis highlights the potency of buyers and suppliers to enable stakeholders make profit-oriented business decisions and strengthen their supplier-buyer network.
- In-depth analysis of the acrylic polymer market segmentation assists to determine the prevailing market opportunities.
- Major countries in each region are mapped according to their revenue contribution to the global market.
- Market player positioning facilitates benchmarking and provides a clear understanding of the present position of the market players.
- The report includes the analysis of the regional as well as global acrylic polymer market trends, key players, market segments, application areas, and market growth strategies.
Additional benefits you will get with this purchase are:
- Quarterly Update and* (only available with a corporate license, on listed price)
- 5 additional Company Profile of client Choice pre- or Post-purchase, as a free update.
- Free Upcoming Version on the Purchase of Five and Enterprise User License.
- 16 analyst hours of support* (post-purchase, if you find additional data requirements upon review of the report, you may receive support amounting to 16 analyst hours to solve questions, and post-sale queries)
- 15% Free Customization* (in case the scope or segment of the report does not match your requirements, 15% is equivalent to 3 working days of free work, applicable once)
- Free data Pack on the Five and Enterprise User License. (Excel version of the report)
- Free Updated report if the report is 6-12 months old or older.
- 24-hour priority response*
- Free Industry updates and white papers.
Possible Customization with this report (with additional cost and timeline, please talk to the sales executive to know more)
- Analysis of raw material in a product (by %)
- Installed Base analysis
- Investment Opportunities
- Product Benchmarking / Product specification and applications
- Product Life Cycles
- Technology Trend Analysis
- Pain Point Analysis
- Regulatory Guidelines
- Additional company profiles with specific to client's interest
- Additional country or region analysis- market size and forecast
- Criss-cross segment analysis- market size and forecast
- Expanded list for Company Profiles
- Historic market data
- Import Export Analysis/Data
- SWOT Analysis
- Volume Market Size and Forecast
Key Market Segments
By Type
- Solvent Borne
- Water Borne
By Application
- Paints and Coatings
- Adhesives and Sealants
- Industrial water treatment additives
- Textiles
- Cleaning/Detergents
- Super Absorbent Polymer
- Others
By Region
- North America
- U.S.
- Canada
- Mexico
- Europe
- Germany
- UK
- France
- Spain
- Italy
- Rest of Europe
- Asia-Pacific
- China
- India
- Japan
- South Korea
- Rest of Asia-Pacific
- LAMEA
- Brazil
- Saudi Arabia
- South Africa
- Rest of LAMEA
Key Market Players:
- Dow Inc.
- BASF SE
- Arkema
- DuPont
- Mitsui Chemicals, Inc.
- NIPPON SHOKUBAI. CO. LTD
- The Lubrizol Corporation
- Ashland Inc
- TOAGOSEI CO., LTD.
- Sumitomo Chemical Co., Ltd.
TABLE OF CONTENTS
CHAPTER 1: INTRODUCTION
- 1.1. Report description
- 1.2. Key market segments
- 1.3. Key benefits to the stakeholders
- 1.4. Research methodology
- 1.4.1. Primary research
- 1.4.2. Secondary research
- 1.4.3. Analyst tools and models
CHAPTER 2: EXECUTIVE SUMMARY
- 2.1. CXO perspective
CHAPTER 3: MARKET OVERVIEW
- 3.1. Market definition and scope
- 3.2. Key findings
- 3.2.1. Top impacting factors
- 3.2.2. Top investment pockets
- 3.3. Porter's five forces analysis
- 3.3.1. Moderate bargaining power of suppliers
- 3.3.2. Moderate threat of new entrants
- 3.3.3. Moderate threat of substitutes
- 3.3.4. Moderate intensity of rivalry
- 3.3.5. Moderate bargaining power of buyers
- 3.4. Market dynamics
- 3.4.1. Drivers
- 3.4.1.1. Escalating demand from architecture sector
- 3.4.1.2. Robust demand from the automotive sector
- 3.4.1.3. Rise in preference for water-based acrylic coatings
- 3.4.1.4. Rise in demand from packaging sector
- 3.4.1.5. Growth in textile sector
- 3.4.2. Restraints
- 3.4.2.1. Volatility in raw material prices
- 3.4.2.2. Environmental concerns and sustainability
- 3.4.2.3. Availability of substitutes
- 3.4.3. Opportunities
- 3.4.3.1. Growth in demand for lightweight material
- 3.4.3.2. Rise in demand for sustainable solutions
- 3.4.3.3. Advancements in additive manufacturing (3D printing)
- 3.4.3.4. Customization and specialty applications
- 3.4.1. Drivers
- 3.5. Value Chain Analysis
- 3.6. Pricing Analysis
- 3.7. Key Regulation Analysis
- 3.8. Patent Landscape
CHAPTER 4: ACRYLIC POLYMER MARKET, BY TYPE
- 4.1. Overview
- 4.1.1. Market size and forecast
- 4.2. Solvent Borne
- 4.2.1. Key market trends, growth factors and opportunities
- 4.2.2. Market size and forecast, by region
- 4.2.3. Market share analysis by country
- 4.3. Water Borne
- 4.3.1. Key market trends, growth factors and opportunities
- 4.3.2. Market size and forecast, by region
- 4.3.3. Market share analysis by country
CHAPTER 5: ACRYLIC POLYMER MARKET, BY APPLICATION
- 5.1. Overview
- 5.1.1. Market size and forecast
- 5.2. Paints and Coatings
- 5.2.1. Key market trends, growth factors and opportunities
- 5.2.2. Market size and forecast, by region
- 5.2.3. Market share analysis by country
- 5.3. Adhesives and Sealants
- 5.3.1. Key market trends, growth factors and opportunities
- 5.3.2. Market size and forecast, by region
- 5.3.3. Market share analysis by country
- 5.4. Industrial water treatment additives
- 5.4.1. Key market trends, growth factors and opportunities
- 5.4.2. Market size and forecast, by region
- 5.4.3. Market share analysis by country
- 5.5. Textiles
- 5.5.1. Key market trends, growth factors and opportunities
- 5.5.2. Market size and forecast, by region
- 5.5.3. Market share analysis by country
- 5.6. Cleaning/Detergents
- 5.6.1. Key market trends, growth factors and opportunities
- 5.6.2. Market size and forecast, by region
- 5.6.3. Market share analysis by country
- 5.7. Super Absorbent Polymer
- 5.7.1. Key market trends, growth factors and opportunities
- 5.7.2. Market size and forecast, by region
- 5.7.3. Market share analysis by country
- 5.8. Others
- 5.8.1. Key market trends, growth factors and opportunities
- 5.8.2. Market size and forecast, by region
- 5.8.3. Market share analysis by country
CHAPTER 6: ACRYLIC POLYMER MARKET, BY REGION
- 6.1. Overview
- 6.1.1. Market size and forecast By Region
- 6.2. North America
- 6.2.1. Key market trends, growth factors and opportunities
- 6.2.2. Market size and forecast, by Type
- 6.2.3. Market size and forecast, by Application
- 6.2.4. Market size and forecast, by country
- 6.2.4.1. U.S.
- 6.2.4.1.1. Market size and forecast, by Type
- 6.2.4.1.2. Market size and forecast, by Application
- 6.2.4.2. Canada
- 6.2.4.2.1. Market size and forecast, by Type
- 6.2.4.2.2. Market size and forecast, by Application
- 6.2.4.3. Mexico
- 6.2.4.3.1. Market size and forecast, by Type
- 6.2.4.3.2. Market size and forecast, by Application
- 6.3. Europe
- 6.3.1. Key market trends, growth factors and opportunities
- 6.3.2. Market size and forecast, by Type
- 6.3.3. Market size and forecast, by Application
- 6.3.4. Market size and forecast, by country
- 6.3.4.1. Germany
- 6.3.4.1.1. Market size and forecast, by Type
- 6.3.4.1.2. Market size and forecast, by Application
- 6.3.4.2. UK
- 6.3.4.2.1. Market size and forecast, by Type
- 6.3.4.2.2. Market size and forecast, by Application
- 6.3.4.3. France
- 6.3.4.3.1. Market size and forecast, by Type
- 6.3.4.3.2. Market size and forecast, by Application
- 6.3.4.4. Spain
- 6.3.4.4.1. Market size and forecast, by Type
- 6.3.4.4.2. Market size and forecast, by Application
- 6.3.4.5. Italy
- 6.3.4.5.1. Market size and forecast, by Type
- 6.3.4.5.2. Market size and forecast, by Application
- 6.3.4.6. Rest of Europe
- 6.3.4.6.1. Market size and forecast, by Type
- 6.3.4.6.2. Market size and forecast, by Application
- 6.4. Asia-Pacific
- 6.4.1. Key market trends, growth factors and opportunities
- 6.4.2. Market size and forecast, by Type
- 6.4.3. Market size and forecast, by Application
- 6.4.4. Market size and forecast, by country
- 6.4.4.1. China
- 6.4.4.1.1. Market size and forecast, by Type
- 6.4.4.1.2. Market size and forecast, by Application
- 6.4.4.2. India
- 6.4.4.2.1. Market size and forecast, by Type
- 6.4.4.2.2. Market size and forecast, by Application
- 6.4.4.3. Japan
- 6.4.4.3.1. Market size and forecast, by Type
- 6.4.4.3.2. Market size and forecast, by Application
- 6.4.4.4. South Korea
- 6.4.4.4.1. Market size and forecast, by Type
- 6.4.4.4.2. Market size and forecast, by Application
- 6.4.4.5. Rest of Asia-Pacific
- 6.4.4.5.1. Market size and forecast, by Type
- 6.4.4.5.2. Market size and forecast, by Application
- 6.5. LAMEA
- 6.5.1. Key market trends, growth factors and opportunities
- 6.5.2. Market size and forecast, by Type
- 6.5.3. Market size and forecast, by Application
- 6.5.4. Market size and forecast, by country
- 6.5.4.1. Brazil
- 6.5.4.1.1. Market size and forecast, by Type
- 6.5.4.1.2. Market size and forecast, by Application
- 6.5.4.2. Saudi Arabia
- 6.5.4.2.1. Market size and forecast, by Type
- 6.5.4.2.2. Market size and forecast, by Application
- 6.5.4.3. South Africa
- 6.5.4.3.1. Market size and forecast, by Type
- 6.5.4.3.2. Market size and forecast, by Application
- 6.5.4.4. Rest of LAMEA
- 6.5.4.4.1. Market size and forecast, by Type
- 6.5.4.4.2. Market size and forecast, by Application
CHAPTER 7: COMPETITIVE LANDSCAPE
- 7.1. Introduction
- 7.2. Top winning strategies
- 7.3. Product mapping of top 10 player
- 7.4. Competitive dashboard
- 7.5. Competitive heatmap
- 7.6. Top player positioning, 2022
CHAPTER 8: COMPANY PROFILES
- 8.1. Dow Inc.
- 8.1.1. Company overview
- 8.1.2. Key executives
- 8.1.3. Company snapshot
- 8.1.4. Operating business segments
- 8.1.5. Product portfolio
- 8.1.6. Business performance
- 8.2. BASF SE
- 8.2.1. Company overview
- 8.2.2. Key executives
- 8.2.3. Company snapshot
- 8.2.4. Operating business segments
- 8.2.5. Product portfolio
- 8.2.6. Business performance
- 8.2.7. Key strategic moves and developments
- 8.3. TOAGOSEI CO., LTD.
- 8.3.1. Company overview
- 8.3.2. Key executives
- 8.3.3. Company snapshot
- 8.3.4. Operating business segments
- 8.3.5. Product portfolio
- 8.3.6. Business performance
- 8.4. Sumitomo Chemical Co., Ltd.
- 8.4.1. Company overview
- 8.4.2. Key executives
- 8.4.3. Company snapshot
- 8.4.4. Operating business segments
- 8.4.5. Product portfolio
- 8.4.6. Business performance
- 8.5. Arkema
- 8.5.1. Company overview
- 8.5.2. Key executives
- 8.5.3. Company snapshot
- 8.5.4. Operating business segments
- 8.5.5. Product portfolio
- 8.5.6. Business performance
- 8.5.7. Key strategic moves and developments
- 8.6. Ashland Inc
- 8.6.1. Company overview
- 8.6.2. Key executives
- 8.6.3. Company snapshot
- 8.6.4. Operating business segments
- 8.6.5. Product portfolio
- 8.6.6. Business performance
- 8.7. NIPPON SHOKUBAI. CO. LTD
- 8.7.1. Company overview
- 8.7.2. Key executives
- 8.7.3. Company snapshot
- 8.7.4. Operating business segments
- 8.7.5. Product portfolio
- 8.7.6. Business performance
- 8.8. The Lubrizol Corporation
- 8.8.1. Company overview
- 8.8.2. Key executives
- 8.8.3. Company snapshot
- 8.8.4. Operating business segments
- 8.8.5. Product portfolio
- 8.8.6. Key strategic moves and developments
- 8.9. DuPont
- 8.9.1. Company overview
- 8.9.2. Key executives
- 8.9.3. Company snapshot
- 8.9.4. Operating business segments
- 8.9.5. Product portfolio
- 8.9.6. Business performance
- 8.10. Mitsui Chemicals, Inc.
- 8.10.1. Company overview
- 8.10.2. Key executives
- 8.10.3. Company snapshot
- 8.10.4. Operating business segments
- 8.10.5. Product portfolio
- 8.10.6. Business performance
LIST OF TABLES
- TABLE 01. GLOBAL ACRYLIC POLYMER MARKET, BY TYPE, 2022-2032 ($MILLION)
- TABLE 02. GLOBAL ACRYLIC POLYMER MARKET, BY TYPE, 2022-2032 (KILOTON)
- TABLE 03. ACRYLIC POLYMER MARKET FOR SOLVENT BORNE, BY REGION, 2022-2032 ($MILLION)
- TABLE 04. ACRYLIC POLYMER MARKET FOR SOLVENT BORNE, BY REGION, 2022-2032 (KILOTON)
- TABLE 05. ACRYLIC POLYMER MARKET FOR WATER BORNE, BY REGION, 2022-2032 ($MILLION)
- TABLE 06. ACRYLIC POLYMER MARKET FOR WATER BORNE, BY REGION, 2022-2032 (KILOTON)
- TABLE 07. GLOBAL ACRYLIC POLYMER MARKET, BY APPLICATION, 2022-2032 ($MILLION)
- TABLE 08. GLOBAL ACRYLIC POLYMER MARKET, BY APPLICATION, 2022-2032 (KILOTON)
- TABLE 09. ACRYLIC POLYMER MARKET FOR PAINTS AND COATINGS, BY REGION, 2022-2032 ($MILLION)
- TABLE 10. ACRYLIC POLYMER MARKET FOR PAINTS AND COATINGS, BY REGION, 2022-2032 (KILOTON)
- TABLE 11. ACRYLIC POLYMER MARKET FOR ADHESIVES AND SEALANTS, BY REGION, 2022-2032 ($MILLION)
- TABLE 12. ACRYLIC POLYMER MARKET FOR ADHESIVES AND SEALANTS, BY REGION, 2022-2032 (KILOTON)
- TABLE 13. ACRYLIC POLYMER MARKET FOR INDUSTRIAL WATER TREATMENT ADDITIVES, BY REGION, 2022-2032 ($MILLION)
- TABLE 14. ACRYLIC POLYMER MARKET FOR INDUSTRIAL WATER TREATMENT ADDITIVES, BY REGION, 2022-2032 (KILOTON)
- TABLE 15. ACRYLIC POLYMER MARKET FOR TEXTILES, BY REGION, 2022-2032 ($MILLION)
- TABLE 16. ACRYLIC POLYMER MARKET FOR TEXTILES, BY REGION, 2022-2032 (KILOTON)
- TABLE 17. ACRYLIC POLYMER MARKET FOR CLEANING/DETERGENTS, BY REGION, 2022-2032 ($MILLION)
- TABLE 18. ACRYLIC POLYMER MARKET FOR CLEANING/DETERGENTS, BY REGION, 2022-2032 (KILOTON)
- TABLE 19. ACRYLIC POLYMER MARKET FOR SUPER ABSORBENT POLYMER, BY REGION, 2022-2032 ($MILLION)
- TABLE 20. ACRYLIC POLYMER MARKET FOR SUPER ABSORBENT POLYMER, BY REGION, 2022-2032 (KILOTON)
- TABLE 21. ACRYLIC POLYMER MARKET FOR OTHERS, BY REGION, 2022-2032 ($MILLION)
- TABLE 22. ACRYLIC POLYMER MARKET FOR OTHERS, BY REGION, 2022-2032 (KILOTON)
- TABLE 23. ACRYLIC POLYMER MARKET, BY REGION, 2022-2032 ($MILLION)
- TABLE 24. ACRYLIC POLYMER MARKET, BY REGION, 2022-2032 (KILOTON)
- TABLE 25. NORTH AMERICA ACRYLIC POLYMER MARKET, BY TYPE, 2022-2032 ($MILLION)
- TABLE 26. NORTH AMERICA ACRYLIC POLYMER MARKET, BY TYPE, 2022-2032 (KILOTON)
- TABLE 27. NORTH AMERICA ACRYLIC POLYMER MARKET, BY APPLICATION, 2022-2032 ($MILLION)
- TABLE 28. NORTH AMERICA ACRYLIC POLYMER MARKET, BY APPLICATION, 2022-2032 (KILOTON)
- TABLE 29. NORTH AMERICA ACRYLIC POLYMER MARKET, BY COUNTRY, 2022-2032 ($MILLION)
- TABLE 30. NORTH AMERICA ACRYLIC POLYMER MARKET, BY COUNTRY, 2022-2032 (KILOTON)
- TABLE 31. U.S. ACRYLIC POLYMER MARKET, BY TYPE, 2022-2032 ($MILLION)
- TABLE 32. U.S. ACRYLIC POLYMER MARKET, BY TYPE, 2022-2032 (KILOTON)
- TABLE 33. U.S. ACRYLIC POLYMER MARKET, BY APPLICATION, 2022-2032 ($MILLION)
- TABLE 34. U.S. ACRYLIC POLYMER MARKET, BY APPLICATION, 2022-2032 (KILOTON)
- TABLE 35. CANADA ACRYLIC POLYMER MARKET, BY TYPE, 2022-2032 ($MILLION)
- TABLE 36. CANADA ACRYLIC POLYMER MARKET, BY TYPE, 2022-2032 (KILOTON)
- TABLE 37. CANADA ACRYLIC POLYMER MARKET, BY APPLICATION, 2022-2032 ($MILLION)
- TABLE 38. CANADA ACRYLIC POLYMER MARKET, BY APPLICATION, 2022-2032 (KILOTON)
- TABLE 39. MEXICO ACRYLIC POLYMER MARKET, BY TYPE, 2022-2032 ($MILLION)
- TABLE 40. MEXICO ACRYLIC POLYMER MARKET, BY TYPE, 2022-2032 (KILOTON)
- TABLE 41. MEXICO ACRYLIC POLYMER MARKET, BY APPLICATION, 2022-2032 ($MILLION)
- TABLE 42. MEXICO ACRYLIC POLYMER MARKET, BY APPLICATION, 2022-2032 (KILOTON)
- TABLE 43. EUROPE ACRYLIC POLYMER MARKET, BY TYPE, 2022-2032 ($MILLION)
- TABLE 44. EUROPE ACRYLIC POLYMER MARKET, BY TYPE, 2022-2032 (KILOTON)
- TABLE 45. EUROPE ACRYLIC POLYMER MARKET, BY APPLICATION, 2022-2032 ($MILLION)
- TABLE 46. EUROPE ACRYLIC POLYMER MARKET, BY APPLICATION, 2022-2032 (KILOTON)
- TABLE 47. EUROPE ACRYLIC POLYMER MARKET, BY COUNTRY, 2022-2032 ($MILLION)
- TABLE 48. EUROPE ACRYLIC POLYMER MARKET, BY COUNTRY, 2022-2032 (KILOTON)
- TABLE 49. GERMANY ACRYLIC POLYMER MARKET, BY TYPE, 2022-2032 ($MILLION)
- TABLE 50. GERMANY ACRYLIC POLYMER MARKET, BY TYPE, 2022-2032 (KILOTON)
- TABLE 51. GERMANY ACRYLIC POLYMER MARKET, BY APPLICATION, 2022-2032 ($MILLION)
- TABLE 52. GERMANY ACRYLIC POLYMER MARKET, BY APPLICATION, 2022-2032 (KILOTON)
- TABLE 53. UK ACRYLIC POLYMER MARKET, BY TYPE, 2022-2032 ($MILLION)
- TABLE 54. UK ACRYLIC POLYMER MARKET, BY TYPE, 2022-2032 (KILOTON)
- TABLE 55. UK ACRYLIC POLYMER MARKET, BY APPLICATION, 2022-2032 ($MILLION)
- TABLE 56. UK ACRYLIC POLYMER MARKET, BY APPLICATION, 2022-2032 (KILOTON)
- TABLE 57. FRANCE ACRYLIC POLYMER MARKET, BY TYPE, 2022-2032 ($MILLION)
- TABLE 58. FRANCE ACRYLIC POLYMER MARKET, BY TYPE, 2022-2032 (KILOTON)
- TABLE 59. FRANCE ACRYLIC POLYMER MARKET, BY APPLICATION, 2022-2032 ($MILLION)
- TABLE 60. FRANCE ACRYLIC POLYMER MARKET, BY APPLICATION, 2022-2032 (KILOTON)
- TABLE 61. SPAIN ACRYLIC POLYMER MARKET, BY TYPE, 2022-2032 ($MILLION)
- TABLE 62. SPAIN ACRYLIC POLYMER MARKET, BY TYPE, 2022-2032 (KILOTON)
- TABLE 63. SPAIN ACRYLIC POLYMER MARKET, BY APPLICATION, 2022-2032 ($MILLION)
- TABLE 64. SPAIN ACRYLIC POLYMER MARKET, BY APPLICATION, 2022-2032 (KILOTON)
- TABLE 65. ITALY ACRYLIC POLYMER MARKET, BY TYPE, 2022-2032 ($MILLION)
- TABLE 66. ITALY ACRYLIC POLYMER MARKET, BY TYPE, 2022-2032 (KILOTON)
- TABLE 67. ITALY ACRYLIC POLYMER MARKET, BY APPLICATION, 2022-2032 ($MILLION)
- TABLE 68. ITALY ACRYLIC POLYMER MARKET, BY APPLICATION, 2022-2032 (KILOTON)
- TABLE 69. REST OF EUROPE ACRYLIC POLYMER MARKET, BY TYPE, 2022-2032 ($MILLION)
- TABLE 70. REST OF EUROPE ACRYLIC POLYMER MARKET, BY TYPE, 2022-2032 (KILOTON)
- TABLE 71. REST OF EUROPE ACRYLIC POLYMER MARKET, BY APPLICATION, 2022-2032 ($MILLION)
- TABLE 72. REST OF EUROPE ACRYLIC POLYMER MARKET, BY APPLICATION, 2022-2032 (KILOTON)
- TABLE 73. ASIA-PACIFIC ACRYLIC POLYMER MARKET, BY TYPE, 2022-2032 ($MILLION)
- TABLE 74. ASIA-PACIFIC ACRYLIC POLYMER MARKET, BY TYPE, 2022-2032 (KILOTON)
- TABLE 75. ASIA-PACIFIC ACRYLIC POLYMER MARKET, BY APPLICATION, 2022-2032 ($MILLION)
- TABLE 76. ASIA-PACIFIC ACRYLIC POLYMER MARKET, BY APPLICATION, 2022-2032 (KILOTON)
- TABLE 77. ASIA-PACIFIC ACRYLIC POLYMER MARKET, BY COUNTRY, 2022-2032 ($MILLION)
- TABLE 78. ASIA-PACIFIC ACRYLIC POLYMER MARKET, BY COUNTRY, 2022-2032 (KILOTON)
- TABLE 79. CHINA ACRYLIC POLYMER MARKET, BY TYPE, 2022-2032 ($MILLION)
- TABLE 80. CHINA ACRYLIC POLYMER MARKET, BY TYPE, 2022-2032 (KILOTON)
- TABLE 81. CHINA ACRYLIC POLYMER MARKET, BY APPLICATION, 2022-2032 ($MILLION)
- TABLE 82. CHINA ACRYLIC POLYMER MARKET, BY APPLICATION, 2022-2032 (KILOTON)
- TABLE 83. INDIA ACRYLIC POLYMER MARKET, BY TYPE, 2022-2032 ($MILLION)
- TABLE 84. INDIA ACRYLIC POLYMER MARKET, BY TYPE, 2022-2032 (KILOTON)
- TABLE 85. INDIA ACRYLIC POLYMER MARKET, BY APPLICATION, 2022-2032 ($MILLION)
- TABLE 86. INDIA ACRYLIC POLYMER MARKET, BY APPLICATION, 2022-2032 (KILOTON)
- TABLE 87. JAPAN ACRYLIC POLYMER MARKET, BY TYPE, 2022-2032 ($MILLION)
- TABLE 88. JAPAN ACRYLIC POLYMER MARKET, BY TYPE, 2022-2032 (KILOTON)
- TABLE 89. JAPAN ACRYLIC POLYMER MARKET, BY APPLICATION, 2022-2032 ($MILLION)
- TABLE 90. JAPAN ACRYLIC POLYMER MARKET, BY APPLICATION, 2022-2032 (KILOTON)
- TABLE 91. SOUTH KOREA ACRYLIC POLYMER MARKET, BY TYPE, 2022-2032 ($MILLION)
- TABLE 92. SOUTH KOREA ACRYLIC POLYMER MARKET, BY TYPE, 2022-2032 (KILOTON)
- TABLE 93. SOUTH KOREA ACRYLIC POLYMER MARKET, BY APPLICATION, 2022-2032 ($MILLION)
- TABLE 94. SOUTH KOREA ACRYLIC POLYMER MARKET, BY APPLICATION, 2022-2032 (KILOTON)
- TABLE 95. REST OF ASIA-PACIFIC ACRYLIC POLYMER MARKET, BY TYPE, 2022-2032 ($MILLION)
- TABLE 96. REST OF ASIA-PACIFIC ACRYLIC POLYMER MARKET, BY TYPE, 2022-2032 (KILOTON)
- TABLE 97. REST OF ASIA-PACIFIC ACRYLIC POLYMER MARKET, BY APPLICATION, 2022-2032 ($MILLION)
- TABLE 98. REST OF ASIA-PACIFIC ACRYLIC POLYMER MARKET, BY APPLICATION, 2022-2032 (KILOTON)
- TABLE 99. LAMEA ACRYLIC POLYMER MARKET, BY TYPE, 2022-2032 ($MILLION)
- TABLE 100. LAMEA ACRYLIC POLYMER MARKET, BY TYPE, 2022-2032 (KILOTON)
- TABLE 101. LAMEA ACRYLIC POLYMER MARKET, BY APPLICATION, 2022-2032 ($MILLION)
- TABLE 102. LAMEA ACRYLIC POLYMER MARKET, BY APPLICATION, 2022-2032 (KILOTON)
- TABLE 103. LAMEA ACRYLIC POLYMER MARKET, BY COUNTRY, 2022-2032 ($MILLION)
- TABLE 104. LAMEA ACRYLIC POLYMER MARKET, BY COUNTRY, 2022-2032 (KILOTON)
- TABLE 105. BRAZIL ACRYLIC POLYMER MARKET, BY TYPE, 2022-2032 ($MILLION)
- TABLE 106. BRAZIL ACRYLIC POLYMER MARKET, BY TYPE, 2022-2032 (KILOTON)
- TABLE 107. BRAZIL ACRYLIC POLYMER MARKET, BY APPLICATION, 2022-2032 ($MILLION)
- TABLE 108. BRAZIL ACRYLIC POLYMER MARKET, BY APPLICATION, 2022-2032 (KILOTON)
- TABLE 109. SAUDI ARABIA ACRYLIC POLYMER MARKET, BY TYPE, 2022-2032 ($MILLION)
- TABLE 110. SAUDI ARABIA ACRYLIC POLYMER MARKET, BY TYPE, 2022-2032 (KILOTON)
- TABLE 111. SAUDI ARABIA ACRYLIC POLYMER MARKET, BY APPLICATION, 2022-2032 ($MILLION)
- TABLE 112. SAUDI ARABIA ACRYLIC POLYMER MARKET, BY APPLICATION, 2022-2032 (KILOTON)
- TABLE 113. SOUTH AFRICA ACRYLIC POLYMER MARKET, BY TYPE, 2022-2032 ($MILLION)
- TABLE 114. SOUTH AFRICA ACRYLIC POLYMER MARKET, BY TYPE, 2022-2032 (KILOTON)
- TABLE 115. SOUTH AFRICA ACRYLIC POLYMER MARKET, BY APPLICATION, 2022-2032 ($MILLION)
- TABLE 116. SOUTH AFRICA ACRYLIC POLYMER MARKET, BY APPLICATION, 2022-2032 (KILOTON)
- TABLE 117. REST OF LAMEA ACRYLIC POLYMER MARKET, BY TYPE, 2022-2032 ($MILLION)
- TABLE 118. REST OF LAMEA ACRYLIC POLYMER MARKET, BY TYPE, 2022-2032 (KILOTON)
- TABLE 119. REST OF LAMEA ACRYLIC POLYMER MARKET, BY APPLICATION, 2022-2032 ($MILLION)
- TABLE 120. REST OF LAMEA ACRYLIC POLYMER MARKET, BY APPLICATION, 2022-2032 (KILOTON)
- TABLE 121. DOW INC.: KEY EXECUTIVES
- TABLE 122. DOW INC.: COMPANY SNAPSHOT
- TABLE 123. DOW INC.: PRODUCT SEGMENTS
- TABLE 124. DOW INC.: PRODUCT PORTFOLIO
- TABLE 125. BASF SE: KEY EXECUTIVES
- TABLE 126. BASF SE: COMPANY SNAPSHOT
- TABLE 127. BASF SE: PRODUCT SEGMENTS
- TABLE 128. BASF SE: PRODUCT PORTFOLIO
- TABLE 129. BASF SE: KEY STRATEGIES
- TABLE 130. TOAGOSEI CO., LTD.: KEY EXECUTIVES
- TABLE 131. TOAGOSEI CO., LTD.: COMPANY SNAPSHOT
- TABLE 132. TOAGOSEI CO., LTD.: PRODUCT SEGMENTS
- TABLE 133. TOAGOSEI CO., LTD.: PRODUCT PORTFOLIO
- TABLE 134. SUMITOMO CHEMICAL CO., LTD.: KEY EXECUTIVES
- TABLE 135. SUMITOMO CHEMICAL CO., LTD.: COMPANY SNAPSHOT
- TABLE 136. SUMITOMO CHEMICAL CO., LTD.: PRODUCT SEGMENTS
- TABLE 137. SUMITOMO CHEMICAL CO., LTD.: PRODUCT PORTFOLIO
- TABLE 138. ARKEMA: KEY EXECUTIVES
- TABLE 139. ARKEMA: COMPANY SNAPSHOT
- TABLE 140. ARKEMA: PRODUCT SEGMENTS
- TABLE 141. ARKEMA: PRODUCT PORTFOLIO
- TABLE 142. ARKEMA: KEY STRATEGIES
- TABLE 143. ASHLAND INC: KEY EXECUTIVES
- TABLE 144. ASHLAND INC: COMPANY SNAPSHOT
- TABLE 145. ASHLAND INC: PRODUCT SEGMENTS
- TABLE 146. ASHLAND INC: PRODUCT PORTFOLIO
- TABLE 147. NIPPON SHOKUBAI. CO. LTD: KEY EXECUTIVES
- TABLE 148. NIPPON SHOKUBAI. CO. LTD: COMPANY SNAPSHOT
- TABLE 149. NIPPON SHOKUBAI. CO. LTD: PRODUCT SEGMENTS
- TABLE 150. NIPPON SHOKUBAI. CO. LTD: PRODUCT PORTFOLIO
- TABLE 151. THE LUBRIZOL CORPORATION: KEY EXECUTIVES
- TABLE 152. THE LUBRIZOL CORPORATION: COMPANY SNAPSHOT
- TABLE 153. THE LUBRIZOL CORPORATION: PRODUCT SEGMENTS
- TABLE 154. THE LUBRIZOL CORPORATION: PRODUCT PORTFOLIO
- TABLE 155. THE LUBRIZOL CORPORATION: KEY STRATEGIES
- TABLE 156. DUPONT: KEY EXECUTIVES
- TABLE 157. DUPONT: COMPANY SNAPSHOT
- TABLE 158. DUPONT: PRODUCT SEGMENTS
- TABLE 159. DUPONT: PRODUCT PORTFOLIO
- TABLE 160. MITSUI CHEMICALS, INC.: KEY EXECUTIVES
- TABLE 161. MITSUI CHEMICALS, INC.: COMPANY SNAPSHOT
- TABLE 162. MITSUI CHEMICALS, INC.: PRODUCT SEGMENTS
- TABLE 163. MITSUI CHEMICALS, INC.: PRODUCT PORTFOLIO
LIST OF FIGURES
- FIGURE 01. ACRYLIC POLYMER MARKET, 2022-2032
- FIGURE 02. SEGMENTATION OF ACRYLIC POLYMER MARKET,2022-2032
- FIGURE 03. TOP IMPACTING FACTORS IN ACRYLIC POLYMER MARKET (2022 TO 2032)
- FIGURE 04. TOP INVESTMENT POCKETS IN ACRYLIC POLYMER MARKET (2023-2032)
- FIGURE 05. MODERATE BARGAINING POWER OF SUPPLIERS
- FIGURE 06. MODERATE THREAT OF NEW ENTRANTS
- FIGURE 07. MODERATE THREAT OF SUBSTITUTES
- FIGURE 08. MODERATE INTENSITY OF RIVALRY
- FIGURE 09. MODERATE BARGAINING POWER OF BUYERS
- FIGURE 10. GLOBAL ACRYLIC POLYMER MARKET:DRIVERS, RESTRAINTS AND OPPORTUNITIES
- FIGURE 11. PRICING ANALYSIS: ACRYLIC POLYMER MARKET 2022 AND 2032
- FIGURE 12. IMPACT OF KEY REGULATION: ACRYLIC POLYMER MARKET
- FIGURE 13. PATENT ANALYSIS BY COMPANY
- FIGURE 14. PATENT ANALYSIS BY COUNTRY
- FIGURE 15. ACRYLIC POLYMER MARKET, BY TYPE, 2022 AND 2032(%)
- FIGURE 16. COMPARATIVE SHARE ANALYSIS OF ACRYLIC POLYMER MARKET FOR SOLVENT BORNE, BY COUNTRY 2022 AND 2032(%)
- FIGURE 17. COMPARATIVE SHARE ANALYSIS OF ACRYLIC POLYMER MARKET FOR WATER BORNE, BY COUNTRY 2022 AND 2032(%)
- FIGURE 18. ACRYLIC POLYMER MARKET, BY APPLICATION, 2022 AND 2032(%)
- FIGURE 19. COMPARATIVE SHARE ANALYSIS OF ACRYLIC POLYMER MARKET FOR PAINTS AND COATINGS, BY COUNTRY 2022 AND 2032(%)
- FIGURE 20. COMPARATIVE SHARE ANALYSIS OF ACRYLIC POLYMER MARKET FOR ADHESIVES AND SEALANTS, BY COUNTRY 2022 AND 2032(%)
- FIGURE 21. COMPARATIVE SHARE ANALYSIS OF ACRYLIC POLYMER MARKET FOR INDUSTRIAL WATER TREATMENT ADDITIVES, BY COUNTRY 2022 AND 2032(%)
- FIGURE 22. COMPARATIVE SHARE ANALYSIS OF ACRYLIC POLYMER MARKET FOR TEXTILES, BY COUNTRY 2022 AND 2032(%)
- FIGURE 23. COMPARATIVE SHARE ANALYSIS OF ACRYLIC POLYMER MARKET FOR CLEANING/DETERGENTS, BY COUNTRY 2022 AND 2032(%)
- FIGURE 24. COMPARATIVE SHARE ANALYSIS OF ACRYLIC POLYMER MARKET FOR SUPER ABSORBENT POLYMER, BY COUNTRY 2022 AND 2032(%)
- FIGURE 25. COMPARATIVE SHARE ANALYSIS OF ACRYLIC POLYMER MARKET FOR OTHERS, BY COUNTRY 2022 AND 2032(%)
- FIGURE 26. ACRYLIC POLYMER MARKET BY REGION, 2022 AND 2032(%)
- FIGURE 27. U.S. ACRYLIC POLYMER MARKET, 2022-2032 ($MILLION)
- FIGURE 28. CANADA ACRYLIC POLYMER MARKET, 2022-2032 ($MILLION)
- FIGURE 29. MEXICO ACRYLIC POLYMER MARKET, 2022-2032 ($MILLION)
- FIGURE 30. GERMANY ACRYLIC POLYMER MARKET, 2022-2032 ($MILLION)
- FIGURE 31. UK ACRYLIC POLYMER MARKET, 2022-2032 ($MILLION)
- FIGURE 32. FRANCE ACRYLIC POLYMER MARKET, 2022-2032 ($MILLION)
- FIGURE 33. SPAIN ACRYLIC POLYMER MARKET, 2022-2032 ($MILLION)
- FIGURE 34. ITALY ACRYLIC POLYMER MARKET, 2022-2032 ($MILLION)
- FIGURE 35. REST OF EUROPE ACRYLIC POLYMER MARKET, 2022-2032 ($MILLION)
- FIGURE 36. CHINA ACRYLIC POLYMER MARKET, 2022-2032 ($MILLION)
- FIGURE 37. INDIA ACRYLIC POLYMER MARKET, 2022-2032 ($MILLION)
- FIGURE 38. JAPAN ACRYLIC POLYMER MARKET, 2022-2032 ($MILLION)
- FIGURE 39. SOUTH KOREA ACRYLIC POLYMER MARKET, 2022-2032 ($MILLION)
- FIGURE 40. REST OF ASIA-PACIFIC ACRYLIC POLYMER MARKET, 2022-2032 ($MILLION)
- FIGURE 41. BRAZIL ACRYLIC POLYMER MARKET, 2022-2032 ($MILLION)
- FIGURE 42. SAUDI ARABIA ACRYLIC POLYMER MARKET, 2022-2032 ($MILLION)
- FIGURE 43. SOUTH AFRICA ACRYLIC POLYMER MARKET, 2022-2032 ($MILLION)
- FIGURE 44. REST OF LAMEA ACRYLIC POLYMER MARKET, 2022-2032 ($MILLION)
- FIGURE 45. TOP WINNING STRATEGIES, BY YEAR (2022-2024)
- FIGURE 46. TOP WINNING STRATEGIES, BY DEVELOPMENT (2022-2024)
- FIGURE 47. TOP WINNING STRATEGIES, BY COMPANY (2022-2024)
- FIGURE 48. PRODUCT MAPPING OF TOP 10 PLAYERS
- FIGURE 49. COMPETITIVE DASHBOARD
- FIGURE 50. COMPETITIVE HEATMAP: ACRYLIC POLYMER MARKET
- FIGURE 51. TOP PLAYER POSITIONING, 2022
- FIGURE 52. DOW INC.: NET SALES, 2021-2023 ($MILLION)
- FIGURE 53. DOW INC.: REVENUE SHARE BY SEGMENT, 2023 (%)
- FIGURE 54. DOW INC.: REVENUE SHARE BY REGION, 2023 (%)
- FIGURE 55. BASF SE: NET SALES, 2021-2023 ($MILLION)
- FIGURE 56. BASF SE: RESEARCH & DEVELOPMENT EXPENDITURE, 2020-2022 ($MILLION)
- FIGURE 57. BASF SE: REVENUE SHARE BY SEGMENT, 2023 (%)
- FIGURE 58. BASF SE: REVENUE SHARE BY REGION, 2022 (%)
- FIGURE 59. TOAGOSEI CO., LTD.: NET SALES, 2021-2023 ($MILLION)
- FIGURE 60. TOAGOSEI CO., LTD.: REVENUE SHARE BY SEGMENT, 2023 (%)
- FIGURE 61. SUMITOMO CHEMICAL CO., LTD.: NET REVENUE, 2020-2022 ($MILLION)
- FIGURE 62. SUMITOMO CHEMICAL CO., LTD.: REVENUE SHARE BY SEGMENT, 2022 (%)
- FIGURE 63. ARKEMA: NET SALES, 2021-2023 ($MILLION)
- FIGURE 64. ARKEMA: RESEARCH & DEVELOPMENT EXPENDITURE, 2021-2023 ($MILLION)
- FIGURE 65. ARKEMA: REVENUE SHARE BY SEGMENT, 2023 (%)
- FIGURE 66. ASHLAND INC: NET SALES, 2021-2023 ($MILLION)
- FIGURE 67. ASHLAND INC: RESEARCH & DEVELOPMENT EXPENDITURE, 2021-2023 ($MILLION)
- FIGURE 68. ASHLAND INC: REVENUE SHARE BY SEGMENT, 2023 (%)
- FIGURE 69. ASHLAND INC: REVENUE SHARE BY REGION, 2023 (%)
- FIGURE 70. NIPPON SHOKUBAI. CO. LTD: NET REVENUE, 2020-2022 ($MILLION)
- FIGURE 71. NIPPON SHOKUBAI. CO. LTD: REVENUE SHARE BY SEGMENT, 2022 (%)
- FIGURE 72. DUPONT: NET SALES, 2021-2023 ($MILLION)
- FIGURE 73. DUPONT: RESEARCH & DEVELOPMENT EXPENDITURE, 2021-2023 ($MILLION)
- FIGURE 74. DUPONT: REVENUE SHARE BY SEGMENT, 2023 (%)
- FIGURE 75. DUPONT: REVENUE SHARE BY SEGMENT, 2023 (%)
- FIGURE 76. MITSUI CHEMICALS, INC.: NET SALES, 2020-2022 ($MILLION)
- FIGURE 77. MITSUI CHEMICALS, INC.: REVENUE SHARE BY SEGMENT, 2022 (%)
- FIGURE 78. MITSUI CHEMICALS, INC.: REVENUE SHARE BY REGION, 2022 (%)

