
PUBLISHER: Allied Market Research | PRODUCT CODE: 1513376

PUBLISHER: Allied Market Research | PRODUCT CODE: 1513376
Unconventional Oil Market By Type, By Technology (Steam Assisted Gravity Drainage, Cyclic Steam Stimulation, Expanding Solvent Steam Assisted Gravity Drainage, Others), By Operations : Global Opportunity Analysis and Industry Forecast, 2024-2033
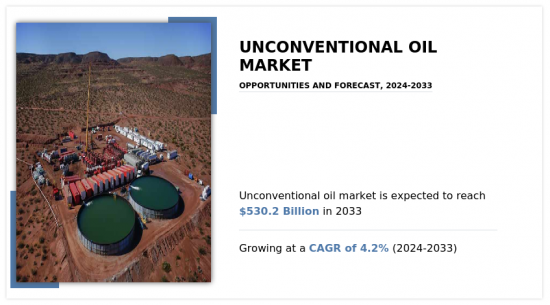
The unconventional oil market was valued at $354.9 billion in 2023, and is estimated to reach $530.2 billion by 2033, growing at a CAGR of 4.2% from 2024 to 2033.
Unconventional oil refers to petroleum resources that are not easily accessible or recoverable using traditional drilling methods. As compared to conventional oil that is extracted from porous reservoirs using conventional drilling techniques, unconventional oil requires advanced extraction methods due to its location in reservoirs with low permeability or trapped in unconventional geological formations. Unconventional oil resources include oil sands, shale oil, and heavy oil. Extracting unconventional oil often involves techniques such as hydraulic fracturing (fracking), steam injection, and mining processes, which are more complex and costly compared to conventional drilling methods.
Technological advancements have played a pivotal role in driving the demand for unconventional oil by unlocking vast reserves that were previously economically inaccessible or technically challenging to extract. These advancements have revolutionized the oil and gas industry by enabling the extraction of unconventional resources such as oil sands, tight oil, oil shale, and heavy oil. Furthermore, advancements in horizontal drilling technology have greatly enhanced the efficiency and productivity of unconventional oil extraction. Horizontal drilling allows operators to access larger areas of hydrocarbon-bearing formations from a single wellbore, increasing reservoir contact and improving well performance. All these factors are expected to drive the demand for the global unconventional oil market during the forecast period.
However, inconsistent regulations in unconventional oil industry are the uncertainty for investors and operators. Companies require a stable and transparent regulatory framework to make long-term investment decisions confidently. According to the International Energy Agency (IEA), provisions of several federal environmental laws apply to certain activities related to oil and gas production, and proposals to expand federal regulation in this area have been highly controversial. Moreover, inconsistent regulations increase compliance costs and administrative burdens for companies operating in the unconventional oil sector. All these factors hamper the global unconventional oil market growth.
Advancements in methane detection and mitigation technologies are helping to address concerns about methane emissions associated with unconventional oil operations. Methane, a potent greenhouse gas, is released during various stages of oil production, including drilling, extraction, and transportation. By deploying state-of-the-art monitoring equipment and implementing best practices for leak detection and repair, operators minimize methane emissions and improve the environmental performance of their operations. All these factors are anticipated to offer new growth opportunities for the global unconventional oil market during the forecast period.
The global unconventional oil market is segmented into type, technology, operations, and region. On the basis of type, the market is classified as extra heavy oil, bitumen, oil shale, and heavy oil. As per technology, the market is categorized into steam assisted gravity drainage (SAGD), cyclic steam stimulation (CSS), expanding solvent steam assisted gravity drainage (ES SAGD), and others. By operations, the market is segmented into upstream, midstream, and downstream. Region wise, the market is analyzed across North America, Europe, Asia-Pacific, and LAMEA.
On the basis of type, the market is classified as extra heavy oil, bitumen, oil shale, and heavy oil. The oil shale segment accounted for less than two-fifths of the global unconventional oil market share in 2023 and is expected to maintain its dominance during the forecast period. Advancements in technology have improved the feasibility of extracting and processing oil shale. Innovative techniques such as in-situ retorting and surface mining have made oil shale extraction more efficient and cost-effective. In addition, research and development efforts focused on optimizing retorting processes, reducing environmental impacts, and increasing energy efficiency are ongoing, further enhancing the potential of oil shale as a viable energy resource. Moreover, oil shale has the potential to provide a stable and reliable source of energy where conventional oil reserves are limited or declining. All these factors drive the demand for oil shale in unconventional oil market.
On the basis of technology, the market is categorized into steam assisted gravity drainage (SAGD), cyclic steam stimulation (CSS), expanding solvent steam assisted gravity drainage (ES SAGD), and others. The steam assisted gravity drainage (SAGD) segment accounted for more than two-fifths of the global unconventional oil market share in 2023 and is expected to maintain its dominance during the forecast period. Environmental sustainability is a crucial factor that creates opportunities in SAGD. As the global focus on climate change intensifies, the oil and gas industry faces increasing pressure to minimize greenhouse gas emissions and mitigate environmental impact. SAGD operations have historically been associated with high energy consumption and greenhouse gas emissions due to steam generation and combustion processes. However, ongoing efforts to implement carbon capture and storage (CCS) technologies, utilize cleaner energy sources, and improve water recycling and treatment systems significantly reduce the carbon intensity of SAGD projects.
By operations, the market is segmented into upstream, midstream, and downstream. The upstream segment accounted for less than half of the global unconventional oil market share in 2023 and is expected to maintain its dominance during the forecast period. Access to infrastructure and transportation networks is a critical factor in driving upstream operations in unconventional oil. As compared to conventional oil fields, which are often located in established oil-producing regions with existing infrastructure, many unconventional oil plays are located in remote or undeveloped areas lacking adequate infrastructure for oil production, storage, and transportation. The availability of pipelines, railroads, and other infrastructure significantly impact the economics and viability of unconventional oil projects, as it influences transportation costs, market access, and the ability to deliver oil to refineries and end markets.
Region wise, the market is analyzed across North America, Europe, Asia-Pacific, and LAMEA. North America accounted for less than three-fourths of the global unconventional oil market share in 2023 and is expected to maintain its dominance during the forecast period. The abundance of unconventional oil resources in North America has provided a strategic advantage, reducing dependency on imported oil and enhancing energy security. With substantial reserves readily available within its borders, North America has been able to increase domestic production, reducing the need for foreign oil imports and mitigating geopolitical risks associated with reliance on oil from volatile regions.
Key players in the global unconventional oil market include Suncor Energy Inc., Cenovus Inc., Sunshine Oilsands Ltd., Imperial Oil Limited, ConocoPhillips Company, ExxonMobil Corporation, Canadian Natural, Royal Dutch Shell plc, Chevron Corporation, and Athabasca Oil Corporation.
Key findings of the study
- On the basis of type, the heavy oil segment is anticipated to grow at the fastest CAGR of 4.8% during the forecast period.
- By technology, the steam assisted gravity drainage (SAGD) segment is anticipated to grow at the fastest CAGR during the forecast period.
- On the basis of operations, the upstream segment is anticipated to grow at the fastest CAGR of 4.5% during the forecast period.
- Region-wise, North America has the highest share in 2022 in terms of revenue.
Key Benefits For Stakeholders
- This report provides a quantitative analysis of the market segments, current trends, estimations, and dynamics of the unconventional oil market analysis from 2023 to 2033 to identify the prevailing unconventional oil market opportunities.
- The market research is offered along with information related to key drivers, restraints, and opportunities.
- Porter's five forces analysis highlights the potency of buyers and suppliers to enable stakeholders make profit-oriented business decisions and strengthen their supplier-buyer network.
- In-depth analysis of the unconventional oil market segmentation assists to determine the prevailing market opportunities.
- Major countries in each region are mapped according to their revenue contribution to the global market.
- Market player positioning facilitates benchmarking and provides a clear understanding of the present position of the market players.
- The report includes the analysis of the regional as well as global unconventional oil market trends, key players, market segments, application areas, and market growth strategies.
Additional benefits you will get with this purchase are:
- Quarterly Update and* (only available with a corporate license, on listed price)
- 5 additional Company Profile of client Choice pre- or Post-purchase, as a free update.
- Free Upcoming Version on the Purchase of Five and Enterprise User License.
- 16 analyst hours of support* (post-purchase, if you find additional data requirements upon review of the report, you may receive support amounting to 16 analyst hours to solve questions, and post-sale queries)
- 15% Free Customization* (in case the scope or segment of the report does not match your requirements, 15% is equivalent to 3 working days of free work, applicable once)
- Free data Pack on the Five and Enterprise User License. (Excel version of the report)
- Free Updated report if the report is 6-12 months old or older.
- 24-hour priority response*
- Free Industry updates and white papers.
Possible Customization with this report (with additional cost and timeline, please talk to the sales executive to know more)
- Manufacturing Capacity
- Capital Investment breakdown
- Product Life Cycles
- Upcoming/New Entrant by Regions
- Technology Trend Analysis
- Go To Market Strategy
- Market share analysis of players by products/segments
- New Product Development/ Product Matrix of Key Players
- Regulatory Guidelines
- Additional company profiles with specific to client's interest
- Additional country or region analysis- market size and forecast
- Expanded list for Company Profiles
- Historic market data
- Import Export Analysis/Data
- Key player details (including location, contact details, supplier/vendor network etc. in excel format)
- SWOT Analysis
Key Market Segments
By Type
- Oil Shale
- Bitumen
- Extra Heavy Oil
- Heavy Oil
By Technology
- Steam Assisted Gravity Drainage (SAGD)
- Cyclic Steam Stimulation (CSS)
- Expanding Solvent Steam Assisted Gravity Drainage (ES SAGD)
- Others
By Operations
- Upstream
- Downstream
- Midstream
By Region
- North America
- U.S.
- Canada
- Mexico
- Europe
- Germany
- Italy
- Spain
- France
- UK
- Rest of Europe
- Asia-Pacific
- China
- India
- Australia
- South Korea
- Japan
- Rest of Asia-Pacific
- LAMEA
- Brazil
- South Africa
- Saudi Arabia
- Rest of LAMEA
Key Market Players:
- Suncor Energy Inc.
- ConocoPhillips Company
- Exxon Mobil Corporation
- Royal Dutch Shell plc
- Imperial Oil Limited
- Canadian Natural
- Chevron Corporation
- Cenovus Inc.
- Sunshine Oilsands Ltd.
- Athabasca Oil Corporation
TABLE OF CONTENTS
CHAPTER 1: INTRODUCTION
- 1.1. Report description
- 1.2. Key market segments
- 1.3. Key benefits to the stakeholders
- 1.4. Research methodology
- 1.4.1. Primary research
- 1.4.2. Secondary research
- 1.4.3. Analyst tools and models
CHAPTER 2: EXECUTIVE SUMMARY
- 2.1. CXO perspective
CHAPTER 3: MARKET OVERVIEW
- 3.1. Market definition and scope
- 3.2. Key findings
- 3.2.1. Top impacting factors
- 3.2.2. Top investment pockets
- 3.3. Porter's five forces analysis
- 3.3.1. Moderate threat of new entrants
- 3.3.2. Moderate intensity of rivalry
- 3.3.3. Moderate bargaining power of buyers
- 3.3.4. Moderate bargaining power of suppliers
- 3.3.5. Moderate threat of substitutes
- 3.4. Market dynamics
- 3.4.1. Drivers
- 3.4.1.1. Technological advancements in unconventional oil recovery
- 3.4.1.2. Escalation in global oil demand
- 3.4.2. Restraints
- 3.4.2.1. Inconsistent government regulations
- 3.4.3. Opportunities
- 3.4.3.1. Integration with new technologies to reduce GHG emissions
- 3.4.1. Drivers
- 3.5. Value Chain Analysis
- 3.6. Key Regulation Analysis
CHAPTER 4: UNCONVENTIONAL OIL MARKET, BY TYPE
- 4.1. Overview
- 4.1.1. Market size and forecast
- 4.2. Oil Shale
- 4.2.1. Key market trends, growth factors and opportunities
- 4.2.2. Market size and forecast, by region
- 4.2.3. Market share analysis by country
- 4.3. Bitumen
- 4.3.1. Key market trends, growth factors and opportunities
- 4.3.2. Market size and forecast, by region
- 4.3.3. Market share analysis by country
- 4.4. Extra Heavy Oil
- 4.4.1. Key market trends, growth factors and opportunities
- 4.4.2. Market size and forecast, by region
- 4.4.3. Market share analysis by country
- 4.5. Heavy Oil
- 4.5.1. Key market trends, growth factors and opportunities
- 4.5.2. Market size and forecast, by region
- 4.5.3. Market share analysis by country
CHAPTER 5: UNCONVENTIONAL OIL MARKET, BY TECHNOLOGY
- 5.1. Overview
- 5.1.1. Market size and forecast
- 5.2. Steam Assisted Gravity Drainage (SAGD)
- 5.2.1. Key market trends, growth factors and opportunities
- 5.2.2. Market size and forecast, by region
- 5.2.3. Market share analysis by country
- 5.3. Cyclic Steam Stimulation (CSS)
- 5.3.1. Key market trends, growth factors and opportunities
- 5.3.2. Market size and forecast, by region
- 5.3.3. Market share analysis by country
- 5.4. Expanding Solvent Steam Assisted Gravity Drainage (ES SAGD)
- 5.4.1. Key market trends, growth factors and opportunities
- 5.4.2. Market size and forecast, by region
- 5.4.3. Market share analysis by country
- 5.5. Others
- 5.5.1. Key market trends, growth factors and opportunities
- 5.5.2. Market size and forecast, by region
- 5.5.3. Market share analysis by country
CHAPTER 6: UNCONVENTIONAL OIL MARKET, BY OPERATIONS
- 6.1. Overview
- 6.1.1. Market size and forecast
- 6.2. Upstream
- 6.2.1. Key market trends, growth factors and opportunities
- 6.2.2. Market size and forecast, by region
- 6.2.3. Market share analysis by country
- 6.3. Downstream
- 6.3.1. Key market trends, growth factors and opportunities
- 6.3.2. Market size and forecast, by region
- 6.3.3. Market share analysis by country
- 6.4. Midstream
- 6.4.1. Key market trends, growth factors and opportunities
- 6.4.2. Market size and forecast, by region
- 6.4.3. Market share analysis by country
CHAPTER 7: UNCONVENTIONAL OIL MARKET, BY REGION
- 7.1. Overview
- 7.1.1. Market size and forecast By Region
- 7.2. North America
- 7.2.1. Key market trends, growth factors and opportunities
- 7.2.2. Market size and forecast, by Type
- 7.2.3. Market size and forecast, by Technology
- 7.2.4. Market size and forecast, by Operations
- 7.2.5. Market size and forecast, by country
- 7.2.5.1. U.S.
- 7.2.5.1.1. Market size and forecast, by Type
- 7.2.5.1.2. Market size and forecast, by Technology
- 7.2.5.1.3. Market size and forecast, by Operations
- 7.2.5.2. Canada
- 7.2.5.2.1. Market size and forecast, by Type
- 7.2.5.2.2. Market size and forecast, by Technology
- 7.2.5.2.3. Market size and forecast, by Operations
- 7.2.5.3. Mexico
- 7.2.5.3.1. Market size and forecast, by Type
- 7.2.5.3.2. Market size and forecast, by Technology
- 7.2.5.3.3. Market size and forecast, by Operations
- 7.3. Europe
- 7.3.1. Key market trends, growth factors and opportunities
- 7.3.2. Market size and forecast, by Type
- 7.3.3. Market size and forecast, by Technology
- 7.3.4. Market size and forecast, by Operations
- 7.3.5. Market size and forecast, by country
- 7.3.5.1. Germany
- 7.3.5.1.1. Market size and forecast, by Type
- 7.3.5.1.2. Market size and forecast, by Technology
- 7.3.5.1.3. Market size and forecast, by Operations
- 7.3.5.2. Italy
- 7.3.5.2.1. Market size and forecast, by Type
- 7.3.5.2.2. Market size and forecast, by Technology
- 7.3.5.2.3. Market size and forecast, by Operations
- 7.3.5.3. Spain
- 7.3.5.3.1. Market size and forecast, by Type
- 7.3.5.3.2. Market size and forecast, by Technology
- 7.3.5.3.3. Market size and forecast, by Operations
- 7.3.5.4. France
- 7.3.5.4.1. Market size and forecast, by Type
- 7.3.5.4.2. Market size and forecast, by Technology
- 7.3.5.4.3. Market size and forecast, by Operations
- 7.3.5.5. UK
- 7.3.5.5.1. Market size and forecast, by Type
- 7.3.5.5.2. Market size and forecast, by Technology
- 7.3.5.5.3. Market size and forecast, by Operations
- 7.3.5.6. Rest of Europe
- 7.3.5.6.1. Market size and forecast, by Type
- 7.3.5.6.2. Market size and forecast, by Technology
- 7.3.5.6.3. Market size and forecast, by Operations
- 7.4. Asia-Pacific
- 7.4.1. Key market trends, growth factors and opportunities
- 7.4.2. Market size and forecast, by Type
- 7.4.3. Market size and forecast, by Technology
- 7.4.4. Market size and forecast, by Operations
- 7.4.5. Market size and forecast, by country
- 7.4.5.1. China
- 7.4.5.1.1. Market size and forecast, by Type
- 7.4.5.1.2. Market size and forecast, by Technology
- 7.4.5.1.3. Market size and forecast, by Operations
- 7.4.5.2. India
- 7.4.5.2.1. Market size and forecast, by Type
- 7.4.5.2.2. Market size and forecast, by Technology
- 7.4.5.2.3. Market size and forecast, by Operations
- 7.4.5.3. Australia
- 7.4.5.3.1. Market size and forecast, by Type
- 7.4.5.3.2. Market size and forecast, by Technology
- 7.4.5.3.3. Market size and forecast, by Operations
- 7.4.5.4. South Korea
- 7.4.5.4.1. Market size and forecast, by Type
- 7.4.5.4.2. Market size and forecast, by Technology
- 7.4.5.4.3. Market size and forecast, by Operations
- 7.4.5.5. Japan
- 7.4.5.5.1. Market size and forecast, by Type
- 7.4.5.5.2. Market size and forecast, by Technology
- 7.4.5.5.3. Market size and forecast, by Operations
- 7.4.5.6. Rest of Asia-Pacific
- 7.4.5.6.1. Market size and forecast, by Type
- 7.4.5.6.2. Market size and forecast, by Technology
- 7.4.5.6.3. Market size and forecast, by Operations
- 7.5. LAMEA
- 7.5.1. Key market trends, growth factors and opportunities
- 7.5.2. Market size and forecast, by Type
- 7.5.3. Market size and forecast, by Technology
- 7.5.4. Market size and forecast, by Operations
- 7.5.5. Market size and forecast, by country
- 7.5.5.1. Brazil
- 7.5.5.1.1. Market size and forecast, by Type
- 7.5.5.1.2. Market size and forecast, by Technology
- 7.5.5.1.3. Market size and forecast, by Operations
- 7.5.5.2. South Africa
- 7.5.5.2.1. Market size and forecast, by Type
- 7.5.5.2.2. Market size and forecast, by Technology
- 7.5.5.2.3. Market size and forecast, by Operations
- 7.5.5.3. Saudi Arabia
- 7.5.5.3.1. Market size and forecast, by Type
- 7.5.5.3.2. Market size and forecast, by Technology
- 7.5.5.3.3. Market size and forecast, by Operations
- 7.5.5.4. Rest of LAMEA
- 7.5.5.4.1. Market size and forecast, by Type
- 7.5.5.4.2. Market size and forecast, by Technology
- 7.5.5.4.3. Market size and forecast, by Operations
CHAPTER 8: COMPETITIVE LANDSCAPE
- 8.1. Introduction
- 8.2. Top winning strategies
- 8.3. Product mapping of top 10 player
- 8.4. Competitive dashboard
- 8.5. Competitive heatmap
- 8.6. Top player positioning, 2023
CHAPTER 9: COMPANY PROFILES
- 9.1. Imperial Oil Limited
- 9.1.1. Company overview
- 9.1.2. Key executives
- 9.1.3. Company snapshot
- 9.1.4. Operating business segments
- 9.1.5. Product portfolio
- 9.1.6. Business performance
- 9.2. ConocoPhillips Company
- 9.2.1. Company overview
- 9.2.2. Key executives
- 9.2.3. Company snapshot
- 9.2.4. Operating business segments
- 9.2.5. Product portfolio
- 9.2.6. Business performance
- 9.3. Exxon Mobil Corporation
- 9.3.1. Company overview
- 9.3.2. Key executives
- 9.3.3. Company snapshot
- 9.3.4. Operating business segments
- 9.3.5. Product portfolio
- 9.3.6. Business performance
- 9.3.7. Key strategic moves and developments
- 9.4. Canadian Natural
- 9.4.1. Company overview
- 9.4.2. Key executives
- 9.4.3. Company snapshot
- 9.4.4. Operating business segments
- 9.4.5. Product portfolio
- 9.4.6. Business performance
- 9.5. Suncor Energy Inc.
- 9.5.1. Company overview
- 9.5.2. Key executives
- 9.5.3. Company snapshot
- 9.5.4. Operating business segments
- 9.5.5. Product portfolio
- 9.5.6. Business performance
- 9.5.7. Key strategic moves and developments
- 9.6. Royal Dutch Shell plc
- 9.6.1. Company overview
- 9.6.2. Key executives
- 9.6.3. Company snapshot
- 9.6.4. Operating business segments
- 9.6.5. Product portfolio
- 9.6.6. Business performance
- 9.7. Cenovus Inc.
- 9.7.1. Company overview
- 9.7.2. Key executives
- 9.7.3. Company snapshot
- 9.7.4. Operating business segments
- 9.7.5. Product portfolio
- 9.7.6. Business performance
- 9.8. Sunshine Oilsands Ltd.
- 9.8.1. Company overview
- 9.8.2. Key executives
- 9.8.3. Company snapshot
- 9.8.4. Operating business segments
- 9.8.5. Product portfolio
- 9.8.6. Business performance
- 9.9. Chevron Corporation
- 9.9.1. Company overview
- 9.9.2. Key executives
- 9.9.3. Company snapshot
- 9.9.4. Operating business segments
- 9.9.5. Product portfolio
- 9.9.6. Business performance
- 9.9.7. Key strategic moves and developments
- 9.10. Athabasca Oil Corporation
- 9.10.1. Company overview
- 9.10.2. Key executives
- 9.10.3. Company snapshot
- 9.10.4. Operating business segments
- 9.10.5. Product portfolio
- 9.10.6. Business performance
LIST OF TABLES
- TABLE 01. GLOBAL UNCONVENTIONAL OIL MARKET, BY TYPE, 2023-2033 ($MILLION)
- TABLE 02. UNCONVENTIONAL OIL MARKET FOR OIL SHALE, BY REGION, 2023-2033 ($MILLION)
- TABLE 03. UNCONVENTIONAL OIL MARKET FOR BITUMEN, BY REGION, 2023-2033 ($MILLION)
- TABLE 04. UNCONVENTIONAL OIL MARKET FOR EXTRA HEAVY OIL, BY REGION, 2023-2033 ($MILLION)
- TABLE 05. UNCONVENTIONAL OIL MARKET FOR HEAVY OIL, BY REGION, 2023-2033 ($MILLION)
- TABLE 06. GLOBAL UNCONVENTIONAL OIL MARKET, BY TECHNOLOGY, 2023-2033 ($MILLION)
- TABLE 07. UNCONVENTIONAL OIL MARKET FOR STEAM ASSISTED GRAVITY DRAINAGE (SAGD), BY REGION, 2023-2033 ($MILLION)
- TABLE 08. UNCONVENTIONAL OIL MARKET FOR CYCLIC STEAM STIMULATION (CSS), BY REGION, 2023-2033 ($MILLION)
- TABLE 09. UNCONVENTIONAL OIL MARKET FOR EXPANDING SOLVENT STEAM ASSISTED GRAVITY DRAINAGE (ES SAGD), BY REGION, 2023-2033 ($MILLION)
- TABLE 10. UNCONVENTIONAL OIL MARKET FOR OTHERS, BY REGION, 2023-2033 ($MILLION)
- TABLE 11. GLOBAL UNCONVENTIONAL OIL MARKET, BY OPERATIONS, 2023-2033 ($MILLION)
- TABLE 12. UNCONVENTIONAL OIL MARKET FOR UPSTREAM, BY REGION, 2023-2033 ($MILLION)
- TABLE 13. UNCONVENTIONAL OIL MARKET FOR DOWNSTREAM, BY REGION, 2023-2033 ($MILLION)
- TABLE 14. UNCONVENTIONAL OIL MARKET FOR MIDSTREAM, BY REGION, 2023-2033 ($MILLION)
- TABLE 15. UNCONVENTIONAL OIL MARKET, BY REGION, 2023-2033 ($MILLION)
- TABLE 16. NORTH AMERICA UNCONVENTIONAL OIL MARKET, BY TYPE, 2023-2033 ($MILLION)
- TABLE 17. NORTH AMERICA UNCONVENTIONAL OIL MARKET, BY TECHNOLOGY, 2023-2033 ($MILLION)
- TABLE 18. NORTH AMERICA UNCONVENTIONAL OIL MARKET, BY OPERATIONS, 2023-2033 ($MILLION)
- TABLE 19. NORTH AMERICA UNCONVENTIONAL OIL MARKET, BY COUNTRY, 2023-2033 ($MILLION)
- TABLE 20. U.S. UNCONVENTIONAL OIL MARKET, BY TYPE, 2023-2033 ($MILLION)
- TABLE 21. U.S. UNCONVENTIONAL OIL MARKET, BY TECHNOLOGY, 2023-2033 ($MILLION)
- TABLE 22. U.S. UNCONVENTIONAL OIL MARKET, BY OPERATIONS, 2023-2033 ($MILLION)
- TABLE 23. CANADA UNCONVENTIONAL OIL MARKET, BY TYPE, 2023-2033 ($MILLION)
- TABLE 24. CANADA UNCONVENTIONAL OIL MARKET, BY TECHNOLOGY, 2023-2033 ($MILLION)
- TABLE 25. CANADA UNCONVENTIONAL OIL MARKET, BY OPERATIONS, 2023-2033 ($MILLION)
- TABLE 26. MEXICO UNCONVENTIONAL OIL MARKET, BY TYPE, 2023-2033 ($MILLION)
- TABLE 27. MEXICO UNCONVENTIONAL OIL MARKET, BY TECHNOLOGY, 2023-2033 ($MILLION)
- TABLE 28. MEXICO UNCONVENTIONAL OIL MARKET, BY OPERATIONS, 2023-2033 ($MILLION)
- TABLE 29. EUROPE UNCONVENTIONAL OIL MARKET, BY TYPE, 2023-2033 ($MILLION)
- TABLE 30. EUROPE UNCONVENTIONAL OIL MARKET, BY TECHNOLOGY, 2023-2033 ($MILLION)
- TABLE 31. EUROPE UNCONVENTIONAL OIL MARKET, BY OPERATIONS, 2023-2033 ($MILLION)
- TABLE 32. EUROPE UNCONVENTIONAL OIL MARKET, BY COUNTRY, 2023-2033 ($MILLION)
- TABLE 33. GERMANY UNCONVENTIONAL OIL MARKET, BY TYPE, 2023-2033 ($MILLION)
- TABLE 34. GERMANY UNCONVENTIONAL OIL MARKET, BY TECHNOLOGY, 2023-2033 ($MILLION)
- TABLE 35. GERMANY UNCONVENTIONAL OIL MARKET, BY OPERATIONS, 2023-2033 ($MILLION)
- TABLE 36. ITALY UNCONVENTIONAL OIL MARKET, BY TYPE, 2023-2033 ($MILLION)
- TABLE 37. ITALY UNCONVENTIONAL OIL MARKET, BY TECHNOLOGY, 2023-2033 ($MILLION)
- TABLE 38. ITALY UNCONVENTIONAL OIL MARKET, BY OPERATIONS, 2023-2033 ($MILLION)
- TABLE 39. SPAIN UNCONVENTIONAL OIL MARKET, BY TYPE, 2023-2033 ($MILLION)
- TABLE 40. SPAIN UNCONVENTIONAL OIL MARKET, BY TECHNOLOGY, 2023-2033 ($MILLION)
- TABLE 41. SPAIN UNCONVENTIONAL OIL MARKET, BY OPERATIONS, 2023-2033 ($MILLION)
- TABLE 42. FRANCE UNCONVENTIONAL OIL MARKET, BY TYPE, 2023-2033 ($MILLION)
- TABLE 43. FRANCE UNCONVENTIONAL OIL MARKET, BY TECHNOLOGY, 2023-2033 ($MILLION)
- TABLE 44. FRANCE UNCONVENTIONAL OIL MARKET, BY OPERATIONS, 2023-2033 ($MILLION)
- TABLE 45. UK UNCONVENTIONAL OIL MARKET, BY TYPE, 2023-2033 ($MILLION)
- TABLE 46. UK UNCONVENTIONAL OIL MARKET, BY TECHNOLOGY, 2023-2033 ($MILLION)
- TABLE 47. UK UNCONVENTIONAL OIL MARKET, BY OPERATIONS, 2023-2033 ($MILLION)
- TABLE 48. REST OF EUROPE UNCONVENTIONAL OIL MARKET, BY TYPE, 2023-2033 ($MILLION)
- TABLE 49. REST OF EUROPE UNCONVENTIONAL OIL MARKET, BY TECHNOLOGY, 2023-2033 ($MILLION)
- TABLE 50. REST OF EUROPE UNCONVENTIONAL OIL MARKET, BY OPERATIONS, 2023-2033 ($MILLION)
- TABLE 51. ASIA-PACIFIC UNCONVENTIONAL OIL MARKET, BY TYPE, 2023-2033 ($MILLION)
- TABLE 52. ASIA-PACIFIC UNCONVENTIONAL OIL MARKET, BY TECHNOLOGY, 2023-2033 ($MILLION)
- TABLE 53. ASIA-PACIFIC UNCONVENTIONAL OIL MARKET, BY OPERATIONS, 2023-2033 ($MILLION)
- TABLE 54. ASIA-PACIFIC UNCONVENTIONAL OIL MARKET, BY COUNTRY, 2023-2033 ($MILLION)
- TABLE 55. CHINA UNCONVENTIONAL OIL MARKET, BY TYPE, 2023-2033 ($MILLION)
- TABLE 56. CHINA UNCONVENTIONAL OIL MARKET, BY TECHNOLOGY, 2023-2033 ($MILLION)
- TABLE 57. CHINA UNCONVENTIONAL OIL MARKET, BY OPERATIONS, 2023-2033 ($MILLION)
- TABLE 58. INDIA UNCONVENTIONAL OIL MARKET, BY TYPE, 2023-2033 ($MILLION)
- TABLE 59. INDIA UNCONVENTIONAL OIL MARKET, BY TECHNOLOGY, 2023-2033 ($MILLION)
- TABLE 60. INDIA UNCONVENTIONAL OIL MARKET, BY OPERATIONS, 2023-2033 ($MILLION)
- TABLE 61. AUSTRALIA UNCONVENTIONAL OIL MARKET, BY TYPE, 2023-2033 ($MILLION)
- TABLE 62. AUSTRALIA UNCONVENTIONAL OIL MARKET, BY TECHNOLOGY, 2023-2033 ($MILLION)
- TABLE 63. AUSTRALIA UNCONVENTIONAL OIL MARKET, BY OPERATIONS, 2023-2033 ($MILLION)
- TABLE 64. SOUTH KOREA UNCONVENTIONAL OIL MARKET, BY TYPE, 2023-2033 ($MILLION)
- TABLE 65. SOUTH KOREA UNCONVENTIONAL OIL MARKET, BY TECHNOLOGY, 2023-2033 ($MILLION)
- TABLE 66. SOUTH KOREA UNCONVENTIONAL OIL MARKET, BY OPERATIONS, 2023-2033 ($MILLION)
- TABLE 67. JAPAN UNCONVENTIONAL OIL MARKET, BY TYPE, 2023-2033 ($MILLION)
- TABLE 68. JAPAN UNCONVENTIONAL OIL MARKET, BY TECHNOLOGY, 2023-2033 ($MILLION)
- TABLE 69. JAPAN UNCONVENTIONAL OIL MARKET, BY OPERATIONS, 2023-2033 ($MILLION)
- TABLE 70. REST OF ASIA-PACIFIC UNCONVENTIONAL OIL MARKET, BY TYPE, 2023-2033 ($MILLION)
- TABLE 71. REST OF ASIA-PACIFIC UNCONVENTIONAL OIL MARKET, BY TECHNOLOGY, 2023-2033 ($MILLION)
- TABLE 72. REST OF ASIA-PACIFIC UNCONVENTIONAL OIL MARKET, BY OPERATIONS, 2023-2033 ($MILLION)
- TABLE 73. LAMEA UNCONVENTIONAL OIL MARKET, BY TYPE, 2023-2033 ($MILLION)
- TABLE 74. LAMEA UNCONVENTIONAL OIL MARKET, BY TECHNOLOGY, 2023-2033 ($MILLION)
- TABLE 75. LAMEA UNCONVENTIONAL OIL MARKET, BY OPERATIONS, 2023-2033 ($MILLION)
- TABLE 76. LAMEA UNCONVENTIONAL OIL MARKET, BY COUNTRY, 2023-2033 ($MILLION)
- TABLE 77. BRAZIL UNCONVENTIONAL OIL MARKET, BY TYPE, 2023-2033 ($MILLION)
- TABLE 78. BRAZIL UNCONVENTIONAL OIL MARKET, BY TECHNOLOGY, 2023-2033 ($MILLION)
- TABLE 79. BRAZIL UNCONVENTIONAL OIL MARKET, BY OPERATIONS, 2023-2033 ($MILLION)
- TABLE 80. SOUTH AFRICA UNCONVENTIONAL OIL MARKET, BY TYPE, 2023-2033 ($MILLION)
- TABLE 81. SOUTH AFRICA UNCONVENTIONAL OIL MARKET, BY TECHNOLOGY, 2023-2033 ($MILLION)
- TABLE 82. SOUTH AFRICA UNCONVENTIONAL OIL MARKET, BY OPERATIONS, 2023-2033 ($MILLION)
- TABLE 83. SAUDI ARABIA UNCONVENTIONAL OIL MARKET, BY TYPE, 2023-2033 ($MILLION)
- TABLE 84. SAUDI ARABIA UNCONVENTIONAL OIL MARKET, BY TECHNOLOGY, 2023-2033 ($MILLION)
- TABLE 85. SAUDI ARABIA UNCONVENTIONAL OIL MARKET, BY OPERATIONS, 2023-2033 ($MILLION)
- TABLE 86. REST OF LAMEA UNCONVENTIONAL OIL MARKET, BY TYPE, 2023-2033 ($MILLION)
- TABLE 87. REST OF LAMEA UNCONVENTIONAL OIL MARKET, BY TECHNOLOGY, 2023-2033 ($MILLION)
- TABLE 88. REST OF LAMEA UNCONVENTIONAL OIL MARKET, BY OPERATIONS, 2023-2033 ($MILLION)
- TABLE 89. IMPERIAL OIL LIMITED: KEY EXECUTIVES
- TABLE 90. IMPERIAL OIL LIMITED: COMPANY SNAPSHOT
- TABLE 91. IMPERIAL OIL LIMITED: PRODUCT SEGMENTS
- TABLE 92. IMPERIAL OIL LIMITED: PRODUCT PORTFOLIO
- TABLE 93. CONOCOPHILLIPS COMPANY: KEY EXECUTIVES
- TABLE 94. CONOCOPHILLIPS COMPANY: COMPANY SNAPSHOT
- TABLE 95. CONOCOPHILLIPS COMPANY: PRODUCT SEGMENTS
- TABLE 96. CONOCOPHILLIPS COMPANY: PRODUCT PORTFOLIO
- TABLE 97. EXXON MOBIL CORPORATION: KEY EXECUTIVES
- TABLE 98. EXXON MOBIL CORPORATION: COMPANY SNAPSHOT
- TABLE 99. EXXON MOBIL CORPORATION: PRODUCT SEGMENTS
- TABLE 100. EXXON MOBIL CORPORATION: PRODUCT PORTFOLIO
- TABLE 101. EXXON MOBIL CORPORATION: KEY STRATEGIES
- TABLE 102. CANADIAN NATURAL: KEY EXECUTIVES
- TABLE 103. CANADIAN NATURAL: COMPANY SNAPSHOT
- TABLE 104. CANADIAN NATURAL: PRODUCT SEGMENTS
- TABLE 105. CANADIAN NATURAL: PRODUCT PORTFOLIO
- TABLE 106. SUNCOR ENERGY INC.: KEY EXECUTIVES
- TABLE 107. SUNCOR ENERGY INC.: COMPANY SNAPSHOT
- TABLE 108. SUNCOR ENERGY INC.: PRODUCT SEGMENTS
- TABLE 109. SUNCOR ENERGY INC.: PRODUCT PORTFOLIO
- TABLE 110. SUNCOR ENERGY INC.: KEY STRATEGIES
- TABLE 111. ROYAL DUTCH SHELL PLC: KEY EXECUTIVES
- TABLE 112. ROYAL DUTCH SHELL PLC: COMPANY SNAPSHOT
- TABLE 113. ROYAL DUTCH SHELL PLC: PRODUCT SEGMENTS
- TABLE 114. ROYAL DUTCH SHELL PLC: PRODUCT PORTFOLIO
- TABLE 115. CENOVUS INC.: KEY EXECUTIVES
- TABLE 116. CENOVUS INC.: COMPANY SNAPSHOT
- TABLE 117. CENOVUS INC.: PRODUCT SEGMENTS
- TABLE 118. CENOVUS INC.: PRODUCT PORTFOLIO
- TABLE 119. SUNSHINE OILSANDS LTD.: KEY EXECUTIVES
- TABLE 120. SUNSHINE OILSANDS LTD.: COMPANY SNAPSHOT
- TABLE 121. SUNSHINE OILSANDS LTD.: PRODUCT SEGMENTS
- TABLE 122. SUNSHINE OILSANDS LTD.: PRODUCT PORTFOLIO
- TABLE 123. CHEVRON CORPORATION: KEY EXECUTIVES
- TABLE 124. CHEVRON CORPORATION: COMPANY SNAPSHOT
- TABLE 125. CHEVRON CORPORATION: PRODUCT SEGMENTS
- TABLE 126. CHEVRON CORPORATION: PRODUCT PORTFOLIO
- TABLE 127. CHEVRON CORPORATION: KEY STRATEGIES
- TABLE 128. ATHABASCA OIL CORPORATION: KEY EXECUTIVES
- TABLE 129. ATHABASCA OIL CORPORATION: COMPANY SNAPSHOT
- TABLE 130. ATHABASCA OIL CORPORATION: PRODUCT SEGMENTS
- TABLE 131. ATHABASCA OIL CORPORATION: PRODUCT PORTFOLIO
LIST OF FIGURES
- FIGURE 01. UNCONVENTIONAL OIL MARKET, 2023-2033
- FIGURE 02. SEGMENTATION OF UNCONVENTIONAL OIL MARKET,2023-2033
- FIGURE 03. TOP IMPACTING FACTORS IN UNCONVENTIONAL OIL MARKET (2023 TO 2033)
- FIGURE 04. TOP INVESTMENT POCKETS IN UNCONVENTIONAL OIL MARKET (2024-2033)
- FIGURE 05. MODERATE THREAT OF NEW ENTRANTS
- FIGURE 06. MODERATE INTENSITY OF RIVALRY
- FIGURE 07. MODERATE BARGAINING POWER OF BUYERS
- FIGURE 08. MODERATE BARGAINING POWER OF SUPPLIERS
- FIGURE 09. MODERATE THREAT OF SUBSTITUTES
- FIGURE 10. GLOBAL UNCONVENTIONAL OIL MARKET:DRIVERS, RESTRAINTS AND OPPORTUNITIES
- FIGURE 11. IMPACT OF KEY REGULATION: UNCONVENTIONAL OIL MARKET
- FIGURE 12. UNCONVENTIONAL OIL MARKET, BY TYPE, 2023 AND 2033(%)
- FIGURE 13. COMPARATIVE SHARE ANALYSIS OF UNCONVENTIONAL OIL MARKET FOR OIL SHALE, BY COUNTRY 2023 AND 2033(%)
- FIGURE 14. COMPARATIVE SHARE ANALYSIS OF UNCONVENTIONAL OIL MARKET FOR BITUMEN, BY COUNTRY 2023 AND 2033(%)
- FIGURE 15. COMPARATIVE SHARE ANALYSIS OF UNCONVENTIONAL OIL MARKET FOR EXTRA HEAVY OIL, BY COUNTRY 2023 AND 2033(%)
- FIGURE 16. COMPARATIVE SHARE ANALYSIS OF UNCONVENTIONAL OIL MARKET FOR HEAVY OIL, BY COUNTRY 2023 AND 2033(%)
- FIGURE 17. UNCONVENTIONAL OIL MARKET, BY TECHNOLOGY, 2023 AND 2033(%)
- FIGURE 18. COMPARATIVE SHARE ANALYSIS OF UNCONVENTIONAL OIL MARKET FOR STEAM ASSISTED GRAVITY DRAINAGE (SAGD), BY COUNTRY 2023 AND 2033(%)
- FIGURE 19. COMPARATIVE SHARE ANALYSIS OF UNCONVENTIONAL OIL MARKET FOR CYCLIC STEAM STIMULATION (CSS), BY COUNTRY 2023 AND 2033(%)
- FIGURE 20. COMPARATIVE SHARE ANALYSIS OF UNCONVENTIONAL OIL MARKET FOR EXPANDING SOLVENT STEAM ASSISTED GRAVITY DRAINAGE (ES SAGD), BY COUNTRY 2023 AND 2033(%)
- FIGURE 21. COMPARATIVE SHARE ANALYSIS OF UNCONVENTIONAL OIL MARKET FOR OTHERS, BY COUNTRY 2023 AND 2033(%)
- FIGURE 22. UNCONVENTIONAL OIL MARKET, BY OPERATIONS, 2023 AND 2033(%)
- FIGURE 23. COMPARATIVE SHARE ANALYSIS OF UNCONVENTIONAL OIL MARKET FOR UPSTREAM, BY COUNTRY 2023 AND 2033(%)
- FIGURE 24. COMPARATIVE SHARE ANALYSIS OF UNCONVENTIONAL OIL MARKET FOR DOWNSTREAM, BY COUNTRY 2023 AND 2033(%)
- FIGURE 25. COMPARATIVE SHARE ANALYSIS OF UNCONVENTIONAL OIL MARKET FOR MIDSTREAM, BY COUNTRY 2023 AND 2033(%)
- FIGURE 26. UNCONVENTIONAL OIL MARKET BY REGION, 2023 AND 2033(%)
- FIGURE 27. U.S. UNCONVENTIONAL OIL MARKET, 2023-2033 ($MILLION)
- FIGURE 28. CANADA UNCONVENTIONAL OIL MARKET, 2023-2033 ($MILLION)
- FIGURE 29. MEXICO UNCONVENTIONAL OIL MARKET, 2023-2033 ($MILLION)
- FIGURE 30. GERMANY UNCONVENTIONAL OIL MARKET, 2023-2033 ($MILLION)
- FIGURE 31. ITALY UNCONVENTIONAL OIL MARKET, 2023-2033 ($MILLION)
- FIGURE 32. SPAIN UNCONVENTIONAL OIL MARKET, 2023-2033 ($MILLION)
- FIGURE 33. FRANCE UNCONVENTIONAL OIL MARKET, 2023-2033 ($MILLION)
- FIGURE 34. UK UNCONVENTIONAL OIL MARKET, 2023-2033 ($MILLION)
- FIGURE 35. REST OF EUROPE UNCONVENTIONAL OIL MARKET, 2023-2033 ($MILLION)
- FIGURE 36. CHINA UNCONVENTIONAL OIL MARKET, 2023-2033 ($MILLION)
- FIGURE 37. INDIA UNCONVENTIONAL OIL MARKET, 2023-2033 ($MILLION)
- FIGURE 38. AUSTRALIA UNCONVENTIONAL OIL MARKET, 2023-2033 ($MILLION)
- FIGURE 39. SOUTH KOREA UNCONVENTIONAL OIL MARKET, 2023-2033 ($MILLION)
- FIGURE 40. JAPAN UNCONVENTIONAL OIL MARKET, 2023-2033 ($MILLION)
- FIGURE 41. REST OF ASIA-PACIFIC UNCONVENTIONAL OIL MARKET, 2023-2033 ($MILLION)
- FIGURE 42. BRAZIL UNCONVENTIONAL OIL MARKET, 2023-2033 ($MILLION)
- FIGURE 43. SOUTH AFRICA UNCONVENTIONAL OIL MARKET, 2023-2033 ($MILLION)
- FIGURE 44. SAUDI ARABIA UNCONVENTIONAL OIL MARKET, 2023-2033 ($MILLION)
- FIGURE 45. REST OF LAMEA UNCONVENTIONAL OIL MARKET, 2023-2033 ($MILLION)
- FIGURE 46. TOP WINNING STRATEGIES, BY YEAR (2023-2023)
- FIGURE 47. TOP WINNING STRATEGIES, BY DEVELOPMENT (2023-2023)
- FIGURE 48. TOP WINNING STRATEGIES, BY COMPANY (2023-2023)
- FIGURE 49. PRODUCT MAPPING OF TOP 10 PLAYERS
- FIGURE 50. COMPETITIVE DASHBOARD
- FIGURE 51. COMPETITIVE HEATMAP: UNCONVENTIONAL OIL MARKET
- FIGURE 52. TOP PLAYER POSITIONING, 2023
- FIGURE 53. IMPERIAL OIL LIMITED: NET REVENUE, 2021-2023 ($MILLION)
- FIGURE 54. IMPERIAL OIL LIMITED: RESEARCH & DEVELOPMENT EXPENDITURE, 2021-2023 ($MILLION)
- FIGURE 55. IMPERIAL OIL LIMITED: REVENUE SHARE BY SEGMENT, 2023 (%)
- FIGURE 56. CONOCOPHILLIPS COMPANY: NET REVENUE, 2021-2023 ($MILLION)
- FIGURE 57. CONOCOPHILLIPS COMPANY: REVENUE SHARE BY SEGMENT, 2023 (%)
- FIGURE 58. CONOCOPHILLIPS COMPANY: REVENUE SHARE BY REGION, 2022 (%)
- FIGURE 59. EXXON MOBIL CORPORATION: NET REVENUE, 2021-2023 ($MILLION)
- FIGURE 60. EXXON MOBIL CORPORATION: RESEARCH & DEVELOPMENT EXPENDITURE, 2021-2023 ($MILLION)
- FIGURE 61. EXXON MOBIL CORPORATION: REVENUE SHARE BY SEGMENT, 2023 (%)
- FIGURE 62. EXXON MOBIL CORPORATION: REVENUE SHARE BY REGION, 2023 (%)
- FIGURE 63. CANADIAN NATURAL: NET SALES, 2021-2023 ($MILLION)
- FIGURE 64. CANADIAN NATURAL: REVENUE SHARE BY SEGMENT, 2023 (%)
- FIGURE 65. SUNCOR ENERGY INC.: NET REVENUE, 2021-2023 ($MILLION)
- FIGURE 66. SUNCOR ENERGY INC.: REVENUE SHARE BY SEGMENT, 2023 (%)
- FIGURE 67. SUNCOR ENERGY INC.: REVENUE SHARE BY REGION, 2023 (%)
- FIGURE 68. ROYAL DUTCH SHELL PLC: NET REVENUE, 2021-2023 ($MILLION)
- FIGURE 69. ROYAL DUTCH SHELL PLC: RESEARCH & DEVELOPMENT EXPENDITURE, 2021-2023 ($MILLION)
- FIGURE 70. ROYAL DUTCH SHELL PLC: REVENUE SHARE BY SEGMENT, 2023 (%)
- FIGURE 71. ROYAL DUTCH SHELL PLC: REVENUE SHARE BY REGION, 2023 (%)
- FIGURE 72. CENOVUS INC.: NET REVENUE, 2021-2023 ($MILLION)
- FIGURE 73. CENOVUS INC.: REVENUE SHARE BY REGION, 2023 (%)
- FIGURE 74. CENOVUS INC.: REVENUE SHARE BY SEGMENT, 2023 (%)
- FIGURE 75. SUNSHINE OILSANDS LTD.: NET REVENUE, 2020-2022 ($MILLION)
- FIGURE 76. CHEVRON CORPORATION: NET REVENUE, 2020-2022 ($MILLION)
- FIGURE 77. CHEVRON CORPORATION: RESEARCH & DEVELOPMENT EXPENDITURE, 2020-2022 ($MILLION)
- FIGURE 78. CHEVRON CORPORATION: REVENUE SHARE BY SEGMENT, 2023 (%)
- FIGURE 79. ATHABASCA OIL CORPORATION: NET REVENUE, 2021-2023 ($MILLION)
- FIGURE 80. ATHABASCA OIL CORPORATION: REVENUE SHARE BY SEGMENT, 2023 (%)

