
PUBLISHER: Allied Market Research | PRODUCT CODE: 1513373

PUBLISHER: Allied Market Research | PRODUCT CODE: 1513373
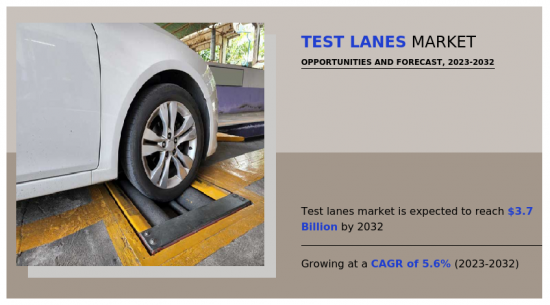
Test Lanes Market By Test Type, By Technology, By Vehicle Type : Global Opportunity Analysis and Industry Forecast, 2023-2032
The global test lanes market was valued at $2,141.5 million in 2022, and is projected to reach $3,664.4 million by 2032, registering a CAGR of 5.6% from 2023 to 2032. A test lane, also known as a testing or inspection lane, is a designated sector within a facility where vehicles undergo various checks to ensure they meet safety, emissions, and roadworthiness criteria. These assessments typically involve examining key components such as brakes, lights, emissions and other test. Test lanes are commonly utilized in automotive service centers, government inspection facilities, and other establishments, responsible for evaluating vehicle condition and compliance.
Safety and reliability are important concerns for vehicle owners, regulators, and manufacturers. Test lane services play a critical role in ensuring that vehicles meet safety standards and perform reliably on the road. Regular testing and inspection helps identify potential safety hazards, mechanical issues, and component failures before they lead to accidents or breakdowns. In addition, proactive maintenance and diagnostics improve vehicle reliability, reducing the likelihood of unexpected failures and costly repairs. The focus on vehicle safety and reliability drives demand for test lane services, as vehicle owners seek to ensure the safety of themselves, their passengers, and other road users. Furthermore, regulatory requirements mandating periodic vehicle inspections for safety and emissions compliance further bolster the demand for test lane services, providing a constant move of customers for operators in the market.
Governments globally enact and enforce regulations mandating periodic vehicle inspections to ensure compliance with safety and environmental standards. For instance, emissions testing aims to curb air pollution by monitoring vehicle exhaust emissions, while safety inspections focus on assessing critical components such as brakes, lights, and tires to ensure roadworthiness. These regulations create a steady demand for test lane services as vehicle owners must adhere to mandated testing intervals. In addition, evolving regulations, such as stricter emission standards or enhanced safety requirements, may necessitate more frequent or comprehensive testing, further driving demand for test lanes. Such instances are expected to drive the market growth.
One of the primary restraints in the test lane market is the significant upfront investment required to establish and maintain test lane facilities. Building a test lane involves substantial costs, including land acquisition, construction, equipment purchase, and staff training. The complexity of modern test lanes, which often incorporate advanced testing equipment and technologies, further amplifies the initial investment requirements. In addition, ongoing operational costs, such as maintenance, calibration, and regulatory compliance, add to the financial burden. This high capital expenditure presents a barrier to entry for new market players and may deter existing operators from expanding or upgrading their facilities.
Furthermore, integration of digital technologies presents a significant opportunity for innovation and growth in the test lane market. Advancements in automation, artificial intelligence (AI), and data analytics offer transformative capabilities to enhance the efficiency, accuracy, and reliability of test lane operations. In addition, test lane operators have the opportunity to expand their service offerings beyond traditional testing and inspection services. By diversifying their offerings to include vehicle diagnostics, maintenance, and repair services, operators can cater to the broader automotive aftermarket and capture additional revenue streams. For instance, offering diagnostic services using advanced scanning tools and software allows operators to identify and address vehicle issues proactively, enhancing customer satisfaction and loyalty. Such factors are expected to offer lucrative opportunities for the market growth.
The test lane market is segmented on the basis of vehicle type, technology, test type, and region. By vehicle type, the market is divided into passenger cars, commercial vehicles, and motorcycles. By technology, the market is divided into manual test lanes and automated test lanes. By test type, the market is divided into emissions test lanes, brake test lanes, suspension test lanes, headlight alignment test lanes, alignment test lanes and others. Region-wise, it is analyzed across North America (the U.S., Canada, and Mexico), Europe (the UK, France, Germany, Italy, and rest of Europe), Asia-Pacific (China, Japan, India, South Korea, and rest of Asia-Pacific), Latin America, and Middle East & Africa.
The major market participants profiled in this report include Boston Garage Equipment Ltd., Crypton Technology Ltd., Cormach Test Lane Systems, MAHA Maschinenbau Haldenwang GmbH & Co. KG, Hofmann Megaplan, VTEQ, Capelec, Snap On Vehicle Service Group Italy S.r.l., Butler Vehicle Service Group Italy S.r.l., and ATS ELGI.
Key Benefits For Stakeholders
- This report provides a quantitative analysis of the market segments, current trends, estimations, and dynamics of the test lanes market analysis from 2022 to 2032 to identify the prevailing test lanes market opportunities.
- The market research is offered along with information related to key drivers, restraints, and opportunities.
- Porter's five forces analysis highlights the potency of buyers and suppliers to enable stakeholders make profit-oriented business decisions and strengthen their supplier-buyer network.
- In-depth analysis of the test lanes market segmentation assists to determine the prevailing market opportunities.
- Major countries in each region are mapped according to their revenue contribution to the global market.
- Market player positioning facilitates benchmarking and provides a clear understanding of the present position of the market players.
- The report includes the analysis of the regional as well as global test lanes market trends, key players, market segments, application areas, and market growth strategies.
Additional benefits you will get with this purchase are:
- Quarterly Update and* (only available with a corporate license, on listed price)
- 5 additional Company Profile of client Choice pre- or Post-purchase, as a free update.
- Free Upcoming Version on the Purchase of Five and Enterprise User License.
- 16 analyst hours of support* (post-purchase, if you find additional data requirements upon review of the report, you may receive support amounting to 16 analyst hours to solve questions, and post-sale queries)
- 15% Free Customization* (in case the scope or segment of the report does not match your requirements, 15% is equivalent to 3 working days of free work, applicable once)
- Free data Pack on the Five and Enterprise User License. (Excel version of the report)
- Free Updated report if the report is 6-12 months old or older.
- 24-hour priority response*
- Free Industry updates and white papers.
Possible Customization with this report (with additional cost and timeline, please talk to the sales executive to know more)
- Additional company profiles with specific to client's interest
- Additional country or region analysis- market size and forecast
- Expanded list for Company Profiles
- Historic market data
Key Market Segments
By Test Type
- Emissions Test Lanes
- Brake Test Lanes
- Suspension Test Lanes
- Headlight Alignment Test Lanes
- Alignment Test Lanes
- Others
By Technology
- Manual Test Lanes
- Automated Test Lanes
By Vehicle Type
- Passenger Cars
- Commercial Vehicles
- Motorcycles
By Region
- North America
- U.S.
- Canada
- Mexico
- Europe
- Germany
- France
- Italy
- UK
- Rest of Europe
- Asia-Pacific
- China
- Japan
- India
- South Korea
- Rest of Asia-Pacific
- Latin America
- Brazil
- Chile
- Rest of Latin America
- Middle East and Africa
- Saudi Arabia
- UAE
- Nigeria
- South Africa
- Rest of Middle East And Africa
Key Market Players:
- Boston Garage Equipment Ltd.
- Crypton Technology Ltd.
- Cormach Test Lane Systems
- MAHA Maschinenbau Haldenwang GmbH & Co. KG
- Hofmann Megaplan GmbH
- VTEQ
- Capelec
- ATS ELGI.
- Butler Vehicle Service Group Italy S.r.l.
- Josam
TABLE OF CONTENTS
CHAPTER 1: INTRODUCTION
- 1.1. Report description
- 1.2. Key market segments
- 1.3. Key benefits to the stakeholders
- 1.4. Research methodology
- 1.4.1. Primary research
- 1.4.2. Secondary research
- 1.4.3. Analyst tools and models
CHAPTER 2: EXECUTIVE SUMMARY
- 2.1. CXO perspective
CHAPTER 3: MARKET OVERVIEW
- 3.1. Market definition and scope
- 3.2. Key findings
- 3.2.1. Top impacting factors
- 3.2.2. Top investment pockets
- 3.3. Porter's five forces analysis
- 3.4. Market dynamics
- 3.4.1. Drivers
- 3.4.2. Restraints
- 3.4.3. Opportunities
CHAPTER 4: TEST LANES MARKET, BY TEST TYPE
- 4.1. Overview
- 4.1.1. Market size and forecast
- 4.2. Emissions Test Lanes
- 4.2.1. Key market trends, growth factors and opportunities
- 4.2.2. Market size and forecast, by region
- 4.2.3. Market share analysis by country
- 4.3. Brake Test Lanes
- 4.3.1. Key market trends, growth factors and opportunities
- 4.3.2. Market size and forecast, by region
- 4.3.3. Market share analysis by country
- 4.4. Suspension Test Lanes
- 4.4.1. Key market trends, growth factors and opportunities
- 4.4.2. Market size and forecast, by region
- 4.4.3. Market share analysis by country
- 4.5. Headlight Alignment Test Lanes
- 4.5.1. Key market trends, growth factors and opportunities
- 4.5.2. Market size and forecast, by region
- 4.5.3. Market share analysis by country
- 4.6. Alignment Test Lanes
- 4.6.1. Key market trends, growth factors and opportunities
- 4.6.2. Market size and forecast, by region
- 4.6.3. Market share analysis by country
- 4.7. Others
- 4.7.1. Key market trends, growth factors and opportunities
- 4.7.2. Market size and forecast, by region
- 4.7.3. Market share analysis by country
CHAPTER 5: TEST LANES MARKET, BY TECHNOLOGY
- 5.1. Overview
- 5.1.1. Market size and forecast
- 5.2. Manual Test Lanes
- 5.2.1. Key market trends, growth factors and opportunities
- 5.2.2. Market size and forecast, by region
- 5.2.3. Market share analysis by country
- 5.3. Automated Test Lanes
- 5.3.1. Key market trends, growth factors and opportunities
- 5.3.2. Market size and forecast, by region
- 5.3.3. Market share analysis by country
CHAPTER 6: TEST LANES MARKET, BY VEHICLE TYPE
- 6.1. Overview
- 6.1.1. Market size and forecast
- 6.2. Passenger Cars
- 6.2.1. Key market trends, growth factors and opportunities
- 6.2.2. Market size and forecast, by region
- 6.2.3. Market share analysis by country
- 6.3. Commercial Vehicles
- 6.3.1. Key market trends, growth factors and opportunities
- 6.3.2. Market size and forecast, by region
- 6.3.3. Market share analysis by country
- 6.4. Motorcycles
- 6.4.1. Key market trends, growth factors and opportunities
- 6.4.2. Market size and forecast, by region
- 6.4.3. Market share analysis by country
CHAPTER 7: TEST LANES MARKET, BY REGION
- 7.1. Overview
- 7.1.1. Market size and forecast By Region
- 7.2. North America
- 7.2.1. Key market trends, growth factors and opportunities
- 7.2.2. Market size and forecast, by Test Type
- 7.2.3. Market size and forecast, by Technology
- 7.2.4. Market size and forecast, by Vehicle Type
- 7.2.5. Market size and forecast, by country
- 7.2.5.1. U.S.
- 7.2.5.1.1. Market size and forecast, by Test Type
- 7.2.5.1.2. Market size and forecast, by Technology
- 7.2.5.1.3. Market size and forecast, by Vehicle Type
- 7.2.5.2. Canada
- 7.2.5.2.1. Market size and forecast, by Test Type
- 7.2.5.2.2. Market size and forecast, by Technology
- 7.2.5.2.3. Market size and forecast, by Vehicle Type
- 7.2.5.3. Mexico
- 7.2.5.3.1. Market size and forecast, by Test Type
- 7.2.5.3.2. Market size and forecast, by Technology
- 7.2.5.3.3. Market size and forecast, by Vehicle Type
- 7.3. Europe
- 7.3.1. Key market trends, growth factors and opportunities
- 7.3.2. Market size and forecast, by Test Type
- 7.3.3. Market size and forecast, by Technology
- 7.3.4. Market size and forecast, by Vehicle Type
- 7.3.5. Market size and forecast, by country
- 7.3.5.1. Germany
- 7.3.5.1.1. Market size and forecast, by Test Type
- 7.3.5.1.2. Market size and forecast, by Technology
- 7.3.5.1.3. Market size and forecast, by Vehicle Type
- 7.3.5.2. France
- 7.3.5.2.1. Market size and forecast, by Test Type
- 7.3.5.2.2. Market size and forecast, by Technology
- 7.3.5.2.3. Market size and forecast, by Vehicle Type
- 7.3.5.3. Italy
- 7.3.5.3.1. Market size and forecast, by Test Type
- 7.3.5.3.2. Market size and forecast, by Technology
- 7.3.5.3.3. Market size and forecast, by Vehicle Type
- 7.3.5.4. UK
- 7.3.5.4.1. Market size and forecast, by Test Type
- 7.3.5.4.2. Market size and forecast, by Technology
- 7.3.5.4.3. Market size and forecast, by Vehicle Type
- 7.3.5.5. Rest of Europe
- 7.3.5.5.1. Market size and forecast, by Test Type
- 7.3.5.5.2. Market size and forecast, by Technology
- 7.3.5.5.3. Market size and forecast, by Vehicle Type
- 7.4. Asia-Pacific
- 7.4.1. Key market trends, growth factors and opportunities
- 7.4.2. Market size and forecast, by Test Type
- 7.4.3. Market size and forecast, by Technology
- 7.4.4. Market size and forecast, by Vehicle Type
- 7.4.5. Market size and forecast, by country
- 7.4.5.1. China
- 7.4.5.1.1. Market size and forecast, by Test Type
- 7.4.5.1.2. Market size and forecast, by Technology
- 7.4.5.1.3. Market size and forecast, by Vehicle Type
- 7.4.5.2. Japan
- 7.4.5.2.1. Market size and forecast, by Test Type
- 7.4.5.2.2. Market size and forecast, by Technology
- 7.4.5.2.3. Market size and forecast, by Vehicle Type
- 7.4.5.3. India
- 7.4.5.3.1. Market size and forecast, by Test Type
- 7.4.5.3.2. Market size and forecast, by Technology
- 7.4.5.3.3. Market size and forecast, by Vehicle Type
- 7.4.5.4. South Korea
- 7.4.5.4.1. Market size and forecast, by Test Type
- 7.4.5.4.2. Market size and forecast, by Technology
- 7.4.5.4.3. Market size and forecast, by Vehicle Type
- 7.4.5.5. Rest of Asia-Pacific
- 7.4.5.5.1. Market size and forecast, by Test Type
- 7.4.5.5.2. Market size and forecast, by Technology
- 7.4.5.5.3. Market size and forecast, by Vehicle Type
- 7.5. Latin America
- 7.5.1. Key market trends, growth factors and opportunities
- 7.5.2. Market size and forecast, by Test Type
- 7.5.3. Market size and forecast, by Technology
- 7.5.4. Market size and forecast, by Vehicle Type
- 7.5.5. Market size and forecast, by country
- 7.5.5.1. Brazil
- 7.5.5.1.1. Market size and forecast, by Test Type
- 7.5.5.1.2. Market size and forecast, by Technology
- 7.5.5.1.3. Market size and forecast, by Vehicle Type
- 7.5.5.2. Chile
- 7.5.5.2.1. Market size and forecast, by Test Type
- 7.5.5.2.2. Market size and forecast, by Technology
- 7.5.5.2.3. Market size and forecast, by Vehicle Type
- 7.5.5.3. Rest of Latin America
- 7.5.5.3.1. Market size and forecast, by Test Type
- 7.5.5.3.2. Market size and forecast, by Technology
- 7.5.5.3.3. Market size and forecast, by Vehicle Type
- 7.6. Middle East and Africa
- 7.6.1. Key market trends, growth factors and opportunities
- 7.6.2. Market size and forecast, by Test Type
- 7.6.3. Market size and forecast, by Technology
- 7.6.4. Market size and forecast, by Vehicle Type
- 7.6.5. Market size and forecast, by country
- 7.6.5.1. Saudi Arabia
- 7.6.5.1.1. Market size and forecast, by Test Type
- 7.6.5.1.2. Market size and forecast, by Technology
- 7.6.5.1.3. Market size and forecast, by Vehicle Type
- 7.6.5.2. UAE
- 7.6.5.2.1. Market size and forecast, by Test Type
- 7.6.5.2.2. Market size and forecast, by Technology
- 7.6.5.2.3. Market size and forecast, by Vehicle Type
- 7.6.5.3. Nigeria
- 7.6.5.3.1. Market size and forecast, by Test Type
- 7.6.5.3.2. Market size and forecast, by Technology
- 7.6.5.3.3. Market size and forecast, by Vehicle Type
- 7.6.5.4. South Africa
- 7.6.5.4.1. Market size and forecast, by Test Type
- 7.6.5.4.2. Market size and forecast, by Technology
- 7.6.5.4.3. Market size and forecast, by Vehicle Type
- 7.6.5.5. Rest of Middle East And Africa
- 7.6.5.5.1. Market size and forecast, by Test Type
- 7.6.5.5.2. Market size and forecast, by Technology
- 7.6.5.5.3. Market size and forecast, by Vehicle Type
CHAPTER 8: COMPETITIVE LANDSCAPE
- 8.1. Introduction
- 8.2. Top winning strategies
- 8.3. Product mapping of top 10 player
- 8.4. Competitive dashboard
- 8.5. Competitive heatmap
- 8.6. Top player positioning, 2022
CHAPTER 9: COMPANY PROFILES
- 9.1. Boston Garage Equipment Ltd.
- 9.1.1. Company overview
- 9.1.2. Key executives
- 9.1.3. Company snapshot
- 9.1.4. Operating business segments
- 9.1.5. Product portfolio
- 9.1.6. Business performance
- 9.1.7. Key strategic moves and developments
- 9.2. Crypton Technology Ltd.
- 9.2.1. Company overview
- 9.2.2. Key executives
- 9.2.3. Company snapshot
- 9.2.4. Operating business segments
- 9.2.5. Product portfolio
- 9.2.6. Business performance
- 9.2.7. Key strategic moves and developments
- 9.3. Cormach Test Lane Systems
- 9.3.1. Company overview
- 9.3.2. Key executives
- 9.3.3. Company snapshot
- 9.3.4. Operating business segments
- 9.3.5. Product portfolio
- 9.3.6. Business performance
- 9.3.7. Key strategic moves and developments
- 9.4. MAHA Maschinenbau Haldenwang GmbH & Co. KG
- 9.4.1. Company overview
- 9.4.2. Key executives
- 9.4.3. Company snapshot
- 9.4.4. Operating business segments
- 9.4.5. Product portfolio
- 9.4.6. Business performance
- 9.4.7. Key strategic moves and developments
- 9.5. Hofmann Megaplan GmbH
- 9.5.1. Company overview
- 9.5.2. Key executives
- 9.5.3. Company snapshot
- 9.5.4. Operating business segments
- 9.5.5. Product portfolio
- 9.5.6. Business performance
- 9.5.7. Key strategic moves and developments
- 9.6. VTEQ
- 9.6.1. Company overview
- 9.6.2. Key executives
- 9.6.3. Company snapshot
- 9.6.4. Operating business segments
- 9.6.5. Product portfolio
- 9.6.6. Business performance
- 9.6.7. Key strategic moves and developments
- 9.7. Capelec
- 9.7.1. Company overview
- 9.7.2. Key executives
- 9.7.3. Company snapshot
- 9.7.4. Operating business segments
- 9.7.5. Product portfolio
- 9.7.6. Business performance
- 9.7.7. Key strategic moves and developments
- 9.8. ATS ELGI.
- 9.8.1. Company overview
- 9.8.2. Key executives
- 9.8.3. Company snapshot
- 9.8.4. Operating business segments
- 9.8.5. Product portfolio
- 9.8.6. Business performance
- 9.8.7. Key strategic moves and developments
- 9.9. Butler Vehicle Service Group Italy S.r.l.
- 9.9.1. Company overview
- 9.9.2. Key executives
- 9.9.3. Company snapshot
- 9.9.4. Operating business segments
- 9.9.5. Product portfolio
- 9.9.6. Business performance
- 9.9.7. Key strategic moves and developments
- 9.10. Josam
- 9.10.1. Company overview
- 9.10.2. Key executives
- 9.10.3. Company snapshot
- 9.10.4. Operating business segments
- 9.10.5. Product portfolio
- 9.10.6. Business performance
- 9.10.7. Key strategic moves and developments
LIST OF TABLES
- TABLE 01. GLOBAL TEST LANES MARKET, BY TEST TYPE, 2022-2032 ($MILLION)
- TABLE 02. TEST LANES MARKET FOR EMISSIONS TEST LANES, BY REGION, 2022-2032 ($MILLION)
- TABLE 03. TEST LANES MARKET FOR BRAKE TEST LANES, BY REGION, 2022-2032 ($MILLION)
- TABLE 04. TEST LANES MARKET FOR SUSPENSION TEST LANES, BY REGION, 2022-2032 ($MILLION)
- TABLE 05. TEST LANES MARKET FOR HEADLIGHT ALIGNMENT TEST LANES, BY REGION, 2022-2032 ($MILLION)
- TABLE 06. TEST LANES MARKET FOR ALIGNMENT TEST LANES, BY REGION, 2022-2032 ($MILLION)
- TABLE 07. TEST LANES MARKET FOR OTHERS, BY REGION, 2022-2032 ($MILLION)
- TABLE 08. GLOBAL TEST LANES MARKET, BY TECHNOLOGY, 2022-2032 ($MILLION)
- TABLE 09. TEST LANES MARKET FOR MANUAL TEST LANES, BY REGION, 2022-2032 ($MILLION)
- TABLE 10. TEST LANES MARKET FOR AUTOMATED TEST LANES, BY REGION, 2022-2032 ($MILLION)
- TABLE 11. GLOBAL TEST LANES MARKET, BY VEHICLE TYPE, 2022-2032 ($MILLION)
- TABLE 12. TEST LANES MARKET FOR PASSENGER CARS, BY REGION, 2022-2032 ($MILLION)
- TABLE 13. TEST LANES MARKET FOR COMMERCIAL VEHICLES, BY REGION, 2022-2032 ($MILLION)
- TABLE 14. TEST LANES MARKET FOR MOTORCYCLES, BY REGION, 2022-2032 ($MILLION)
- TABLE 15. TEST LANES MARKET, BY REGION, 2022-2032 ($MILLION)
- TABLE 16. NORTH AMERICA TEST LANES MARKET, BY TEST TYPE, 2022-2032 ($MILLION)
- TABLE 17. NORTH AMERICA TEST LANES MARKET, BY TECHNOLOGY, 2022-2032 ($MILLION)
- TABLE 18. NORTH AMERICA TEST LANES MARKET, BY VEHICLE TYPE, 2022-2032 ($MILLION)
- TABLE 19. NORTH AMERICA TEST LANES MARKET, BY COUNTRY, 2022-2032 ($MILLION)
- TABLE 20. U.S. TEST LANES MARKET, BY TEST TYPE, 2022-2032 ($MILLION)
- TABLE 21. U.S. TEST LANES MARKET, BY TECHNOLOGY, 2022-2032 ($MILLION)
- TABLE 22. U.S. TEST LANES MARKET, BY VEHICLE TYPE, 2022-2032 ($MILLION)
- TABLE 23. CANADA TEST LANES MARKET, BY TEST TYPE, 2022-2032 ($MILLION)
- TABLE 24. CANADA TEST LANES MARKET, BY TECHNOLOGY, 2022-2032 ($MILLION)
- TABLE 25. CANADA TEST LANES MARKET, BY VEHICLE TYPE, 2022-2032 ($MILLION)
- TABLE 26. MEXICO TEST LANES MARKET, BY TEST TYPE, 2022-2032 ($MILLION)
- TABLE 27. MEXICO TEST LANES MARKET, BY TECHNOLOGY, 2022-2032 ($MILLION)
- TABLE 28. MEXICO TEST LANES MARKET, BY VEHICLE TYPE, 2022-2032 ($MILLION)
- TABLE 29. EUROPE TEST LANES MARKET, BY TEST TYPE, 2022-2032 ($MILLION)
- TABLE 30. EUROPE TEST LANES MARKET, BY TECHNOLOGY, 2022-2032 ($MILLION)
- TABLE 31. EUROPE TEST LANES MARKET, BY VEHICLE TYPE, 2022-2032 ($MILLION)
- TABLE 32. EUROPE TEST LANES MARKET, BY COUNTRY, 2022-2032 ($MILLION)
- TABLE 33. GERMANY TEST LANES MARKET, BY TEST TYPE, 2022-2032 ($MILLION)
- TABLE 34. GERMANY TEST LANES MARKET, BY TECHNOLOGY, 2022-2032 ($MILLION)
- TABLE 35. GERMANY TEST LANES MARKET, BY VEHICLE TYPE, 2022-2032 ($MILLION)
- TABLE 36. FRANCE TEST LANES MARKET, BY TEST TYPE, 2022-2032 ($MILLION)
- TABLE 37. FRANCE TEST LANES MARKET, BY TECHNOLOGY, 2022-2032 ($MILLION)
- TABLE 38. FRANCE TEST LANES MARKET, BY VEHICLE TYPE, 2022-2032 ($MILLION)
- TABLE 39. ITALY TEST LANES MARKET, BY TEST TYPE, 2022-2032 ($MILLION)
- TABLE 40. ITALY TEST LANES MARKET, BY TECHNOLOGY, 2022-2032 ($MILLION)
- TABLE 41. ITALY TEST LANES MARKET, BY VEHICLE TYPE, 2022-2032 ($MILLION)
- TABLE 42. UK TEST LANES MARKET, BY TEST TYPE, 2022-2032 ($MILLION)
- TABLE 43. UK TEST LANES MARKET, BY TECHNOLOGY, 2022-2032 ($MILLION)
- TABLE 44. UK TEST LANES MARKET, BY VEHICLE TYPE, 2022-2032 ($MILLION)
- TABLE 45. REST OF EUROPE TEST LANES MARKET, BY TEST TYPE, 2022-2032 ($MILLION)
- TABLE 46. REST OF EUROPE TEST LANES MARKET, BY TECHNOLOGY, 2022-2032 ($MILLION)
- TABLE 47. REST OF EUROPE TEST LANES MARKET, BY VEHICLE TYPE, 2022-2032 ($MILLION)
- TABLE 48. ASIA-PACIFIC TEST LANES MARKET, BY TEST TYPE, 2022-2032 ($MILLION)
- TABLE 49. ASIA-PACIFIC TEST LANES MARKET, BY TECHNOLOGY, 2022-2032 ($MILLION)
- TABLE 50. ASIA-PACIFIC TEST LANES MARKET, BY VEHICLE TYPE, 2022-2032 ($MILLION)
- TABLE 51. ASIA-PACIFIC TEST LANES MARKET, BY COUNTRY, 2022-2032 ($MILLION)
- TABLE 52. CHINA TEST LANES MARKET, BY TEST TYPE, 2022-2032 ($MILLION)
- TABLE 53. CHINA TEST LANES MARKET, BY TECHNOLOGY, 2022-2032 ($MILLION)
- TABLE 54. CHINA TEST LANES MARKET, BY VEHICLE TYPE, 2022-2032 ($MILLION)
- TABLE 55. JAPAN TEST LANES MARKET, BY TEST TYPE, 2022-2032 ($MILLION)
- TABLE 56. JAPAN TEST LANES MARKET, BY TECHNOLOGY, 2022-2032 ($MILLION)
- TABLE 57. JAPAN TEST LANES MARKET, BY VEHICLE TYPE, 2022-2032 ($MILLION)
- TABLE 58. INDIA TEST LANES MARKET, BY TEST TYPE, 2022-2032 ($MILLION)
- TABLE 59. INDIA TEST LANES MARKET, BY TECHNOLOGY, 2022-2032 ($MILLION)
- TABLE 60. INDIA TEST LANES MARKET, BY VEHICLE TYPE, 2022-2032 ($MILLION)
- TABLE 61. SOUTH KOREA TEST LANES MARKET, BY TEST TYPE, 2022-2032 ($MILLION)
- TABLE 62. SOUTH KOREA TEST LANES MARKET, BY TECHNOLOGY, 2022-2032 ($MILLION)
- TABLE 63. SOUTH KOREA TEST LANES MARKET, BY VEHICLE TYPE, 2022-2032 ($MILLION)
- TABLE 64. REST OF ASIA-PACIFIC TEST LANES MARKET, BY TEST TYPE, 2022-2032 ($MILLION)
- TABLE 65. REST OF ASIA-PACIFIC TEST LANES MARKET, BY TECHNOLOGY, 2022-2032 ($MILLION)
- TABLE 66. REST OF ASIA-PACIFIC TEST LANES MARKET, BY VEHICLE TYPE, 2022-2032 ($MILLION)
- TABLE 67. LATIN AMERICA TEST LANES MARKET, BY TEST TYPE, 2022-2032 ($MILLION)
- TABLE 68. LATIN AMERICA TEST LANES MARKET, BY TECHNOLOGY, 2022-2032 ($MILLION)
- TABLE 69. LATIN AMERICA TEST LANES MARKET, BY VEHICLE TYPE, 2022-2032 ($MILLION)
- TABLE 70. LATIN AMERICA TEST LANES MARKET, BY COUNTRY, 2022-2032 ($MILLION)
- TABLE 71. BRAZIL TEST LANES MARKET, BY TEST TYPE, 2022-2032 ($MILLION)
- TABLE 72. BRAZIL TEST LANES MARKET, BY TECHNOLOGY, 2022-2032 ($MILLION)
- TABLE 73. BRAZIL TEST LANES MARKET, BY VEHICLE TYPE, 2022-2032 ($MILLION)
- TABLE 74. CHILE TEST LANES MARKET, BY TEST TYPE, 2022-2032 ($MILLION)
- TABLE 75. CHILE TEST LANES MARKET, BY TECHNOLOGY, 2022-2032 ($MILLION)
- TABLE 76. CHILE TEST LANES MARKET, BY VEHICLE TYPE, 2022-2032 ($MILLION)
- TABLE 77. REST OF LATIN AMERICA TEST LANES MARKET, BY TEST TYPE, 2022-2032 ($MILLION)
- TABLE 78. REST OF LATIN AMERICA TEST LANES MARKET, BY TECHNOLOGY, 2022-2032 ($MILLION)
- TABLE 79. REST OF LATIN AMERICA TEST LANES MARKET, BY VEHICLE TYPE, 2022-2032 ($MILLION)
- TABLE 80. MIDDLE EAST AND AFRICA TEST LANES MARKET, BY TEST TYPE, 2022-2032 ($MILLION)
- TABLE 81. MIDDLE EAST AND AFRICA TEST LANES MARKET, BY TECHNOLOGY, 2022-2032 ($MILLION)
- TABLE 82. MIDDLE EAST AND AFRICA TEST LANES MARKET, BY VEHICLE TYPE, 2022-2032 ($MILLION)
- TABLE 83. MIDDLE EAST AND AFRICA TEST LANES MARKET, BY COUNTRY, 2022-2032 ($MILLION)
- TABLE 84. SAUDI ARABIA TEST LANES MARKET, BY TEST TYPE, 2022-2032 ($MILLION)
- TABLE 85. SAUDI ARABIA TEST LANES MARKET, BY TECHNOLOGY, 2022-2032 ($MILLION)
- TABLE 86. SAUDI ARABIA TEST LANES MARKET, BY VEHICLE TYPE, 2022-2032 ($MILLION)
- TABLE 87. UAE TEST LANES MARKET, BY TEST TYPE, 2022-2032 ($MILLION)
- TABLE 88. UAE TEST LANES MARKET, BY TECHNOLOGY, 2022-2032 ($MILLION)
- TABLE 89. UAE TEST LANES MARKET, BY VEHICLE TYPE, 2022-2032 ($MILLION)
- TABLE 90. NIGERIA TEST LANES MARKET, BY TEST TYPE, 2022-2032 ($MILLION)
- TABLE 91. NIGERIA TEST LANES MARKET, BY TECHNOLOGY, 2022-2032 ($MILLION)
- TABLE 92. NIGERIA TEST LANES MARKET, BY VEHICLE TYPE, 2022-2032 ($MILLION)
- TABLE 93. SOUTH AFRICA TEST LANES MARKET, BY TEST TYPE, 2022-2032 ($MILLION)
- TABLE 94. SOUTH AFRICA TEST LANES MARKET, BY TECHNOLOGY, 2022-2032 ($MILLION)
- TABLE 95. SOUTH AFRICA TEST LANES MARKET, BY VEHICLE TYPE, 2022-2032 ($MILLION)
- TABLE 96. REST OF MIDDLE EAST AND AFRICA TEST LANES MARKET, BY TEST TYPE, 2022-2032 ($MILLION)
- TABLE 97. REST OF MIDDLE EAST AND AFRICA TEST LANES MARKET, BY TECHNOLOGY, 2022-2032 ($MILLION)
- TABLE 98. REST OF MIDDLE EAST AND AFRICA TEST LANES MARKET, BY VEHICLE TYPE, 2022-2032 ($MILLION)
- TABLE 99. BOSTON GARAGE EQUIPMENT.: KEY EXECUTIVES
- TABLE 100. BOSTON GARAGE EQUIPMENT.: COMPANY SNAPSHOT
- TABLE 101. BOSTON GARAGE EQUIPMENT.: PRODUCT SEGMENTS
- TABLE 102. BOSTON GARAGE EQUIPMENT.: SERVICE SEGMENTS
- TABLE 103. BOSTON GARAGE EQUIPMENT.: PRODUCT PORTFOLIO
- TABLE 104. BOSTON GARAGE EQUIPMENT.: KEY STRATEGIES
- TABLE 105. CONTINENTAL CORPORATION.: KEY EXECUTIVES
- TABLE 106. CONTINENTAL CORPORATION.: COMPANY SNAPSHOT
- TABLE 107. CONTINENTAL CORPORATION.: PRODUCT SEGMENTS
- TABLE 108. CONTINENTAL CORPORATION.: SERVICE SEGMENTS
- TABLE 109. CONTINENTAL CORPORATION.: PRODUCT PORTFOLIO
- TABLE 110. CONTINENTAL CORPORATION.: KEY STRATEGIES
- TABLE 111. CORMACH S.R.L.: KEY EXECUTIVES
- TABLE 112. CORMACH S.R.L.: COMPANY SNAPSHOT
- TABLE 113. CORMACH S.R.L.: PRODUCT SEGMENTS
- TABLE 114. CORMACH S.R.L.: SERVICE SEGMENTS
- TABLE 115. CORMACH S.R.L.: PRODUCT PORTFOLIO
- TABLE 116. CORMACH S.R.L.: KEY STRATEGIES
- TABLE 117. MAHA MASCHINENBAU HALDENWANG GMBH & CO. KG: KEY EXECUTIVES
- TABLE 118. MAHA MASCHINENBAU HALDENWANG GMBH & CO. KG: COMPANY SNAPSHOT
- TABLE 119. MAHA MASCHINENBAU HALDENWANG GMBH & CO. KG: PRODUCT SEGMENTS
- TABLE 120. MAHA MASCHINENBAU HALDENWANG GMBH & CO. KG: SERVICE SEGMENTS
- TABLE 121. MAHA MASCHINENBAU HALDENWANG GMBH & CO. KG: PRODUCT PORTFOLIO
- TABLE 122. MAHA MASCHINENBAU HALDENWANG GMBH & CO. KG: KEY STRATEGIES
- TABLE 123. HOFMANN MEGAPLAN GMBH: KEY EXECUTIVES
- TABLE 124. HOFMANN MEGAPLAN GMBH: COMPANY SNAPSHOT
- TABLE 125. HOFMANN MEGAPLAN GMBH: PRODUCT SEGMENTS
- TABLE 126. HOFMANN MEGAPLAN GMBH: SERVICE SEGMENTS
- TABLE 127. HOFMANN MEGAPLAN GMBH: PRODUCT PORTFOLIO
- TABLE 128. HOFMANN MEGAPLAN GMBH: KEY STRATEGIES
- TABLE 129. VEHICLE TESTING EQUIPMENT S.L.: KEY EXECUTIVES
- TABLE 130. VEHICLE TESTING EQUIPMENT S.L.: COMPANY SNAPSHOT
- TABLE 131. VEHICLE TESTING EQUIPMENT S.L.: PRODUCT SEGMENTS
- TABLE 132. VEHICLE TESTING EQUIPMENT S.L.: SERVICE SEGMENTS
- TABLE 133. VEHICLE TESTING EQUIPMENT S.L.: PRODUCT PORTFOLIO
- TABLE 134. VEHICLE TESTING EQUIPMENT S.L.: KEY STRATEGIES
- TABLE 135. CAPELEC: KEY EXECUTIVES
- TABLE 136. CAPELEC: COMPANY SNAPSHOT
- TABLE 137. CAPELEC: PRODUCT SEGMENTS
- TABLE 138. CAPELEC: SERVICE SEGMENTS
- TABLE 139. CAPELEC: PRODUCT PORTFOLIO
- TABLE 140. CAPELEC: KEY STRATEGIES
- TABLE 141. ATS ELGI.: KEY EXECUTIVES
- TABLE 142. ATS ELGI.: COMPANY SNAPSHOT
- TABLE 143. ATS ELGI.: PRODUCT SEGMENTS
- TABLE 144. ATS ELGI.: SERVICE SEGMENTS
- TABLE 145. ATS ELGI.: PRODUCT PORTFOLIO
- TABLE 146. ATS ELGI.: KEY STRATEGIES
- TABLE 147. VEHICLE SERVICE GROUP ITALY S.R.L.: KEY EXECUTIVES
- TABLE 148. VEHICLE SERVICE GROUP ITALY S.R.L.: COMPANY SNAPSHOT
- TABLE 149. VEHICLE SERVICE GROUP ITALY S.R.L.: PRODUCT SEGMENTS
- TABLE 150. VEHICLE SERVICE GROUP ITALY S.R.L.: SERVICE SEGMENTS
- TABLE 151. VEHICLE SERVICE GROUP ITALY S.R.L.: PRODUCT PORTFOLIO
- TABLE 152. VEHICLE SERVICE GROUP ITALY S.R.L.: KEY STRATEGIES
LIST OF FIGURES
- FIGURE 01. TEST LANES MARKET, 2022-2032
- FIGURE 02. SEGMENTATION OF TEST LANES MARKET,2022-2032
- FIGURE 03. TOP IMPACTING FACTORS IN TEST LANES MARKET
- FIGURE 04. TOP INVESTMENT POCKETS IN TEST LANES MARKET (2023-2032)
- FIGURE 05. BARGAINING POWER OF SUPPLIERS
- FIGURE 06. BARGAINING POWER OF BUYERS
- FIGURE 07. THREAT OF SUBSTITUTION
- FIGURE 08. THREAT OF SUBSTITUTION
- FIGURE 09. COMPETITIVE RIVALRY
- FIGURE 10. GLOBAL TEST LANES MARKET:DRIVERS, RESTRAINTS AND OPPORTUNITIES
- FIGURE 11. TEST LANES MARKET, BY TEST TYPE, 2022 AND 2032(%)
- FIGURE 12. COMPARATIVE SHARE ANALYSIS OF TEST LANES MARKET FOR EMISSIONS TEST LANES, BY COUNTRY 2022 AND 2032(%)
- FIGURE 13. COMPARATIVE SHARE ANALYSIS OF TEST LANES MARKET FOR BRAKE TEST LANES, BY COUNTRY 2022 AND 2032(%)
- FIGURE 14. COMPARATIVE SHARE ANALYSIS OF TEST LANES MARKET FOR SUSPENSION TEST LANES, BY COUNTRY 2022 AND 2032(%)
- FIGURE 15. COMPARATIVE SHARE ANALYSIS OF TEST LANES MARKET FOR HEADLIGHT ALIGNMENT TEST LANES, BY COUNTRY 2022 AND 2032(%)
- FIGURE 16. COMPARATIVE SHARE ANALYSIS OF TEST LANES MARKET FOR ALIGNMENT TEST LANES, BY COUNTRY 2022 AND 2032(%)
- FIGURE 17. COMPARATIVE SHARE ANALYSIS OF TEST LANES MARKET FOR OTHERS, BY COUNTRY 2022 AND 2032(%)
- FIGURE 18. TEST LANES MARKET, BY TECHNOLOGY, 2022 AND 2032(%)
- FIGURE 19. COMPARATIVE SHARE ANALYSIS OF TEST LANES MARKET FOR MANUAL TEST LANES, BY COUNTRY 2022 AND 2032(%)
- FIGURE 20. COMPARATIVE SHARE ANALYSIS OF TEST LANES MARKET FOR AUTOMATED TEST LANES, BY COUNTRY 2022 AND 2032(%)
- FIGURE 21. TEST LANES MARKET, BY VEHICLE TYPE, 2022 AND 2032(%)
- FIGURE 22. COMPARATIVE SHARE ANALYSIS OF TEST LANES MARKET FOR PASSENGER CARS, BY COUNTRY 2022 AND 2032(%)
- FIGURE 23. COMPARATIVE SHARE ANALYSIS OF TEST LANES MARKET FOR COMMERCIAL VEHICLES, BY COUNTRY 2022 AND 2032(%)
- FIGURE 24. COMPARATIVE SHARE ANALYSIS OF TEST LANES MARKET FOR MOTORCYCLES, BY COUNTRY 2022 AND 2032(%)
- FIGURE 25. TEST LANES MARKET BY REGION, 2022 AND 2032(%)
- FIGURE 26. U.S. TEST LANES MARKET, 2022-2032 ($MILLION)
- FIGURE 27. CANADA TEST LANES MARKET, 2022-2032 ($MILLION)
- FIGURE 28. MEXICO TEST LANES MARKET, 2022-2032 ($MILLION)
- FIGURE 29. GERMANY TEST LANES MARKET, 2022-2032 ($MILLION)
- FIGURE 30. FRANCE TEST LANES MARKET, 2022-2032 ($MILLION)
- FIGURE 31. ITALY TEST LANES MARKET, 2022-2032 ($MILLION)
- FIGURE 32. UK TEST LANES MARKET, 2022-2032 ($MILLION)
- FIGURE 33. REST OF EUROPE TEST LANES MARKET, 2022-2032 ($MILLION)
- FIGURE 34. CHINA TEST LANES MARKET, 2022-2032 ($MILLION)
- FIGURE 35. JAPAN TEST LANES MARKET, 2022-2032 ($MILLION)
- FIGURE 36. INDIA TEST LANES MARKET, 2022-2032 ($MILLION)
- FIGURE 37. SOUTH KOREA TEST LANES MARKET, 2022-2032 ($MILLION)
- FIGURE 38. REST OF ASIA-PACIFIC TEST LANES MARKET, 2022-2032 ($MILLION)
- FIGURE 39. BRAZIL TEST LANES MARKET, 2022-2032 ($MILLION)
- FIGURE 40. CHILE TEST LANES MARKET, 2022-2032 ($MILLION)
- FIGURE 41. REST OF LATIN AMERICA TEST LANES MARKET, 2022-2032 ($MILLION)
- FIGURE 42. SAUDI ARABIA TEST LANES MARKET, 2022-2032 ($MILLION)
- FIGURE 43. UAE TEST LANES MARKET, 2022-2032 ($MILLION)
- FIGURE 44. NIGERIA TEST LANES MARKET, 2022-2032 ($MILLION)
- FIGURE 45. SOUTH AFRICA TEST LANES MARKET, 2022-2032 ($MILLION)
- FIGURE 46. REST OF MIDDLE EAST AND AFRICA TEST LANES MARKET, 2022-2032 ($MILLION)
- FIGURE 47. TOP WINNING STRATEGIES, BY YEAR
- FIGURE 48. TOP WINNING STRATEGIES, BY DEVELOPMENT
- FIGURE 49. TOP WINNING STRATEGIES, BY COMPANY
- FIGURE 50. PRODUCT MAPPING OF TOP 10 PLAYERS
- FIGURE 51. COMPETITIVE DASHBOARD
- FIGURE 52. COMPETITIVE HEATMAP: TEST LANES MARKET
- FIGURE 53. TOP PLAYER POSITIONING, 2022

