
Need help finding what you are looking for?
Contact Us
PUBLISHER: Allied Market Research | PRODUCT CODE: 1513370

PUBLISHER: Allied Market Research | PRODUCT CODE: 1513370
Animal Milk Replacer Market By Type, By Animal Type, By Form, By Distribution Channel : Global Opportunity Analysis and Industry Forecast, 2024-2035
PUBLISHED:
PAGES: 289 Pages
DELIVERY TIME: 2-3 business days
SELECT AN OPTION
The global animal milk replacer market was valued at $4.6 billion in 2023, and is projected to reach $8.5 billion by 2035, registering a CAGR of 5.3% from 2024 to 2035. 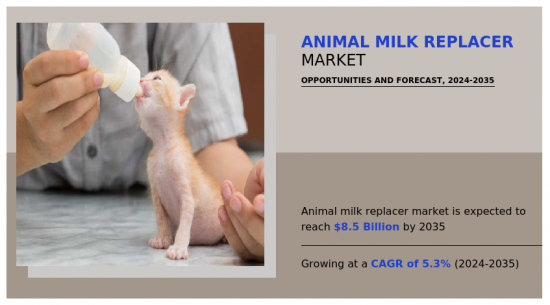 Animal milk replacer refers to specialized products formulated to substitute or supplement natural milk in the diets of young or sick animals. These replacers are designed to mimic the nutritional composition of mother's milk, providing essential nutrients such as proteins, fats, vitamins, and minerals crucial for the growth and development of the animal. They are commonly used in situations where natural milk is unavailable, inadequate, or unsuitable for the intended animal recipient. Animal milk replacers are meticulously formulated to meet the specific nutritional requirements of different species and age groups, ensuring optimal health, growth, and vitality in the absence of natural lactation. The adoption of precision nutrition techniques in livestock farming has significantly surged the demand for the animal milk replacer market. Precision nutrition involves the precise measurement and adjustment of nutrient intake for each individual animal based on factors such as age, weight, health status, and performance goals. Precision nutrient approach enables farmers to optimize the health, growth, and productivity of their animals while minimizing waste and environmental impact. Animal milk replacers play a crucial role in precision nutrition strategies by providing a controlled and consistent source of essential nutrients tailored to the specific needs of each animal. Furthermore, precision nutrition allows farmers to customize feeding regimes to address dietary deficiencies, health issues, or specific production goals more effectively. As a result, there is a growing preference among livestock farmers to incorporate milk replacers into their feeding programs to ensure optimal nutrition for their animals, especially during critical stages such as early growth or recovery from illness. Thus, the increased adoption of precision nutrition techniques is expected to drive the demand for animal milk replacers. However, limited consumer awareness and acceptance significantly restrain market demand for animal milk replacer products. Many consumers, especially in regions with strong traditional dairy farming practices, may lack awareness of the benefits and effectiveness of milk replacers. Moreover, rooted cultural preferences for natural milk and perceptions of its superiority over substitutes hinder acceptance. Without adequate education and promotion, potential consumers may remain skeptical or unaware of the value proposition offered by milk replacers, leading to lower demand and slower market growth. Technological advancements in milk replacers have created growth opportunities in the animal milk replacer market by enhancing product efficacy, nutritional value, and palatability. Advanced processing techniques, such as spray drying and microencapsulation, enable the production of milk replacers with improved stability, solubility, and shelf life, thereby extending their availability and facilitating easier storage and transportation. Furthermore, advancements in formulation technologies allow for the customization of milk replacers to meet the specific nutritional needs of different animal species and age groups, addressing diverse dietary requirements more effectively. In addition, advancements in quality control and assurance methodologies ensure the safety and purity of milk replacer products, encouraging confidence in consumers and facilitating market penetration. Some of the key players operating in the animal milk replacer market include Alltech, Beaphar, Cargill, Inc., FrieslandCampina N.V., Koninklijke DSM N.V., Liprovit B.V., Manna Pro Products, LLC, and Nutreco. Several well-known and up-and-coming brands are vying for market dominance in the expanding animal milk replacer industry. Smaller, niche firms have become more well-known for catering to particular consumer demands and tastes. Large conglomerates, however, still control the majority of the market and frequently buy creative start-ups to broaden their product lines.
Key Benefits For Stakeholders
- This report provides a quantitative analysis of the market segments, current trends, estimations, and dynamics of the animal milk replacer market analysis from 2023 to 2035 to identify the prevailing animal milk replacer market opportunities.
- The market research is offered along with information related to key drivers, restraints, and opportunities.
- Porter's five forces analysis highlights the potency of buyers and suppliers to enable stakeholders make profit-oriented business decisions and strengthen their supplier-buyer network.
- In-depth analysis of the animal milk replacer market segmentation assists to determine the prevailing market opportunities.
- Major countries in each region are mapped according to their revenue contribution to the global market.
- Market player positioning facilitates benchmarking and provides a clear understanding of the present position of the market players.
- The report includes the analysis of the regional as well as global animal milk replacer market trends, key players, market segments, application areas, and market growth strategies.
Additional benefits you will get with this purchase are:
- Quarterly Update and* (only available with a corporate license, on listed price)
- 5 additional Company Profile of client Choice pre- or Post-purchase, as a free update.
- Free Upcoming Version on the Purchase of Five and Enterprise User License.
- 16 analyst hours of support* (post-purchase, if you find additional data requirements upon review of the report, you may receive support amounting to 16 analyst hours to solve questions, and post-sale queries)
- 15% Free Customization* (in case the scope or segment of the report does not match your requirements, 15% is equivalent to 3 working days of free work, applicable once)
- Free data Pack on the Five and Enterprise User License. (Excel version of the report)
- Free Updated report if the report is 6-12 months old or older.
- 24-hour priority response*
- Free Industry updates and white papers.Possible Customization with this report (with additional cost and timeline, please talk to the sales executive to know more
- Analysis of raw material in a product (by %)
- End user preferences and pain points
- Industry life cycle assessment, by region
- Product Life Cycle
- Consumer Preference and Product Specifications
- Market share analysis of players by products/segments
- Regulatory Guidelines
- Additional company profiles with specific to client's interest
- Additional country or region analysis- market size and forecast
- Brands Share Analysis
- Expanded list for Company Profiles
- Key player details (including location, contact details, supplier/vendor network etc. in excel format)
- List of customers/consumers/raw material suppliers- value chain analysis
- Market share analysis of players at global/region/country level
- SWOT Analysis
Key Market Segments
By Type
- Dairy Based
- Plant Based
- Animal Based
- Pre-mixed
- Others
By Animal Type
- Small Animal
- Calf
- Pig
- Kitten
- Puppies
- Foal
- Others
By Form
- Liquid
- Solid
By Distribution Channel
- Supermarkets and Hypermarkets
- Specialty Stores
- Convenience Stores
- E-commerce
- Others
By Region
- North America
- U.S.
- Canada
- Mexico
- Europe
- UK
- France
- Italy
- Spain
- Germany
- Russia
- Rest of Europe
- Asia-Pacific
- China
- Japan
- India
- South Korea
- Australia
- Thailand
- Malaysia
- Indonesia
- Rest of Asia-Pacific
- Latin America
- Brazil
- Argentina
- Colombia
- Rest of Latin America
- Middle East and Africa
- Gcc
- South Africa
- Rest of Middle East And Africa
Key Market Players:
- Alltech
- Beaphar
- Cargill, Incorporated
- Royal FrieslandCampina N.V.
- Koninklijke DSM N.V.
- Liprovit B.V.
- MANNA PRO PRODUCTS, LLC
- Nutreco
- Glanbia PLC
- Hubbard Feeds Inc.
Product Code: A16835
TABLE OF CONTENTS
CHAPTER 1: INTRODUCTION
- 1.1. Report description
- 1.2. Key market segments
- 1.3. Key benefits to the stakeholders
- 1.4. Research methodology
- 1.4.1. Primary research
- 1.4.2. Secondary research
- 1.4.3. Analyst tools and models
CHAPTER 2: EXECUTIVE SUMMARY
- 2.1. CXO perspective
CHAPTER 3: MARKET OVERVIEW
- 3.1. Market definition and scope
- 3.2. Key findings
- 3.2.1. Top impacting factors
- 3.2.2. Top investment pockets
- 3.3. Porter's five forces analysis
- 3.4. Market dynamics
- 3.4.1. Drivers
- 3.4.2. Restraints
- 3.4.3. Opportunities
CHAPTER 4: ANIMAL MILK REPLACER MARKET, BY TYPE
- 4.1. Overview
- 4.1.1. Market size and forecast
- 4.2. Dairy Based
- 4.2.1. Key market trends, growth factors and opportunities
- 4.2.2. Market size and forecast, by region
- 4.2.3. Market share analysis by country
- 4.3. Plant Based
- 4.3.1. Key market trends, growth factors and opportunities
- 4.3.2. Market size and forecast, by region
- 4.3.3. Market share analysis by country
- 4.4. Animal Based
- 4.4.1. Key market trends, growth factors and opportunities
- 4.4.2. Market size and forecast, by region
- 4.4.3. Market share analysis by country
- 4.5. Pre-mixed
- 4.5.1. Key market trends, growth factors and opportunities
- 4.5.2. Market size and forecast, by region
- 4.5.3. Market share analysis by country
- 4.6. Others
- 4.6.1. Key market trends, growth factors and opportunities
- 4.6.2. Market size and forecast, by region
- 4.6.3. Market share analysis by country
CHAPTER 5: ANIMAL MILK REPLACER MARKET, BY ANIMAL TYPE
- 5.1. Overview
- 5.1.1. Market size and forecast
- 5.2. Small Animal
- 5.2.1. Key market trends, growth factors and opportunities
- 5.2.2. Market size and forecast, by region
- 5.2.3. Market share analysis by country
- 5.3. Calf
- 5.3.1. Key market trends, growth factors and opportunities
- 5.3.2. Market size and forecast, by region
- 5.3.3. Market share analysis by country
- 5.4. Pig
- 5.4.1. Key market trends, growth factors and opportunities
- 5.4.2. Market size and forecast, by region
- 5.4.3. Market share analysis by country
- 5.5. Kitten
- 5.5.1. Key market trends, growth factors and opportunities
- 5.5.2. Market size and forecast, by region
- 5.5.3. Market share analysis by country
- 5.6. Puppies
- 5.6.1. Key market trends, growth factors and opportunities
- 5.6.2. Market size and forecast, by region
- 5.6.3. Market share analysis by country
- 5.7. Foal
- 5.7.1. Key market trends, growth factors and opportunities
- 5.7.2. Market size and forecast, by region
- 5.7.3. Market share analysis by country
- 5.8. Others
- 5.8.1. Key market trends, growth factors and opportunities
- 5.8.2. Market size and forecast, by region
- 5.8.3. Market share analysis by country
CHAPTER 6: ANIMAL MILK REPLACER MARKET, BY FORM
- 6.1. Overview
- 6.1.1. Market size and forecast
- 6.2. Liquid
- 6.2.1. Key market trends, growth factors and opportunities
- 6.2.2. Market size and forecast, by region
- 6.2.3. Market share analysis by country
- 6.3. Solid
- 6.3.1. Key market trends, growth factors and opportunities
- 6.3.2. Market size and forecast, by region
- 6.3.3. Market share analysis by country
CHAPTER 7: ANIMAL MILK REPLACER MARKET, BY DISTRIBUTION CHANNEL
- 7.1. Overview
- 7.1.1. Market size and forecast
- 7.2. Supermarkets and Hypermarkets
- 7.2.1. Key market trends, growth factors and opportunities
- 7.2.2. Market size and forecast, by region
- 7.2.3. Market share analysis by country
- 7.3. Specialty Stores
- 7.3.1. Key market trends, growth factors and opportunities
- 7.3.2. Market size and forecast, by region
- 7.3.3. Market share analysis by country
- 7.4. Convenience Stores
- 7.4.1. Key market trends, growth factors and opportunities
- 7.4.2. Market size and forecast, by region
- 7.4.3. Market share analysis by country
- 7.5. E-commerce
- 7.5.1. Key market trends, growth factors and opportunities
- 7.5.2. Market size and forecast, by region
- 7.5.3. Market share analysis by country
- 7.6. Others
- 7.6.1. Key market trends, growth factors and opportunities
- 7.6.2. Market size and forecast, by region
- 7.6.3. Market share analysis by country
CHAPTER 8: ANIMAL MILK REPLACER MARKET, BY REGION
- 8.1. Overview
- 8.1.1. Market size and forecast By Region
- 8.2. North America
- 8.2.1. Key market trends, growth factors and opportunities
- 8.2.2. Market size and forecast, by Type
- 8.2.3. Market size and forecast, by Animal Type
- 8.2.4. Market size and forecast, by Form
- 8.2.5. Market size and forecast, by Distribution Channel
- 8.2.6. Market size and forecast, by country
- 8.2.6.1. U.S.
- 8.2.6.1.1. Market size and forecast, by Type
- 8.2.6.1.2. Market size and forecast, by Animal Type
- 8.2.6.1.3. Market size and forecast, by Form
- 8.2.6.1.4. Market size and forecast, by Distribution Channel
- 8.2.6.2. Canada
- 8.2.6.2.1. Market size and forecast, by Type
- 8.2.6.2.2. Market size and forecast, by Animal Type
- 8.2.6.2.3. Market size and forecast, by Form
- 8.2.6.2.4. Market size and forecast, by Distribution Channel
- 8.2.6.3. Mexico
- 8.2.6.3.1. Market size and forecast, by Type
- 8.2.6.3.2. Market size and forecast, by Animal Type
- 8.2.6.3.3. Market size and forecast, by Form
- 8.2.6.3.4. Market size and forecast, by Distribution Channel
- 8.3. Europe
- 8.3.1. Key market trends, growth factors and opportunities
- 8.3.2. Market size and forecast, by Type
- 8.3.3. Market size and forecast, by Animal Type
- 8.3.4. Market size and forecast, by Form
- 8.3.5. Market size and forecast, by Distribution Channel
- 8.3.6. Market size and forecast, by country
- 8.3.6.1. UK
- 8.3.6.1.1. Market size and forecast, by Type
- 8.3.6.1.2. Market size and forecast, by Animal Type
- 8.3.6.1.3. Market size and forecast, by Form
- 8.3.6.1.4. Market size and forecast, by Distribution Channel
- 8.3.6.2. France
- 8.3.6.2.1. Market size and forecast, by Type
- 8.3.6.2.2. Market size and forecast, by Animal Type
- 8.3.6.2.3. Market size and forecast, by Form
- 8.3.6.2.4. Market size and forecast, by Distribution Channel
- 8.3.6.3. Italy
- 8.3.6.3.1. Market size and forecast, by Type
- 8.3.6.3.2. Market size and forecast, by Animal Type
- 8.3.6.3.3. Market size and forecast, by Form
- 8.3.6.3.4. Market size and forecast, by Distribution Channel
- 8.3.6.4. Spain
- 8.3.6.4.1. Market size and forecast, by Type
- 8.3.6.4.2. Market size and forecast, by Animal Type
- 8.3.6.4.3. Market size and forecast, by Form
- 8.3.6.4.4. Market size and forecast, by Distribution Channel
- 8.3.6.5. Germany
- 8.3.6.5.1. Market size and forecast, by Type
- 8.3.6.5.2. Market size and forecast, by Animal Type
- 8.3.6.5.3. Market size and forecast, by Form
- 8.3.6.5.4. Market size and forecast, by Distribution Channel
- 8.3.6.6. Russia
- 8.3.6.6.1. Market size and forecast, by Type
- 8.3.6.6.2. Market size and forecast, by Animal Type
- 8.3.6.6.3. Market size and forecast, by Form
- 8.3.6.6.4. Market size and forecast, by Distribution Channel
- 8.3.6.7. Rest of Europe
- 8.3.6.7.1. Market size and forecast, by Type
- 8.3.6.7.2. Market size and forecast, by Animal Type
- 8.3.6.7.3. Market size and forecast, by Form
- 8.3.6.7.4. Market size and forecast, by Distribution Channel
- 8.4. Asia-Pacific
- 8.4.1. Key market trends, growth factors and opportunities
- 8.4.2. Market size and forecast, by Type
- 8.4.3. Market size and forecast, by Animal Type
- 8.4.4. Market size and forecast, by Form
- 8.4.5. Market size and forecast, by Distribution Channel
- 8.4.6. Market size and forecast, by country
- 8.4.6.1. China
- 8.4.6.1.1. Market size and forecast, by Type
- 8.4.6.1.2. Market size and forecast, by Animal Type
- 8.4.6.1.3. Market size and forecast, by Form
- 8.4.6.1.4. Market size and forecast, by Distribution Channel
- 8.4.6.2. Japan
- 8.4.6.2.1. Market size and forecast, by Type
- 8.4.6.2.2. Market size and forecast, by Animal Type
- 8.4.6.2.3. Market size and forecast, by Form
- 8.4.6.2.4. Market size and forecast, by Distribution Channel
- 8.4.6.3. India
- 8.4.6.3.1. Market size and forecast, by Type
- 8.4.6.3.2. Market size and forecast, by Animal Type
- 8.4.6.3.3. Market size and forecast, by Form
- 8.4.6.3.4. Market size and forecast, by Distribution Channel
- 8.4.6.4. South Korea
- 8.4.6.4.1. Market size and forecast, by Type
- 8.4.6.4.2. Market size and forecast, by Animal Type
- 8.4.6.4.3. Market size and forecast, by Form
- 8.4.6.4.4. Market size and forecast, by Distribution Channel
- 8.4.6.5. Australia
- 8.4.6.5.1. Market size and forecast, by Type
- 8.4.6.5.2. Market size and forecast, by Animal Type
- 8.4.6.5.3. Market size and forecast, by Form
- 8.4.6.5.4. Market size and forecast, by Distribution Channel
- 8.4.6.6. Thailand
- 8.4.6.6.1. Market size and forecast, by Type
- 8.4.6.6.2. Market size and forecast, by Animal Type
- 8.4.6.6.3. Market size and forecast, by Form
- 8.4.6.6.4. Market size and forecast, by Distribution Channel
- 8.4.6.7. Malaysia
- 8.4.6.7.1. Market size and forecast, by Type
- 8.4.6.7.2. Market size and forecast, by Animal Type
- 8.4.6.7.3. Market size and forecast, by Form
- 8.4.6.7.4. Market size and forecast, by Distribution Channel
- 8.4.6.8. Indonesia
- 8.4.6.8.1. Market size and forecast, by Type
- 8.4.6.8.2. Market size and forecast, by Animal Type
- 8.4.6.8.3. Market size and forecast, by Form
- 8.4.6.8.4. Market size and forecast, by Distribution Channel
- 8.4.6.9. Rest of Asia-Pacific
- 8.4.6.9.1. Market size and forecast, by Type
- 8.4.6.9.2. Market size and forecast, by Animal Type
- 8.4.6.9.3. Market size and forecast, by Form
- 8.4.6.9.4. Market size and forecast, by Distribution Channel
- 8.5. Latin America
- 8.5.1. Key market trends, growth factors and opportunities
- 8.5.2. Market size and forecast, by Type
- 8.5.3. Market size and forecast, by Animal Type
- 8.5.4. Market size and forecast, by Form
- 8.5.5. Market size and forecast, by Distribution Channel
- 8.5.6. Market size and forecast, by country
- 8.5.6.1. Brazil
- 8.5.6.1.1. Market size and forecast, by Type
- 8.5.6.1.2. Market size and forecast, by Animal Type
- 8.5.6.1.3. Market size and forecast, by Form
- 8.5.6.1.4. Market size and forecast, by Distribution Channel
- 8.5.6.2. Argentina
- 8.5.6.2.1. Market size and forecast, by Type
- 8.5.6.2.2. Market size and forecast, by Animal Type
- 8.5.6.2.3. Market size and forecast, by Form
- 8.5.6.2.4. Market size and forecast, by Distribution Channel
- 8.5.6.3. Colombia
- 8.5.6.3.1. Market size and forecast, by Type
- 8.5.6.3.2. Market size and forecast, by Animal Type
- 8.5.6.3.3. Market size and forecast, by Form
- 8.5.6.3.4. Market size and forecast, by Distribution Channel
- 8.5.6.4. Rest of Latin America
- 8.5.6.4.1. Market size and forecast, by Type
- 8.5.6.4.2. Market size and forecast, by Animal Type
- 8.5.6.4.3. Market size and forecast, by Form
- 8.5.6.4.4. Market size and forecast, by Distribution Channel
- 8.6. Middle East and Africa
- 8.6.1. Key market trends, growth factors and opportunities
- 8.6.2. Market size and forecast, by Type
- 8.6.3. Market size and forecast, by Animal Type
- 8.6.4. Market size and forecast, by Form
- 8.6.5. Market size and forecast, by Distribution Channel
- 8.6.6. Market size and forecast, by country
- 8.6.6.1. Gcc
- 8.6.6.1.1. Market size and forecast, by Type
- 8.6.6.1.2. Market size and forecast, by Animal Type
- 8.6.6.1.3. Market size and forecast, by Form
- 8.6.6.1.4. Market size and forecast, by Distribution Channel
- 8.6.6.2. South Africa
- 8.6.6.2.1. Market size and forecast, by Type
- 8.6.6.2.2. Market size and forecast, by Animal Type
- 8.6.6.2.3. Market size and forecast, by Form
- 8.6.6.2.4. Market size and forecast, by Distribution Channel
- 8.6.6.3. Rest of Middle East And Africa
- 8.6.6.3.1. Market size and forecast, by Type
- 8.6.6.3.2. Market size and forecast, by Animal Type
- 8.6.6.3.3. Market size and forecast, by Form
- 8.6.6.3.4. Market size and forecast, by Distribution Channel
CHAPTER 9: COMPETITIVE LANDSCAPE
- 9.1. Introduction
- 9.2. Top winning strategies
- 9.3. Product mapping of top 10 player
- 9.4. Competitive dashboard
- 9.5. Competitive heatmap
- 9.6. Top player positioning, 2023
CHAPTER 10: COMPANY PROFILES
- 10.1. Alltech
- 10.1.1. Company overview
- 10.1.2. Key executives
- 10.1.3. Company snapshot
- 10.1.4. Operating business segments
- 10.1.5. Product portfolio
- 10.1.6. Business performance
- 10.1.7. Key strategic moves and developments
- 10.2. Beaphar
- 10.2.1. Company overview
- 10.2.2. Key executives
- 10.2.3. Company snapshot
- 10.2.4. Operating business segments
- 10.2.5. Product portfolio
- 10.2.6. Business performance
- 10.2.7. Key strategic moves and developments
- 10.3. Cargill, Incorporated
- 10.3.1. Company overview
- 10.3.2. Key executives
- 10.3.3. Company snapshot
- 10.3.4. Operating business segments
- 10.3.5. Product portfolio
- 10.3.6. Business performance
- 10.3.7. Key strategic moves and developments
- 10.4. Royal FrieslandCampina N.V.
- 10.4.1. Company overview
- 10.4.2. Key executives
- 10.4.3. Company snapshot
- 10.4.4. Operating business segments
- 10.4.5. Product portfolio
- 10.4.6. Business performance
- 10.4.7. Key strategic moves and developments
- 10.5. Koninklijke DSM N.V.
- 10.5.1. Company overview
- 10.5.2. Key executives
- 10.5.3. Company snapshot
- 10.5.4. Operating business segments
- 10.5.5. Product portfolio
- 10.5.6. Business performance
- 10.5.7. Key strategic moves and developments
- 10.6. Liprovit B.V.
- 10.6.1. Company overview
- 10.6.2. Key executives
- 10.6.3. Company snapshot
- 10.6.4. Operating business segments
- 10.6.5. Product portfolio
- 10.6.6. Business performance
- 10.6.7. Key strategic moves and developments
- 10.7. MANNA PRO PRODUCTS, LLC
- 10.7.1. Company overview
- 10.7.2. Key executives
- 10.7.3. Company snapshot
- 10.7.4. Operating business segments
- 10.7.5. Product portfolio
- 10.7.6. Business performance
- 10.7.7. Key strategic moves and developments
- 10.8. Nutreco
- 10.8.1. Company overview
- 10.8.2. Key executives
- 10.8.3. Company snapshot
- 10.8.4. Operating business segments
- 10.8.5. Product portfolio
- 10.8.6. Business performance
- 10.8.7. Key strategic moves and developments
- 10.9. Glanbia PLC
- 10.9.1. Company overview
- 10.9.2. Key executives
- 10.9.3. Company snapshot
- 10.9.4. Operating business segments
- 10.9.5. Product portfolio
- 10.9.6. Business performance
- 10.9.7. Key strategic moves and developments
- 10.10. Hubbard Feeds Inc.
- 10.10.1. Company overview
- 10.10.2. Key executives
- 10.10.3. Company snapshot
- 10.10.4. Operating business segments
- 10.10.5. Product portfolio
- 10.10.6. Business performance
- 10.10.7. Key strategic moves and developments
Product Code: A16835
LIST OF TABLES
- TABLE 01. GLOBAL ANIMAL MILK REPLACER MARKET, BY TYPE, 2023-2035 ($MILLION)
- TABLE 02. ANIMAL MILK REPLACER MARKET FOR DAIRY BASED, BY REGION, 2023-2035 ($MILLION)
- TABLE 03. ANIMAL MILK REPLACER MARKET FOR PLANT BASED, BY REGION, 2023-2035 ($MILLION)
- TABLE 04. ANIMAL MILK REPLACER MARKET FOR ANIMAL BASED, BY REGION, 2023-2035 ($MILLION)
- TABLE 05. ANIMAL MILK REPLACER MARKET FOR PRE-MIXED, BY REGION, 2023-2035 ($MILLION)
- TABLE 06. ANIMAL MILK REPLACER MARKET FOR OTHERS, BY REGION, 2023-2035 ($MILLION)
- TABLE 07. GLOBAL ANIMAL MILK REPLACER MARKET, BY ANIMAL TYPE, 2023-2035 ($MILLION)
- TABLE 08. ANIMAL MILK REPLACER MARKET FOR SMALL ANIMAL, BY REGION, 2023-2035 ($MILLION)
- TABLE 09. ANIMAL MILK REPLACER MARKET FOR CALF, BY REGION, 2023-2035 ($MILLION)
- TABLE 10. ANIMAL MILK REPLACER MARKET FOR PIG, BY REGION, 2023-2035 ($MILLION)
- TABLE 11. ANIMAL MILK REPLACER MARKET FOR KITTEN, BY REGION, 2023-2035 ($MILLION)
- TABLE 12. ANIMAL MILK REPLACER MARKET FOR PUPPIES, BY REGION, 2023-2035 ($MILLION)
- TABLE 13. ANIMAL MILK REPLACER MARKET FOR FOAL, BY REGION, 2023-2035 ($MILLION)
- TABLE 14. ANIMAL MILK REPLACER MARKET FOR OTHERS, BY REGION, 2023-2035 ($MILLION)
- TABLE 15. GLOBAL ANIMAL MILK REPLACER MARKET, BY FORM, 2023-2035 ($MILLION)
- TABLE 16. ANIMAL MILK REPLACER MARKET FOR LIQUID, BY REGION, 2023-2035 ($MILLION)
- TABLE 17. ANIMAL MILK REPLACER MARKET FOR SOLID, BY REGION, 2023-2035 ($MILLION)
- TABLE 18. GLOBAL ANIMAL MILK REPLACER MARKET, BY DISTRIBUTION CHANNEL, 2023-2035 ($MILLION)
- TABLE 19. ANIMAL MILK REPLACER MARKET FOR SUPERMARKETS AND HYPERMARKETS, BY REGION, 2023-2035 ($MILLION)
- TABLE 20. ANIMAL MILK REPLACER MARKET FOR SPECIALTY STORES, BY REGION, 2023-2035 ($MILLION)
- TABLE 21. ANIMAL MILK REPLACER MARKET FOR CONVENIENCE STORES, BY REGION, 2023-2035 ($MILLION)
- TABLE 22. ANIMAL MILK REPLACER MARKET FOR E-COMMERCE, BY REGION, 2023-2035 ($MILLION)
- TABLE 23. ANIMAL MILK REPLACER MARKET FOR OTHERS, BY REGION, 2023-2035 ($MILLION)
- TABLE 24. ANIMAL MILK REPLACER MARKET, BY REGION, 2023-2035 ($MILLION)
- TABLE 25. NORTH AMERICA ANIMAL MILK REPLACER MARKET, BY TYPE, 2023-2035 ($MILLION)
- TABLE 26. NORTH AMERICA ANIMAL MILK REPLACER MARKET, BY ANIMAL TYPE, 2023-2035 ($MILLION)
- TABLE 27. NORTH AMERICA ANIMAL MILK REPLACER MARKET, BY FORM, 2023-2035 ($MILLION)
- TABLE 28. NORTH AMERICA ANIMAL MILK REPLACER MARKET, BY DISTRIBUTION CHANNEL, 2023-2035 ($MILLION)
- TABLE 29. NORTH AMERICA ANIMAL MILK REPLACER MARKET, BY COUNTRY, 2023-2035 ($MILLION)
- TABLE 30. U.S. ANIMAL MILK REPLACER MARKET, BY TYPE, 2023-2035 ($MILLION)
- TABLE 31. U.S. ANIMAL MILK REPLACER MARKET, BY ANIMAL TYPE, 2023-2035 ($MILLION)
- TABLE 32. U.S. ANIMAL MILK REPLACER MARKET, BY FORM, 2023-2035 ($MILLION)
- TABLE 33. U.S. ANIMAL MILK REPLACER MARKET, BY DISTRIBUTION CHANNEL, 2023-2035 ($MILLION)
- TABLE 34. CANADA ANIMAL MILK REPLACER MARKET, BY TYPE, 2023-2035 ($MILLION)
- TABLE 35. CANADA ANIMAL MILK REPLACER MARKET, BY ANIMAL TYPE, 2023-2035 ($MILLION)
- TABLE 36. CANADA ANIMAL MILK REPLACER MARKET, BY FORM, 2023-2035 ($MILLION)
- TABLE 37. CANADA ANIMAL MILK REPLACER MARKET, BY DISTRIBUTION CHANNEL, 2023-2035 ($MILLION)
- TABLE 38. MEXICO ANIMAL MILK REPLACER MARKET, BY TYPE, 2023-2035 ($MILLION)
- TABLE 39. MEXICO ANIMAL MILK REPLACER MARKET, BY ANIMAL TYPE, 2023-2035 ($MILLION)
- TABLE 40. MEXICO ANIMAL MILK REPLACER MARKET, BY FORM, 2023-2035 ($MILLION)
- TABLE 41. MEXICO ANIMAL MILK REPLACER MARKET, BY DISTRIBUTION CHANNEL, 2023-2035 ($MILLION)
- TABLE 42. EUROPE ANIMAL MILK REPLACER MARKET, BY TYPE, 2023-2035 ($MILLION)
- TABLE 43. EUROPE ANIMAL MILK REPLACER MARKET, BY ANIMAL TYPE, 2023-2035 ($MILLION)
- TABLE 44. EUROPE ANIMAL MILK REPLACER MARKET, BY FORM, 2023-2035 ($MILLION)
- TABLE 45. EUROPE ANIMAL MILK REPLACER MARKET, BY DISTRIBUTION CHANNEL, 2023-2035 ($MILLION)
- TABLE 46. EUROPE ANIMAL MILK REPLACER MARKET, BY COUNTRY, 2023-2035 ($MILLION)
- TABLE 47. UK ANIMAL MILK REPLACER MARKET, BY TYPE, 2023-2035 ($MILLION)
- TABLE 48. UK ANIMAL MILK REPLACER MARKET, BY ANIMAL TYPE, 2023-2035 ($MILLION)
- TABLE 49. UK ANIMAL MILK REPLACER MARKET, BY FORM, 2023-2035 ($MILLION)
- TABLE 50. UK ANIMAL MILK REPLACER MARKET, BY DISTRIBUTION CHANNEL, 2023-2035 ($MILLION)
- TABLE 51. FRANCE ANIMAL MILK REPLACER MARKET, BY TYPE, 2023-2035 ($MILLION)
- TABLE 52. FRANCE ANIMAL MILK REPLACER MARKET, BY ANIMAL TYPE, 2023-2035 ($MILLION)
- TABLE 53. FRANCE ANIMAL MILK REPLACER MARKET, BY FORM, 2023-2035 ($MILLION)
- TABLE 54. FRANCE ANIMAL MILK REPLACER MARKET, BY DISTRIBUTION CHANNEL, 2023-2035 ($MILLION)
- TABLE 55. ITALY ANIMAL MILK REPLACER MARKET, BY TYPE, 2023-2035 ($MILLION)
- TABLE 56. ITALY ANIMAL MILK REPLACER MARKET, BY ANIMAL TYPE, 2023-2035 ($MILLION)
- TABLE 57. ITALY ANIMAL MILK REPLACER MARKET, BY FORM, 2023-2035 ($MILLION)
- TABLE 58. ITALY ANIMAL MILK REPLACER MARKET, BY DISTRIBUTION CHANNEL, 2023-2035 ($MILLION)
- TABLE 59. SPAIN ANIMAL MILK REPLACER MARKET, BY TYPE, 2023-2035 ($MILLION)
- TABLE 60. SPAIN ANIMAL MILK REPLACER MARKET, BY ANIMAL TYPE, 2023-2035 ($MILLION)
- TABLE 61. SPAIN ANIMAL MILK REPLACER MARKET, BY FORM, 2023-2035 ($MILLION)
- TABLE 62. SPAIN ANIMAL MILK REPLACER MARKET, BY DISTRIBUTION CHANNEL, 2023-2035 ($MILLION)
- TABLE 63. GERMANY ANIMAL MILK REPLACER MARKET, BY TYPE, 2023-2035 ($MILLION)
- TABLE 64. GERMANY ANIMAL MILK REPLACER MARKET, BY ANIMAL TYPE, 2023-2035 ($MILLION)
- TABLE 65. GERMANY ANIMAL MILK REPLACER MARKET, BY FORM, 2023-2035 ($MILLION)
- TABLE 66. GERMANY ANIMAL MILK REPLACER MARKET, BY DISTRIBUTION CHANNEL, 2023-2035 ($MILLION)
- TABLE 67. RUSSIA ANIMAL MILK REPLACER MARKET, BY TYPE, 2023-2035 ($MILLION)
- TABLE 68. RUSSIA ANIMAL MILK REPLACER MARKET, BY ANIMAL TYPE, 2023-2035 ($MILLION)
- TABLE 69. RUSSIA ANIMAL MILK REPLACER MARKET, BY FORM, 2023-2035 ($MILLION)
- TABLE 70. RUSSIA ANIMAL MILK REPLACER MARKET, BY DISTRIBUTION CHANNEL, 2023-2035 ($MILLION)
- TABLE 71. REST OF EUROPE ANIMAL MILK REPLACER MARKET, BY TYPE, 2023-2035 ($MILLION)
- TABLE 72. REST OF EUROPE ANIMAL MILK REPLACER MARKET, BY ANIMAL TYPE, 2023-2035 ($MILLION)
- TABLE 73. REST OF EUROPE ANIMAL MILK REPLACER MARKET, BY FORM, 2023-2035 ($MILLION)
- TABLE 74. REST OF EUROPE ANIMAL MILK REPLACER MARKET, BY DISTRIBUTION CHANNEL, 2023-2035 ($MILLION)
- TABLE 75. ASIA-PACIFIC ANIMAL MILK REPLACER MARKET, BY TYPE, 2023-2035 ($MILLION)
- TABLE 76. ASIA-PACIFIC ANIMAL MILK REPLACER MARKET, BY ANIMAL TYPE, 2023-2035 ($MILLION)
- TABLE 77. ASIA-PACIFIC ANIMAL MILK REPLACER MARKET, BY FORM, 2023-2035 ($MILLION)
- TABLE 78. ASIA-PACIFIC ANIMAL MILK REPLACER MARKET, BY DISTRIBUTION CHANNEL, 2023-2035 ($MILLION)
- TABLE 79. ASIA-PACIFIC ANIMAL MILK REPLACER MARKET, BY COUNTRY, 2023-2035 ($MILLION)
- TABLE 80. CHINA ANIMAL MILK REPLACER MARKET, BY TYPE, 2023-2035 ($MILLION)
- TABLE 81. CHINA ANIMAL MILK REPLACER MARKET, BY ANIMAL TYPE, 2023-2035 ($MILLION)
- TABLE 82. CHINA ANIMAL MILK REPLACER MARKET, BY FORM, 2023-2035 ($MILLION)
- TABLE 83. CHINA ANIMAL MILK REPLACER MARKET, BY DISTRIBUTION CHANNEL, 2023-2035 ($MILLION)
- TABLE 84. JAPAN ANIMAL MILK REPLACER MARKET, BY TYPE, 2023-2035 ($MILLION)
- TABLE 85. JAPAN ANIMAL MILK REPLACER MARKET, BY ANIMAL TYPE, 2023-2035 ($MILLION)
- TABLE 86. JAPAN ANIMAL MILK REPLACER MARKET, BY FORM, 2023-2035 ($MILLION)
- TABLE 87. JAPAN ANIMAL MILK REPLACER MARKET, BY DISTRIBUTION CHANNEL, 2023-2035 ($MILLION)
- TABLE 88. INDIA ANIMAL MILK REPLACER MARKET, BY TYPE, 2023-2035 ($MILLION)
- TABLE 89. INDIA ANIMAL MILK REPLACER MARKET, BY ANIMAL TYPE, 2023-2035 ($MILLION)
- TABLE 90. INDIA ANIMAL MILK REPLACER MARKET, BY FORM, 2023-2035 ($MILLION)
- TABLE 91. INDIA ANIMAL MILK REPLACER MARKET, BY DISTRIBUTION CHANNEL, 2023-2035 ($MILLION)
- TABLE 92. SOUTH KOREA ANIMAL MILK REPLACER MARKET, BY TYPE, 2023-2035 ($MILLION)
- TABLE 93. SOUTH KOREA ANIMAL MILK REPLACER MARKET, BY ANIMAL TYPE, 2023-2035 ($MILLION)
- TABLE 94. SOUTH KOREA ANIMAL MILK REPLACER MARKET, BY FORM, 2023-2035 ($MILLION)
- TABLE 95. SOUTH KOREA ANIMAL MILK REPLACER MARKET, BY DISTRIBUTION CHANNEL, 2023-2035 ($MILLION)
- TABLE 96. AUSTRALIA ANIMAL MILK REPLACER MARKET, BY TYPE, 2023-2035 ($MILLION)
- TABLE 97. AUSTRALIA ANIMAL MILK REPLACER MARKET, BY ANIMAL TYPE, 2023-2035 ($MILLION)
- TABLE 98. AUSTRALIA ANIMAL MILK REPLACER MARKET, BY FORM, 2023-2035 ($MILLION)
- TABLE 99. AUSTRALIA ANIMAL MILK REPLACER MARKET, BY DISTRIBUTION CHANNEL, 2023-2035 ($MILLION)
- TABLE 100. THAILAND ANIMAL MILK REPLACER MARKET, BY TYPE, 2023-2035 ($MILLION)
- TABLE 101. THAILAND ANIMAL MILK REPLACER MARKET, BY ANIMAL TYPE, 2023-2035 ($MILLION)
- TABLE 102. THAILAND ANIMAL MILK REPLACER MARKET, BY FORM, 2023-2035 ($MILLION)
- TABLE 103. THAILAND ANIMAL MILK REPLACER MARKET, BY DISTRIBUTION CHANNEL, 2023-2035 ($MILLION)
- TABLE 104. MALAYSIA ANIMAL MILK REPLACER MARKET, BY TYPE, 2023-2035 ($MILLION)
- TABLE 105. MALAYSIA ANIMAL MILK REPLACER MARKET, BY ANIMAL TYPE, 2023-2035 ($MILLION)
- TABLE 106. MALAYSIA ANIMAL MILK REPLACER MARKET, BY FORM, 2023-2035 ($MILLION)
- TABLE 107. MALAYSIA ANIMAL MILK REPLACER MARKET, BY DISTRIBUTION CHANNEL, 2023-2035 ($MILLION)
- TABLE 108. INDONESIA ANIMAL MILK REPLACER MARKET, BY TYPE, 2023-2035 ($MILLION)
- TABLE 109. INDONESIA ANIMAL MILK REPLACER MARKET, BY ANIMAL TYPE, 2023-2035 ($MILLION)
- TABLE 110. INDONESIA ANIMAL MILK REPLACER MARKET, BY FORM, 2023-2035 ($MILLION)
- TABLE 111. INDONESIA ANIMAL MILK REPLACER MARKET, BY DISTRIBUTION CHANNEL, 2023-2035 ($MILLION)
- TABLE 112. REST OF ASIA-PACIFIC ANIMAL MILK REPLACER MARKET, BY TYPE, 2023-2035 ($MILLION)
- TABLE 113. REST OF ASIA-PACIFIC ANIMAL MILK REPLACER MARKET, BY ANIMAL TYPE, 2023-2035 ($MILLION)
- TABLE 114. REST OF ASIA-PACIFIC ANIMAL MILK REPLACER MARKET, BY FORM, 2023-2035 ($MILLION)
- TABLE 115. REST OF ASIA-PACIFIC ANIMAL MILK REPLACER MARKET, BY DISTRIBUTION CHANNEL, 2023-2035 ($MILLION)
- TABLE 116. LATIN AMERICA ANIMAL MILK REPLACER MARKET, BY TYPE, 2023-2035 ($MILLION)
- TABLE 117. LATIN AMERICA ANIMAL MILK REPLACER MARKET, BY ANIMAL TYPE, 2023-2035 ($MILLION)
- TABLE 118. LATIN AMERICA ANIMAL MILK REPLACER MARKET, BY FORM, 2023-2035 ($MILLION)
- TABLE 119. LATIN AMERICA ANIMAL MILK REPLACER MARKET, BY DISTRIBUTION CHANNEL, 2023-2035 ($MILLION)
- TABLE 120. LATIN AMERICA ANIMAL MILK REPLACER MARKET, BY COUNTRY, 2023-2035 ($MILLION)
- TABLE 121. BRAZIL ANIMAL MILK REPLACER MARKET, BY TYPE, 2023-2035 ($MILLION)
- TABLE 122. BRAZIL ANIMAL MILK REPLACER MARKET, BY ANIMAL TYPE, 2023-2035 ($MILLION)
- TABLE 123. BRAZIL ANIMAL MILK REPLACER MARKET, BY FORM, 2023-2035 ($MILLION)
- TABLE 124. BRAZIL ANIMAL MILK REPLACER MARKET, BY DISTRIBUTION CHANNEL, 2023-2035 ($MILLION)
- TABLE 125. ARGENTINA ANIMAL MILK REPLACER MARKET, BY TYPE, 2023-2035 ($MILLION)
- TABLE 126. ARGENTINA ANIMAL MILK REPLACER MARKET, BY ANIMAL TYPE, 2023-2035 ($MILLION)
- TABLE 127. ARGENTINA ANIMAL MILK REPLACER MARKET, BY FORM, 2023-2035 ($MILLION)
- TABLE 128. ARGENTINA ANIMAL MILK REPLACER MARKET, BY DISTRIBUTION CHANNEL, 2023-2035 ($MILLION)
- TABLE 129. COLOMBIA ANIMAL MILK REPLACER MARKET, BY TYPE, 2023-2035 ($MILLION)
- TABLE 130. COLOMBIA ANIMAL MILK REPLACER MARKET, BY ANIMAL TYPE, 2023-2035 ($MILLION)
- TABLE 131. COLOMBIA ANIMAL MILK REPLACER MARKET, BY FORM, 2023-2035 ($MILLION)
- TABLE 132. COLOMBIA ANIMAL MILK REPLACER MARKET, BY DISTRIBUTION CHANNEL, 2023-2035 ($MILLION)
- TABLE 133. REST OF LATIN AMERICA ANIMAL MILK REPLACER MARKET, BY TYPE, 2023-2035 ($MILLION)
- TABLE 134. REST OF LATIN AMERICA ANIMAL MILK REPLACER MARKET, BY ANIMAL TYPE, 2023-2035 ($MILLION)
- TABLE 135. REST OF LATIN AMERICA ANIMAL MILK REPLACER MARKET, BY FORM, 2023-2035 ($MILLION)
- TABLE 136. REST OF LATIN AMERICA ANIMAL MILK REPLACER MARKET, BY DISTRIBUTION CHANNEL, 2023-2035 ($MILLION)
- TABLE 137. MIDDLE EAST AND AFRICA ANIMAL MILK REPLACER MARKET, BY TYPE, 2023-2035 ($MILLION)
- TABLE 138. MIDDLE EAST AND AFRICA ANIMAL MILK REPLACER MARKET, BY ANIMAL TYPE, 2023-2035 ($MILLION)
- TABLE 139. MIDDLE EAST AND AFRICA ANIMAL MILK REPLACER MARKET, BY FORM, 2023-2035 ($MILLION)
- TABLE 140. MIDDLE EAST AND AFRICA ANIMAL MILK REPLACER MARKET, BY DISTRIBUTION CHANNEL, 2023-2035 ($MILLION)
- TABLE 141. MIDDLE EAST AND AFRICA ANIMAL MILK REPLACER MARKET, BY COUNTRY, 2023-2035 ($MILLION)
- TABLE 142. GCC ANIMAL MILK REPLACER MARKET, BY TYPE, 2023-2035 ($MILLION)
- TABLE 143. GCC ANIMAL MILK REPLACER MARKET, BY ANIMAL TYPE, 2023-2035 ($MILLION)
- TABLE 144. GCC ANIMAL MILK REPLACER MARKET, BY FORM, 2023-2035 ($MILLION)
- TABLE 145. GCC ANIMAL MILK REPLACER MARKET, BY DISTRIBUTION CHANNEL, 2023-2035 ($MILLION)
- TABLE 146. SOUTH AFRICA ANIMAL MILK REPLACER MARKET, BY TYPE, 2023-2035 ($MILLION)
- TABLE 147. SOUTH AFRICA ANIMAL MILK REPLACER MARKET, BY ANIMAL TYPE, 2023-2035 ($MILLION)
- TABLE 148. SOUTH AFRICA ANIMAL MILK REPLACER MARKET, BY FORM, 2023-2035 ($MILLION)
- TABLE 149. SOUTH AFRICA ANIMAL MILK REPLACER MARKET, BY DISTRIBUTION CHANNEL, 2023-2035 ($MILLION)
- TABLE 150. REST OF MIDDLE EAST AND AFRICA ANIMAL MILK REPLACER MARKET, BY TYPE, 2023-2035 ($MILLION)
- TABLE 151. REST OF MIDDLE EAST AND AFRICA ANIMAL MILK REPLACER MARKET, BY ANIMAL TYPE, 2023-2035 ($MILLION)
- TABLE 152. REST OF MIDDLE EAST AND AFRICA ANIMAL MILK REPLACER MARKET, BY FORM, 2023-2035 ($MILLION)
- TABLE 153. REST OF MIDDLE EAST AND AFRICA ANIMAL MILK REPLACER MARKET, BY DISTRIBUTION CHANNEL, 2023-2035 ($MILLION)
- TABLE 154. ALLTECH: KEY EXECUTIVES
- TABLE 155. ALLTECH: COMPANY SNAPSHOT
- TABLE 156. ALLTECH: PRODUCT SEGMENTS
- TABLE 157. ALLTECH: SERVICE SEGMENTS
- TABLE 158. ALLTECH: PRODUCT PORTFOLIO
- TABLE 159. ALLTECH: KEY STRATEGIES
- TABLE 160. BEAPHAR: KEY EXECUTIVES
- TABLE 161. BEAPHAR: COMPANY SNAPSHOT
- TABLE 162. BEAPHAR: PRODUCT SEGMENTS
- TABLE 163. BEAPHAR: SERVICE SEGMENTS
- TABLE 164. BEAPHAR: PRODUCT PORTFOLIO
- TABLE 165. BEAPHAR: KEY STRATEGIES
- TABLE 166. CARGILL, INCORPORATED: KEY EXECUTIVES
- TABLE 167. CARGILL, INCORPORATED: COMPANY SNAPSHOT
- TABLE 168. CARGILL, INCORPORATED: PRODUCT SEGMENTS
- TABLE 169. CARGILL, INCORPORATED: SERVICE SEGMENTS
- TABLE 170. CARGILL, INCORPORATED: PRODUCT PORTFOLIO
- TABLE 171. CARGILL, INCORPORATED: KEY STRATEGIES
- TABLE 172. ROYAL FRIESLANDCAMPINA N.V.: KEY EXECUTIVES
- TABLE 173. ROYAL FRIESLANDCAMPINA N.V.: COMPANY SNAPSHOT
- TABLE 174. ROYAL FRIESLANDCAMPINA N.V.: PRODUCT SEGMENTS
- TABLE 175. ROYAL FRIESLANDCAMPINA N.V.: SERVICE SEGMENTS
- TABLE 176. ROYAL FRIESLANDCAMPINA N.V.: PRODUCT PORTFOLIO
- TABLE 177. ROYAL FRIESLANDCAMPINA N.V.: KEY STRATEGIES
- TABLE 178. KONINKLIJKE DSM N.V.: KEY EXECUTIVES
- TABLE 179. KONINKLIJKE DSM N.V.: COMPANY SNAPSHOT
- TABLE 180. KONINKLIJKE DSM N.V.: PRODUCT SEGMENTS
- TABLE 181. KONINKLIJKE DSM N.V.: SERVICE SEGMENTS
- TABLE 182. KONINKLIJKE DSM N.V.: PRODUCT PORTFOLIO
- TABLE 183. KONINKLIJKE DSM N.V.: KEY STRATEGIES
- TABLE 184. LIPROVIT B.V.: KEY EXECUTIVES
- TABLE 185. LIPROVIT B.V.: COMPANY SNAPSHOT
- TABLE 186. LIPROVIT B.V.: PRODUCT SEGMENTS
- TABLE 187. LIPROVIT B.V.: SERVICE SEGMENTS
- TABLE 188. LIPROVIT B.V.: PRODUCT PORTFOLIO
- TABLE 189. LIPROVIT B.V.: KEY STRATEGIES
- TABLE 190. MANNA PRO PRODUCTS, LLC: KEY EXECUTIVES
- TABLE 191. MANNA PRO PRODUCTS, LLC: COMPANY SNAPSHOT
- TABLE 192. MANNA PRO PRODUCTS, LLC: PRODUCT SEGMENTS
- TABLE 193. MANNA PRO PRODUCTS, LLC: SERVICE SEGMENTS
- TABLE 194. MANNA PRO PRODUCTS, LLC: PRODUCT PORTFOLIO
- TABLE 195. MANNA PRO PRODUCTS, LLC: KEY STRATEGIES
- TABLE 196. NUTRECO: KEY EXECUTIVES
- TABLE 197. NUTRECO: COMPANY SNAPSHOT
- TABLE 198. NUTRECO: PRODUCT SEGMENTS
- TABLE 199. NUTRECO: SERVICE SEGMENTS
- TABLE 200. NUTRECO: PRODUCT PORTFOLIO
- TABLE 201. NUTRECO: KEY STRATEGIES
- TABLE 202. GLANBIA PLC: KEY EXECUTIVES
- TABLE 203. GLANBIA PLC: COMPANY SNAPSHOT
- TABLE 204. GLANBIA PLC: PRODUCT SEGMENTS
- TABLE 205. GLANBIA PLC: SERVICE SEGMENTS
- TABLE 206. GLANBIA PLC: PRODUCT PORTFOLIO
- TABLE 207. GLANBIA PLC: KEY STRATEGIES
- TABLE 208. HUBBARD FEEDS INC.: KEY EXECUTIVES
- TABLE 209. HUBBARD FEEDS INC.: COMPANY SNAPSHOT
- TABLE 210. HUBBARD FEEDS INC.: PRODUCT SEGMENTS
- TABLE 211. HUBBARD FEEDS INC.: SERVICE SEGMENTS
- TABLE 212. HUBBARD FEEDS INC.: PRODUCT PORTFOLIO
- TABLE 213. HUBBARD FEEDS INC.: KEY STRATEGIES
LIST OF FIGURES
- FIGURE 01. ANIMAL MILK REPLACER MARKET, 2023-2035
- FIGURE 02. SEGMENTATION OF ANIMAL MILK REPLACER MARKET,2023-2035
- FIGURE 03. TOP IMPACTING FACTORS IN ANIMAL MILK REPLACER MARKET
- FIGURE 04. TOP INVESTMENT POCKETS IN ANIMAL MILK REPLACER MARKET (2024-2035)
- FIGURE 05. BARGAINING POWER OF SUPPLIERS
- FIGURE 06. BARGAINING POWER OF BUYERS
- FIGURE 07. THREAT OF SUBSTITUTION
- FIGURE 08. THREAT OF SUBSTITUTION
- FIGURE 09. COMPETITIVE RIVALRY
- FIGURE 10. GLOBAL ANIMAL MILK REPLACER MARKET:DRIVERS, RESTRAINTS AND OPPORTUNITIES
- FIGURE 11. ANIMAL MILK REPLACER MARKET, BY TYPE, 2023 AND 2035(%)
- FIGURE 12. COMPARATIVE SHARE ANALYSIS OF ANIMAL MILK REPLACER MARKET FOR DAIRY BASED, BY COUNTRY 2023 AND 2035(%)
- FIGURE 13. COMPARATIVE SHARE ANALYSIS OF ANIMAL MILK REPLACER MARKET FOR PLANT BASED, BY COUNTRY 2023 AND 2035(%)
- FIGURE 14. COMPARATIVE SHARE ANALYSIS OF ANIMAL MILK REPLACER MARKET FOR ANIMAL BASED, BY COUNTRY 2023 AND 2035(%)
- FIGURE 15. COMPARATIVE SHARE ANALYSIS OF ANIMAL MILK REPLACER MARKET FOR PRE-MIXED, BY COUNTRY 2023 AND 2035(%)
- FIGURE 16. COMPARATIVE SHARE ANALYSIS OF ANIMAL MILK REPLACER MARKET FOR OTHERS, BY COUNTRY 2023 AND 2035(%)
- FIGURE 17. ANIMAL MILK REPLACER MARKET, BY ANIMAL TYPE, 2023 AND 2035(%)
- FIGURE 18. COMPARATIVE SHARE ANALYSIS OF ANIMAL MILK REPLACER MARKET FOR SMALL ANIMAL, BY COUNTRY 2023 AND 2035(%)
- FIGURE 19. COMPARATIVE SHARE ANALYSIS OF ANIMAL MILK REPLACER MARKET FOR CALF, BY COUNTRY 2023 AND 2035(%)
- FIGURE 20. COMPARATIVE SHARE ANALYSIS OF ANIMAL MILK REPLACER MARKET FOR PIG, BY COUNTRY 2023 AND 2035(%)
- FIGURE 21. COMPARATIVE SHARE ANALYSIS OF ANIMAL MILK REPLACER MARKET FOR KITTEN, BY COUNTRY 2023 AND 2035(%)
- FIGURE 22. COMPARATIVE SHARE ANALYSIS OF ANIMAL MILK REPLACER MARKET FOR PUPPIES, BY COUNTRY 2023 AND 2035(%)
- FIGURE 23. COMPARATIVE SHARE ANALYSIS OF ANIMAL MILK REPLACER MARKET FOR FOAL, BY COUNTRY 2023 AND 2035(%)
- FIGURE 24. COMPARATIVE SHARE ANALYSIS OF ANIMAL MILK REPLACER MARKET FOR OTHERS, BY COUNTRY 2023 AND 2035(%)
- FIGURE 25. ANIMAL MILK REPLACER MARKET, BY FORM, 2023 AND 2035(%)
- FIGURE 26. COMPARATIVE SHARE ANALYSIS OF ANIMAL MILK REPLACER MARKET FOR LIQUID, BY COUNTRY 2023 AND 2035(%)
- FIGURE 27. COMPARATIVE SHARE ANALYSIS OF ANIMAL MILK REPLACER MARKET FOR SOLID, BY COUNTRY 2023 AND 2035(%)
- FIGURE 28. ANIMAL MILK REPLACER MARKET, BY DISTRIBUTION CHANNEL, 2023 AND 2035(%)
- FIGURE 29. COMPARATIVE SHARE ANALYSIS OF ANIMAL MILK REPLACER MARKET FOR SUPERMARKETS AND HYPERMARKETS, BY COUNTRY 2023 AND 2035(%)
- FIGURE 30. COMPARATIVE SHARE ANALYSIS OF ANIMAL MILK REPLACER MARKET FOR SPECIALTY STORES, BY COUNTRY 2023 AND 2035(%)
- FIGURE 31. COMPARATIVE SHARE ANALYSIS OF ANIMAL MILK REPLACER MARKET FOR CONVENIENCE STORES, BY COUNTRY 2023 AND 2035(%)
- FIGURE 32. COMPARATIVE SHARE ANALYSIS OF ANIMAL MILK REPLACER MARKET FOR E-COMMERCE, BY COUNTRY 2023 AND 2035(%)
- FIGURE 33. COMPARATIVE SHARE ANALYSIS OF ANIMAL MILK REPLACER MARKET FOR OTHERS, BY COUNTRY 2023 AND 2035(%)
- FIGURE 34. ANIMAL MILK REPLACER MARKET BY REGION, 2023 AND 2035(%)
- FIGURE 35. U.S. ANIMAL MILK REPLACER MARKET, 2023-2035 ($MILLION)
- FIGURE 36. CANADA ANIMAL MILK REPLACER MARKET, 2023-2035 ($MILLION)
- FIGURE 37. MEXICO ANIMAL MILK REPLACER MARKET, 2023-2035 ($MILLION)
- FIGURE 38. UK ANIMAL MILK REPLACER MARKET, 2023-2035 ($MILLION)
- FIGURE 39. FRANCE ANIMAL MILK REPLACER MARKET, 2023-2035 ($MILLION)
- FIGURE 40. ITALY ANIMAL MILK REPLACER MARKET, 2023-2035 ($MILLION)
- FIGURE 41. SPAIN ANIMAL MILK REPLACER MARKET, 2023-2035 ($MILLION)
- FIGURE 42. GERMANY ANIMAL MILK REPLACER MARKET, 2023-2035 ($MILLION)
- FIGURE 43. RUSSIA ANIMAL MILK REPLACER MARKET, 2023-2035 ($MILLION)
- FIGURE 44. REST OF EUROPE ANIMAL MILK REPLACER MARKET, 2023-2035 ($MILLION)
- FIGURE 45. CHINA ANIMAL MILK REPLACER MARKET, 2023-2035 ($MILLION)
- FIGURE 46. JAPAN ANIMAL MILK REPLACER MARKET, 2023-2035 ($MILLION)
- FIGURE 47. INDIA ANIMAL MILK REPLACER MARKET, 2023-2035 ($MILLION)
- FIGURE 48. SOUTH KOREA ANIMAL MILK REPLACER MARKET, 2023-2035 ($MILLION)
- FIGURE 49. AUSTRALIA ANIMAL MILK REPLACER MARKET, 2023-2035 ($MILLION)
- FIGURE 50. THAILAND ANIMAL MILK REPLACER MARKET, 2023-2035 ($MILLION)
- FIGURE 51. MALAYSIA ANIMAL MILK REPLACER MARKET, 2023-2035 ($MILLION)
- FIGURE 52. INDONESIA ANIMAL MILK REPLACER MARKET, 2023-2035 ($MILLION)
- FIGURE 53. REST OF ASIA-PACIFIC ANIMAL MILK REPLACER MARKET, 2023-2035 ($MILLION)
- FIGURE 54. BRAZIL ANIMAL MILK REPLACER MARKET, 2023-2035 ($MILLION)
- FIGURE 55. ARGENTINA ANIMAL MILK REPLACER MARKET, 2023-2035 ($MILLION)
- FIGURE 56. COLOMBIA ANIMAL MILK REPLACER MARKET, 2023-2035 ($MILLION)
- FIGURE 57. REST OF LATIN AMERICA ANIMAL MILK REPLACER MARKET, 2023-2035 ($MILLION)
- FIGURE 58. GCC ANIMAL MILK REPLACER MARKET, 2023-2035 ($MILLION)
- FIGURE 59. SOUTH AFRICA ANIMAL MILK REPLACER MARKET, 2023-2035 ($MILLION)
- FIGURE 60. REST OF MIDDLE EAST AND AFRICA ANIMAL MILK REPLACER MARKET, 2023-2035 ($MILLION)
- FIGURE 61. TOP WINNING STRATEGIES, BY YEAR
- FIGURE 62. TOP WINNING STRATEGIES, BY DEVELOPMENT
- FIGURE 63. TOP WINNING STRATEGIES, BY COMPANY
- FIGURE 64. PRODUCT MAPPING OF TOP 10 PLAYERS
- FIGURE 65. COMPETITIVE DASHBOARD
- FIGURE 66. COMPETITIVE HEATMAP: ANIMAL MILK REPLACER MARKET
- FIGURE 67. TOP PLAYER POSITIONING, 2023
Have a question?


SELECT AN OPTION
Have a question?
Questions? Please give us a call or visit the contact form.