
PUBLISHER: Allied Market Research | PRODUCT CODE: 1513357

PUBLISHER: Allied Market Research | PRODUCT CODE: 1513357
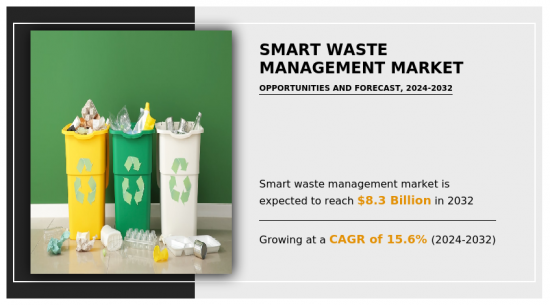
Smart Waste Management Market By Waste Type, By Method, By Source : Global Opportunity Analysis and Industry Forecast, 2024-2032
The global smart waste management market was valued at $2.2 billion in 2023, and is projected to reach $8.3 billion by 2032, growing at a CAGR of 15.6% from 2024 to 2032.Smart waste management is the concept that uses sensors in waste to track live status of city waste collection services when bins are ready to be emptied, or filled. It also monitors historical data collected by sensors and databases, which can be used to identify and optimize driver routes, fill patterns, reduce operational costs, and schedules. Remote monitoring and IoT based waste bins are more feasible to collect waste effectively. It also reduces routing and fuel prices.
Smart waste management includes all types of waste including solid, special, or e-waste. Industrial waste refers to waste generated in industries during production and manufacturing processes. Healthcare waste refers to waste generated in pharmaceutical, medical, chemical, and paint manufacturing industries. Further, major activities performed on waste are its smart collection, smart energy recovery & smart disposal, and smart processing. Smart collection services refer to collection & transportation, storage & handling, and sorting of waste by using IoT based sensors and EcoATM. Whereas, remote monitoring and data analytics concepts used to handle disposal services refer to segregation of waste into landfills, recycling, composting, and anaerobic digestion.
The smart waste management industry is majorly driven by growth in urbanization and rapid industrialization. This has eventually led to increase in volume of waste from municipal as well as industrial sector. In addition, rise in environmental awareness has led to increase in planned collection and disposal of waste. Moreover, increase in smart city initiatives in developed countries is anticipated to drive growth of the global smart waste management market.
However, lack of efficient connectivity and high initial cost required are projected to hamper growth of the global smart waste management market. On the contrary, owing to technological advancements and rise in adoption by developing countries are expected to provide lucrative opportunities for the smart waste management market during the forecast period.
The global smart waste management market is segmented on the basis of waste type, method, source, and region. By waste type, it is divided into solid waste, special waste, and e-waste. On the basis of method, the market is divided into smart collection, smart processing, and smart energy recovery & smart disposal. On the basis of source, it is segmented into residential, commercial, and industrial. Region wise, the market is divided into North America, Europe, Asia-Pacific, Latin America, and Middle East and Africa.
Competition Analysis
The key players profiled in the global smart waste management market report include Covanta Holding Corporation, SUEZ Environmental Services, Republic Services Inc., Waste Management Inc., Sensoneo J.S.A., Bigbelly Inc., Urbiotica, Ecube Labs Co Ltd., and Enevo Oy.
Many competitors in the smart waste management market adopted agreement, partnership, and acquisition as their key developmental strategies to expand their service portfolio. For instance, in August 2020, Republic Services Inc. signed a partnership with Aria Energy based in the U.S., which is a renewable energy management company. The partnership aimed to purify biogas from landfills to RNG (renewable natural gas).
Key Benefits For Stakeholders
- The report provides an extensive analysis of the current and emerging global smart waste management market trends and dynamics.
- In-depth analysis of the market is conducted by smart waste management market estimations for key market segments between 2023 and 2032.
- Extensive analysis of the market is conducted by following key product positioning and monitoring of the top competitors within the market framework.
- A comprehensive smart waste management market opportunity analysis of all the countries is also provided in the report.
- The global smart waste management market forecast analysis from 2023 to 2032 is included in the report.
- The key market players within the market are profiled in this report and their strategies are analyzed thoroughly, which help understand the competitive outlook of the industry.
Additional benefits you will get with this purchase are:
- Quarterly Update and* (only available with a corporate license, on listed price)
- 5 additional Company Profile of client Choice pre- or Post-purchase, as a free update.
- Free Upcoming Version on the Purchase of Five and Enterprise User License.
- 16 analyst hours of support* (post-purchase, if you find additional data requirements upon review of the report, you may receive support amounting to 16 analyst hours to solve questions, and post-sale queries)
- 15% Free Customization* (in case the scope or segment of the report does not match your requirements, 15% is equivalent to 3 working days of free work, applicable once)
- Free data Pack on the Five and Enterprise User License. (Excel version of the report)
- Free Updated report if the report is 6-12 months old or older.
- 24-hour priority response*
- Free Industry updates and white papers.
Possible Customization with this report (with additional cost and timeline, please talk to the sales executive to know more)
- Investment Opportunities
- Supply Chain Analysis & Vendor Margins
- Upcoming/New Entrant by Regions
- Technology Trend Analysis
- Market share analysis of players by products/segments
- New Product Development/ Product Matrix of Key Players
- Pain Point Analysis
- Additional company profiles with specific to client's interest
- Additional country or region analysis- market size and forecast
- Average Selling Price Analysis / Price Point Analysis
- Brands Share Analysis
- Criss-cross segment analysis- market size and forecast
- Expanded list for Company Profiles
- Historic market data
- Key player details (including location, contact details, supplier/vendor network etc. in excel format)
- List of customers/consumers/raw material suppliers- value chain analysis
- Market share analysis of players at global/region/country level
- Product Consumption Analysis
- SWOT Analysis
- Volume Market Size and Forecast
Key Market Segments
By Waste Type
- Solid Waste
- Special Waste
- E-Waste
By Method
- Smart Collection
- Smart Processing
- Smart Disposal
By Source
- Residential
- Commercial
- Industrial
By Region
- North America
- U.S.
- Canada
- Mexico
- Europe
- Germany
- France
- UK
- Italy
- Rest of Europe
- Asia-Pacific
- China
- India
- Japan
- South Korea
- Rest of Asia-Pacific
- Latin America
- Brazil
- Argentina
- Colombia
- Rest of Latin America
- Middle East and Africa
- Saudi Arabia
- UAE
- South Africa
- Nigeria
- Rest Of Mea
Key Market Players:
- Republic Services Inc.
- Veolia Environnement S.A.
- Urbiotica, S.L.
- Ecube Labs Co Ltd
- Waste Management Inc.
- SUEZ Environmental Services.
- Enevo Oy
- Covanta Holding Corporation
- Bigbelly, Inc.
- Sensoneo j. s. a.
TABLE OF CONTENTS
CHAPTER 1: INTRODUCTION
- 1.1. Report description
- 1.2. Key market segments
- 1.3. Key benefits to the stakeholders
- 1.4. Research methodology
- 1.4.1. Primary research
- 1.4.2. Secondary research
- 1.4.3. Analyst tools and models
CHAPTER 2: EXECUTIVE SUMMARY
- 2.1. CXO perspective
CHAPTER 3: MARKET OVERVIEW
- 3.1. Market definition and scope
- 3.2. Key findings
- 3.2.1. Top impacting factors
- 3.2.2. Top investment pockets
- 3.3. Porter's five forces analysis
- 3.4. Market dynamics
- 3.4.1. Drivers
- 3.4.2. Restraints
- 3.4.3. Opportunities
CHAPTER 4: SMART WASTE MANAGEMENT MARKET, BY WASTE TYPE
- 4.1. Overview
- 4.1.1. Market size and forecast
- 4.2. Solid Waste
- 4.2.1. Key market trends, growth factors and opportunities
- 4.2.2. Market size and forecast, by region
- 4.2.3. Market share analysis by country
- 4.3. Special Waste
- 4.3.1. Key market trends, growth factors and opportunities
- 4.3.2. Market size and forecast, by region
- 4.3.3. Market share analysis by country
- 4.4. E-Waste
- 4.4.1. Key market trends, growth factors and opportunities
- 4.4.2. Market size and forecast, by region
- 4.4.3. Market share analysis by country
CHAPTER 5: SMART WASTE MANAGEMENT MARKET, BY METHOD
- 5.1. Overview
- 5.1.1. Market size and forecast
- 5.2. Smart Collection
- 5.2.1. Key market trends, growth factors and opportunities
- 5.2.2. Market size and forecast, by region
- 5.2.3. Market share analysis by country
- 5.3. Smart Processing
- 5.3.1. Key market trends, growth factors and opportunities
- 5.3.2. Market size and forecast, by region
- 5.3.3. Market share analysis by country
- 5.4. Smart Disposal
- 5.4.1. Key market trends, growth factors and opportunities
- 5.4.2. Market size and forecast, by region
- 5.4.3. Market share analysis by country
CHAPTER 6: SMART WASTE MANAGEMENT MARKET, BY SOURCE
- 6.1. Overview
- 6.1.1. Market size and forecast
- 6.2. Residential
- 6.2.1. Key market trends, growth factors and opportunities
- 6.2.2. Market size and forecast, by region
- 6.2.3. Market share analysis by country
- 6.3. Commercial
- 6.3.1. Key market trends, growth factors and opportunities
- 6.3.2. Market size and forecast, by region
- 6.3.3. Market share analysis by country
- 6.4. Industrial
- 6.4.1. Key market trends, growth factors and opportunities
- 6.4.2. Market size and forecast, by region
- 6.4.3. Market share analysis by country
CHAPTER 7: SMART WASTE MANAGEMENT MARKET, BY REGION
- 7.1. Overview
- 7.1.1. Market size and forecast By Region
- 7.2. North America
- 7.2.1. Key market trends, growth factors and opportunities
- 7.2.2. Market size and forecast, by Waste Type
- 7.2.3. Market size and forecast, by Method
- 7.2.4. Market size and forecast, by Source
- 7.2.5. Market size and forecast, by country
- 7.2.5.1. U.S.
- 7.2.5.1.1. Market size and forecast, by Waste Type
- 7.2.5.1.2. Market size and forecast, by Method
- 7.2.5.1.3. Market size and forecast, by Source
- 7.2.5.2. Canada
- 7.2.5.2.1. Market size and forecast, by Waste Type
- 7.2.5.2.2. Market size and forecast, by Method
- 7.2.5.2.3. Market size and forecast, by Source
- 7.2.5.3. Mexico
- 7.2.5.3.1. Market size and forecast, by Waste Type
- 7.2.5.3.2. Market size and forecast, by Method
- 7.2.5.3.3. Market size and forecast, by Source
- 7.3. Europe
- 7.3.1. Key market trends, growth factors and opportunities
- 7.3.2. Market size and forecast, by Waste Type
- 7.3.3. Market size and forecast, by Method
- 7.3.4. Market size and forecast, by Source
- 7.3.5. Market size and forecast, by country
- 7.3.5.1. Germany
- 7.3.5.1.1. Market size and forecast, by Waste Type
- 7.3.5.1.2. Market size and forecast, by Method
- 7.3.5.1.3. Market size and forecast, by Source
- 7.3.5.2. France
- 7.3.5.2.1. Market size and forecast, by Waste Type
- 7.3.5.2.2. Market size and forecast, by Method
- 7.3.5.2.3. Market size and forecast, by Source
- 7.3.5.3. UK
- 7.3.5.3.1. Market size and forecast, by Waste Type
- 7.3.5.3.2. Market size and forecast, by Method
- 7.3.5.3.3. Market size and forecast, by Source
- 7.3.5.4. Italy
- 7.3.5.4.1. Market size and forecast, by Waste Type
- 7.3.5.4.2. Market size and forecast, by Method
- 7.3.5.4.3. Market size and forecast, by Source
- 7.3.5.5. Rest of Europe
- 7.3.5.5.1. Market size and forecast, by Waste Type
- 7.3.5.5.2. Market size and forecast, by Method
- 7.3.5.5.3. Market size and forecast, by Source
- 7.4. Asia-Pacific
- 7.4.1. Key market trends, growth factors and opportunities
- 7.4.2. Market size and forecast, by Waste Type
- 7.4.3. Market size and forecast, by Method
- 7.4.4. Market size and forecast, by Source
- 7.4.5. Market size and forecast, by country
- 7.4.5.1. China
- 7.4.5.1.1. Market size and forecast, by Waste Type
- 7.4.5.1.2. Market size and forecast, by Method
- 7.4.5.1.3. Market size and forecast, by Source
- 7.4.5.2. India
- 7.4.5.2.1. Market size and forecast, by Waste Type
- 7.4.5.2.2. Market size and forecast, by Method
- 7.4.5.2.3. Market size and forecast, by Source
- 7.4.5.3. Japan
- 7.4.5.3.1. Market size and forecast, by Waste Type
- 7.4.5.3.2. Market size and forecast, by Method
- 7.4.5.3.3. Market size and forecast, by Source
- 7.4.5.4. South Korea
- 7.4.5.4.1. Market size and forecast, by Waste Type
- 7.4.5.4.2. Market size and forecast, by Method
- 7.4.5.4.3. Market size and forecast, by Source
- 7.4.5.5. Rest of Asia-Pacific
- 7.4.5.5.1. Market size and forecast, by Waste Type
- 7.4.5.5.2. Market size and forecast, by Method
- 7.4.5.5.3. Market size and forecast, by Source
- 7.5. Latin America
- 7.5.1. Key market trends, growth factors and opportunities
- 7.5.2. Market size and forecast, by Waste Type
- 7.5.3. Market size and forecast, by Method
- 7.5.4. Market size and forecast, by Source
- 7.5.5. Market size and forecast, by country
- 7.5.5.1. Brazil
- 7.5.5.1.1. Market size and forecast, by Waste Type
- 7.5.5.1.2. Market size and forecast, by Method
- 7.5.5.1.3. Market size and forecast, by Source
- 7.5.5.2. Argentina
- 7.5.5.2.1. Market size and forecast, by Waste Type
- 7.5.5.2.2. Market size and forecast, by Method
- 7.5.5.2.3. Market size and forecast, by Source
- 7.5.5.3. Colombia
- 7.5.5.3.1. Market size and forecast, by Waste Type
- 7.5.5.3.2. Market size and forecast, by Method
- 7.5.5.3.3. Market size and forecast, by Source
- 7.5.5.4. Rest of Latin America
- 7.5.5.4.1. Market size and forecast, by Waste Type
- 7.5.5.4.2. Market size and forecast, by Method
- 7.5.5.4.3. Market size and forecast, by Source
- 7.6. Middle East and Africa
- 7.6.1. Key market trends, growth factors and opportunities
- 7.6.2. Market size and forecast, by Waste Type
- 7.6.3. Market size and forecast, by Method
- 7.6.4. Market size and forecast, by Source
- 7.6.5. Market size and forecast, by country
- 7.6.5.1. Saudi Arabia
- 7.6.5.1.1. Market size and forecast, by Waste Type
- 7.6.5.1.2. Market size and forecast, by Method
- 7.6.5.1.3. Market size and forecast, by Source
- 7.6.5.2. UAE
- 7.6.5.2.1. Market size and forecast, by Waste Type
- 7.6.5.2.2. Market size and forecast, by Method
- 7.6.5.2.3. Market size and forecast, by Source
- 7.6.5.3. South Africa
- 7.6.5.3.1. Market size and forecast, by Waste Type
- 7.6.5.3.2. Market size and forecast, by Method
- 7.6.5.3.3. Market size and forecast, by Source
- 7.6.5.4. Nigeria
- 7.6.5.4.1. Market size and forecast, by Waste Type
- 7.6.5.4.2. Market size and forecast, by Method
- 7.6.5.4.3. Market size and forecast, by Source
- 7.6.5.5. Rest Of MEA
- 7.6.5.5.1. Market size and forecast, by Waste Type
- 7.6.5.5.2. Market size and forecast, by Method
- 7.6.5.5.3. Market size and forecast, by Source
CHAPTER 8: COMPETITIVE LANDSCAPE
- 8.1. Introduction
- 8.2. Top winning strategies
- 8.3. Product mapping of top 10 player
- 8.4. Competitive dashboard
- 8.5. Competitive heatmap
- 8.6. Top player positioning, 2023
CHAPTER 9: COMPANY PROFILES
- 9.1. Republic Services Inc.
- 9.1.1. Company overview
- 9.1.2. Key executives
- 9.1.3. Company snapshot
- 9.1.4. Operating business segments
- 9.1.5. Product portfolio
- 9.1.6. Business performance
- 9.1.7. Key strategic moves and developments
- 9.2. Veolia Environnement S.A.
- 9.2.1. Company overview
- 9.2.2. Key executives
- 9.2.3. Company snapshot
- 9.2.4. Operating business segments
- 9.2.5. Product portfolio
- 9.2.6. Business performance
- 9.2.7. Key strategic moves and developments
- 9.3. Urbiotica, S.L.
- 9.3.1. Company overview
- 9.3.2. Key executives
- 9.3.3. Company snapshot
- 9.3.4. Operating business segments
- 9.3.5. Product portfolio
- 9.3.6. Business performance
- 9.3.7. Key strategic moves and developments
- 9.4. Ecube Labs Co Ltd
- 9.4.1. Company overview
- 9.4.2. Key executives
- 9.4.3. Company snapshot
- 9.4.4. Operating business segments
- 9.4.5. Product portfolio
- 9.4.6. Business performance
- 9.4.7. Key strategic moves and developments
- 9.5. Waste Management Inc.
- 9.5.1. Company overview
- 9.5.2. Key executives
- 9.5.3. Company snapshot
- 9.5.4. Operating business segments
- 9.5.5. Product portfolio
- 9.5.6. Business performance
- 9.5.7. Key strategic moves and developments
- 9.6. SUEZ Environmental Services.
- 9.6.1. Company overview
- 9.6.2. Key executives
- 9.6.3. Company snapshot
- 9.6.4. Operating business segments
- 9.6.5. Product portfolio
- 9.6.6. Business performance
- 9.6.7. Key strategic moves and developments
- 9.7. Enevo Oy
- 9.7.1. Company overview
- 9.7.2. Key executives
- 9.7.3. Company snapshot
- 9.7.4. Operating business segments
- 9.7.5. Product portfolio
- 9.7.6. Business performance
- 9.7.7. Key strategic moves and developments
- 9.8. Covanta Holding Corporation
- 9.8.1. Company overview
- 9.8.2. Key executives
- 9.8.3. Company snapshot
- 9.8.4. Operating business segments
- 9.8.5. Product portfolio
- 9.8.6. Business performance
- 9.8.7. Key strategic moves and developments
- 9.9. Bigbelly, Inc.
- 9.9.1. Company overview
- 9.9.2. Key executives
- 9.9.3. Company snapshot
- 9.9.4. Operating business segments
- 9.9.5. Product portfolio
- 9.9.6. Business performance
- 9.9.7. Key strategic moves and developments
- 9.10. Sensoneo j. s. a.
- 9.10.1. Company overview
- 9.10.2. Key executives
- 9.10.3. Company snapshot
- 9.10.4. Operating business segments
- 9.10.5. Product portfolio
- 9.10.6. Business performance
- 9.10.7. Key strategic moves and developments
LIST OF TABLES
- TABLE 01. GLOBAL SMART WASTE MANAGEMENT MARKET, BY WASTE TYPE, 2023-2032 ($MILLION)
- TABLE 02. SMART WASTE MANAGEMENT MARKET FOR SOLID WASTE, BY REGION, 2023-2032 ($MILLION)
- TABLE 03. SMART WASTE MANAGEMENT MARKET FOR SPECIAL WASTE, BY REGION, 2023-2032 ($MILLION)
- TABLE 04. SMART WASTE MANAGEMENT MARKET FOR E-WASTE, BY REGION, 2023-2032 ($MILLION)
- TABLE 05. GLOBAL SMART WASTE MANAGEMENT MARKET, BY METHOD, 2023-2032 ($MILLION)
- TABLE 06. SMART WASTE MANAGEMENT MARKET FOR SMART COLLECTION, BY REGION, 2023-2032 ($MILLION)
- TABLE 07. SMART WASTE MANAGEMENT MARKET FOR SMART PROCESSING, BY REGION, 2023-2032 ($MILLION)
- TABLE 08. SMART WASTE MANAGEMENT MARKET FOR SMART DISPOSAL, BY REGION, 2023-2032 ($MILLION)
- TABLE 09. GLOBAL SMART WASTE MANAGEMENT MARKET, BY SOURCE, 2023-2032 ($MILLION)
- TABLE 10. SMART WASTE MANAGEMENT MARKET FOR RESIDENTIAL, BY REGION, 2023-2032 ($MILLION)
- TABLE 11. SMART WASTE MANAGEMENT MARKET FOR COMMERCIAL, BY REGION, 2023-2032 ($MILLION)
- TABLE 12. SMART WASTE MANAGEMENT MARKET FOR INDUSTRIAL, BY REGION, 2023-2032 ($MILLION)
- TABLE 13. SMART WASTE MANAGEMENT MARKET, BY REGION, 2023-2032 ($MILLION)
- TABLE 14. NORTH AMERICA SMART WASTE MANAGEMENT MARKET, BY WASTE TYPE, 2023-2032 ($MILLION)
- TABLE 15. NORTH AMERICA SMART WASTE MANAGEMENT MARKET, BY METHOD, 2023-2032 ($MILLION)
- TABLE 16. NORTH AMERICA SMART WASTE MANAGEMENT MARKET, BY SOURCE, 2023-2032 ($MILLION)
- TABLE 17. NORTH AMERICA SMART WASTE MANAGEMENT MARKET, BY COUNTRY, 2023-2032 ($MILLION)
- TABLE 18. U.S. SMART WASTE MANAGEMENT MARKET, BY WASTE TYPE, 2023-2032 ($MILLION)
- TABLE 19. U.S. SMART WASTE MANAGEMENT MARKET, BY METHOD, 2023-2032 ($MILLION)
- TABLE 20. U.S. SMART WASTE MANAGEMENT MARKET, BY SOURCE, 2023-2032 ($MILLION)
- TABLE 21. CANADA SMART WASTE MANAGEMENT MARKET, BY WASTE TYPE, 2023-2032 ($MILLION)
- TABLE 22. CANADA SMART WASTE MANAGEMENT MARKET, BY METHOD, 2023-2032 ($MILLION)
- TABLE 23. CANADA SMART WASTE MANAGEMENT MARKET, BY SOURCE, 2023-2032 ($MILLION)
- TABLE 24. MEXICO SMART WASTE MANAGEMENT MARKET, BY WASTE TYPE, 2023-2032 ($MILLION)
- TABLE 25. MEXICO SMART WASTE MANAGEMENT MARKET, BY METHOD, 2023-2032 ($MILLION)
- TABLE 26. MEXICO SMART WASTE MANAGEMENT MARKET, BY SOURCE, 2023-2032 ($MILLION)
- TABLE 27. EUROPE SMART WASTE MANAGEMENT MARKET, BY WASTE TYPE, 2023-2032 ($MILLION)
- TABLE 28. EUROPE SMART WASTE MANAGEMENT MARKET, BY METHOD, 2023-2032 ($MILLION)
- TABLE 29. EUROPE SMART WASTE MANAGEMENT MARKET, BY SOURCE, 2023-2032 ($MILLION)
- TABLE 30. EUROPE SMART WASTE MANAGEMENT MARKET, BY COUNTRY, 2023-2032 ($MILLION)
- TABLE 31. GERMANY SMART WASTE MANAGEMENT MARKET, BY WASTE TYPE, 2023-2032 ($MILLION)
- TABLE 32. GERMANY SMART WASTE MANAGEMENT MARKET, BY METHOD, 2023-2032 ($MILLION)
- TABLE 33. GERMANY SMART WASTE MANAGEMENT MARKET, BY SOURCE, 2023-2032 ($MILLION)
- TABLE 34. FRANCE SMART WASTE MANAGEMENT MARKET, BY WASTE TYPE, 2023-2032 ($MILLION)
- TABLE 35. FRANCE SMART WASTE MANAGEMENT MARKET, BY METHOD, 2023-2032 ($MILLION)
- TABLE 36. FRANCE SMART WASTE MANAGEMENT MARKET, BY SOURCE, 2023-2032 ($MILLION)
- TABLE 37. UK SMART WASTE MANAGEMENT MARKET, BY WASTE TYPE, 2023-2032 ($MILLION)
- TABLE 38. UK SMART WASTE MANAGEMENT MARKET, BY METHOD, 2023-2032 ($MILLION)
- TABLE 39. UK SMART WASTE MANAGEMENT MARKET, BY SOURCE, 2023-2032 ($MILLION)
- TABLE 40. ITALY SMART WASTE MANAGEMENT MARKET, BY WASTE TYPE, 2023-2032 ($MILLION)
- TABLE 41. ITALY SMART WASTE MANAGEMENT MARKET, BY METHOD, 2023-2032 ($MILLION)
- TABLE 42. ITALY SMART WASTE MANAGEMENT MARKET, BY SOURCE, 2023-2032 ($MILLION)
- TABLE 43. REST OF EUROPE SMART WASTE MANAGEMENT MARKET, BY WASTE TYPE, 2023-2032 ($MILLION)
- TABLE 44. REST OF EUROPE SMART WASTE MANAGEMENT MARKET, BY METHOD, 2023-2032 ($MILLION)
- TABLE 45. REST OF EUROPE SMART WASTE MANAGEMENT MARKET, BY SOURCE, 2023-2032 ($MILLION)
- TABLE 46. ASIA-PACIFIC SMART WASTE MANAGEMENT MARKET, BY WASTE TYPE, 2023-2032 ($MILLION)
- TABLE 47. ASIA-PACIFIC SMART WASTE MANAGEMENT MARKET, BY METHOD, 2023-2032 ($MILLION)
- TABLE 48. ASIA-PACIFIC SMART WASTE MANAGEMENT MARKET, BY SOURCE, 2023-2032 ($MILLION)
- TABLE 49. ASIA-PACIFIC SMART WASTE MANAGEMENT MARKET, BY COUNTRY, 2023-2032 ($MILLION)
- TABLE 50. CHINA SMART WASTE MANAGEMENT MARKET, BY WASTE TYPE, 2023-2032 ($MILLION)
- TABLE 51. CHINA SMART WASTE MANAGEMENT MARKET, BY METHOD, 2023-2032 ($MILLION)
- TABLE 52. CHINA SMART WASTE MANAGEMENT MARKET, BY SOURCE, 2023-2032 ($MILLION)
- TABLE 53. INDIA SMART WASTE MANAGEMENT MARKET, BY WASTE TYPE, 2023-2032 ($MILLION)
- TABLE 54. INDIA SMART WASTE MANAGEMENT MARKET, BY METHOD, 2023-2032 ($MILLION)
- TABLE 55. INDIA SMART WASTE MANAGEMENT MARKET, BY SOURCE, 2023-2032 ($MILLION)
- TABLE 56. JAPAN SMART WASTE MANAGEMENT MARKET, BY WASTE TYPE, 2023-2032 ($MILLION)
- TABLE 57. JAPAN SMART WASTE MANAGEMENT MARKET, BY METHOD, 2023-2032 ($MILLION)
- TABLE 58. JAPAN SMART WASTE MANAGEMENT MARKET, BY SOURCE, 2023-2032 ($MILLION)
- TABLE 59. SOUTH KOREA SMART WASTE MANAGEMENT MARKET, BY WASTE TYPE, 2023-2032 ($MILLION)
- TABLE 60. SOUTH KOREA SMART WASTE MANAGEMENT MARKET, BY METHOD, 2023-2032 ($MILLION)
- TABLE 61. SOUTH KOREA SMART WASTE MANAGEMENT MARKET, BY SOURCE, 2023-2032 ($MILLION)
- TABLE 62. REST OF ASIA-PACIFIC SMART WASTE MANAGEMENT MARKET, BY WASTE TYPE, 2023-2032 ($MILLION)
- TABLE 63. REST OF ASIA-PACIFIC SMART WASTE MANAGEMENT MARKET, BY METHOD, 2023-2032 ($MILLION)
- TABLE 64. REST OF ASIA-PACIFIC SMART WASTE MANAGEMENT MARKET, BY SOURCE, 2023-2032 ($MILLION)
- TABLE 65. LATIN AMERICA SMART WASTE MANAGEMENT MARKET, BY WASTE TYPE, 2023-2032 ($MILLION)
- TABLE 66. LATIN AMERICA SMART WASTE MANAGEMENT MARKET, BY METHOD, 2023-2032 ($MILLION)
- TABLE 67. LATIN AMERICA SMART WASTE MANAGEMENT MARKET, BY SOURCE, 2023-2032 ($MILLION)
- TABLE 68. LATIN AMERICA SMART WASTE MANAGEMENT MARKET, BY COUNTRY, 2023-2032 ($MILLION)
- TABLE 69. BRAZIL SMART WASTE MANAGEMENT MARKET, BY WASTE TYPE, 2023-2032 ($MILLION)
- TABLE 70. BRAZIL SMART WASTE MANAGEMENT MARKET, BY METHOD, 2023-2032 ($MILLION)
- TABLE 71. BRAZIL SMART WASTE MANAGEMENT MARKET, BY SOURCE, 2023-2032 ($MILLION)
- TABLE 72. ARGENTINA SMART WASTE MANAGEMENT MARKET, BY WASTE TYPE, 2023-2032 ($MILLION)
- TABLE 73. ARGENTINA SMART WASTE MANAGEMENT MARKET, BY METHOD, 2023-2032 ($MILLION)
- TABLE 74. ARGENTINA SMART WASTE MANAGEMENT MARKET, BY SOURCE, 2023-2032 ($MILLION)
- TABLE 75. COLOMBIA SMART WASTE MANAGEMENT MARKET, BY WASTE TYPE, 2023-2032 ($MILLION)
- TABLE 76. COLOMBIA SMART WASTE MANAGEMENT MARKET, BY METHOD, 2023-2032 ($MILLION)
- TABLE 77. COLOMBIA SMART WASTE MANAGEMENT MARKET, BY SOURCE, 2023-2032 ($MILLION)
- TABLE 78. REST OF LATIN AMERICA SMART WASTE MANAGEMENT MARKET, BY WASTE TYPE, 2023-2032 ($MILLION)
- TABLE 79. REST OF LATIN AMERICA SMART WASTE MANAGEMENT MARKET, BY METHOD, 2023-2032 ($MILLION)
- TABLE 80. REST OF LATIN AMERICA SMART WASTE MANAGEMENT MARKET, BY SOURCE, 2023-2032 ($MILLION)
- TABLE 81. MIDDLE EAST AND AFRICA SMART WASTE MANAGEMENT MARKET, BY WASTE TYPE, 2023-2032 ($MILLION)
- TABLE 82. MIDDLE EAST AND AFRICA SMART WASTE MANAGEMENT MARKET, BY METHOD, 2023-2032 ($MILLION)
- TABLE 83. MIDDLE EAST AND AFRICA SMART WASTE MANAGEMENT MARKET, BY SOURCE, 2023-2032 ($MILLION)
- TABLE 84. MIDDLE EAST AND AFRICA SMART WASTE MANAGEMENT MARKET, BY COUNTRY, 2023-2032 ($MILLION)
- TABLE 85. SAUDI ARABIA SMART WASTE MANAGEMENT MARKET, BY WASTE TYPE, 2023-2032 ($MILLION)
- TABLE 86. SAUDI ARABIA SMART WASTE MANAGEMENT MARKET, BY METHOD, 2023-2032 ($MILLION)
- TABLE 87. SAUDI ARABIA SMART WASTE MANAGEMENT MARKET, BY SOURCE, 2023-2032 ($MILLION)
- TABLE 88. UAE SMART WASTE MANAGEMENT MARKET, BY WASTE TYPE, 2023-2032 ($MILLION)
- TABLE 89. UAE SMART WASTE MANAGEMENT MARKET, BY METHOD, 2023-2032 ($MILLION)
- TABLE 90. UAE SMART WASTE MANAGEMENT MARKET, BY SOURCE, 2023-2032 ($MILLION)
- TABLE 91. SOUTH AFRICA SMART WASTE MANAGEMENT MARKET, BY WASTE TYPE, 2023-2032 ($MILLION)
- TABLE 92. SOUTH AFRICA SMART WASTE MANAGEMENT MARKET, BY METHOD, 2023-2032 ($MILLION)
- TABLE 93. SOUTH AFRICA SMART WASTE MANAGEMENT MARKET, BY SOURCE, 2023-2032 ($MILLION)
- TABLE 94. NIGERIA SMART WASTE MANAGEMENT MARKET, BY WASTE TYPE, 2023-2032 ($MILLION)
- TABLE 95. NIGERIA SMART WASTE MANAGEMENT MARKET, BY METHOD, 2023-2032 ($MILLION)
- TABLE 96. NIGERIA SMART WASTE MANAGEMENT MARKET, BY SOURCE, 2023-2032 ($MILLION)
- TABLE 97. REST OF MEA SMART WASTE MANAGEMENT MARKET, BY WASTE TYPE, 2023-2032 ($MILLION)
- TABLE 98. REST OF MEA SMART WASTE MANAGEMENT MARKET, BY METHOD, 2023-2032 ($MILLION)
- TABLE 99. REST OF MEA SMART WASTE MANAGEMENT MARKET, BY SOURCE, 2023-2032 ($MILLION)
- TABLE 100. REPUBLIC SERVICES.: KEY EXECUTIVES
- TABLE 101. REPUBLIC SERVICES.: COMPANY SNAPSHOT
- TABLE 102. REPUBLIC SERVICES.: PRODUCT SEGMENTS
- TABLE 103. REPUBLIC SERVICES.: SERVICE SEGMENTS
- TABLE 104. REPUBLIC SERVICES.: PRODUCT PORTFOLIO
- TABLE 105. REPUBLIC SERVICES.: KEY STRATEGIES
- TABLE 106. VEOLIA: KEY EXECUTIVES
- TABLE 107. VEOLIA: COMPANY SNAPSHOT
- TABLE 108. VEOLIA: PRODUCT SEGMENTS
- TABLE 109. VEOLIA: SERVICE SEGMENTS
- TABLE 110. VEOLIA: PRODUCT PORTFOLIO
- TABLE 111. VEOLIA: KEY STRATEGIES
- TABLE 112. URBIOTICA.: KEY EXECUTIVES
- TABLE 113. URBIOTICA.: COMPANY SNAPSHOT
- TABLE 114. URBIOTICA.: PRODUCT SEGMENTS
- TABLE 115. URBIOTICA.: SERVICE SEGMENTS
- TABLE 116. URBIOTICA.: PRODUCT PORTFOLIO
- TABLE 117. URBIOTICA.: KEY STRATEGIES
- TABLE 118. ECUBE LABS: KEY EXECUTIVES
- TABLE 119. ECUBE LABS: COMPANY SNAPSHOT
- TABLE 120. ECUBE LABS: PRODUCT SEGMENTS
- TABLE 121. ECUBE LABS: SERVICE SEGMENTS
- TABLE 122. ECUBE LABS: PRODUCT PORTFOLIO
- TABLE 123. ECUBE LABS: KEY STRATEGIES
- TABLE 124. WM INTELLECTUAL PROPERTY HOLDINGS, L.L.C..: KEY EXECUTIVES
- TABLE 125. WM INTELLECTUAL PROPERTY HOLDINGS, L.L.C..: COMPANY SNAPSHOT
- TABLE 126. WM INTELLECTUAL PROPERTY HOLDINGS, L.L.C..: PRODUCT SEGMENTS
- TABLE 127. WM INTELLECTUAL PROPERTY HOLDINGS, L.L.C..: SERVICE SEGMENTS
- TABLE 128. WM INTELLECTUAL PROPERTY HOLDINGS, L.L.C..: PRODUCT PORTFOLIO
- TABLE 129. WM INTELLECTUAL PROPERTY HOLDINGS, L.L.C..: KEY STRATEGIES
- TABLE 130. SUEZ.: KEY EXECUTIVES
- TABLE 131. SUEZ.: COMPANY SNAPSHOT
- TABLE 132. SUEZ.: PRODUCT SEGMENTS
- TABLE 133. SUEZ.: SERVICE SEGMENTS
- TABLE 134. SUEZ.: PRODUCT PORTFOLIO
- TABLE 135. SUEZ.: KEY STRATEGIES
- TABLE 136. ENEVO INC.: KEY EXECUTIVES
- TABLE 137. ENEVO INC.: COMPANY SNAPSHOT
- TABLE 138. ENEVO INC.: PRODUCT SEGMENTS
- TABLE 139. ENEVO INC.: SERVICE SEGMENTS
- TABLE 140. ENEVO INC.: PRODUCT PORTFOLIO
- TABLE 141. ENEVO INC.: KEY STRATEGIES
- TABLE 142. COVANTA HOLDING CORPORATION: KEY EXECUTIVES
- TABLE 143. COVANTA HOLDING CORPORATION: COMPANY SNAPSHOT
- TABLE 144. COVANTA HOLDING CORPORATION: PRODUCT SEGMENTS
- TABLE 145. COVANTA HOLDING CORPORATION: SERVICE SEGMENTS
- TABLE 146. COVANTA HOLDING CORPORATION: PRODUCT PORTFOLIO
- TABLE 147. COVANTA HOLDING CORPORATION: KEY STRATEGIES
- TABLE 148. BIGBELLY.: KEY EXECUTIVES
- TABLE 149. BIGBELLY.: COMPANY SNAPSHOT
- TABLE 150. BIGBELLY.: PRODUCT SEGMENTS
- TABLE 151. BIGBELLY.: SERVICE SEGMENTS
- TABLE 152. BIGBELLY.: PRODUCT PORTFOLIO
- TABLE 153. BIGBELLY.: KEY STRATEGIES
- TABLE 154. SENSONEO.: KEY EXECUTIVES
- TABLE 155. SENSONEO.: COMPANY SNAPSHOT
- TABLE 156. SENSONEO.: PRODUCT SEGMENTS
- TABLE 157. SENSONEO.: SERVICE SEGMENTS
- TABLE 158. SENSONEO.: PRODUCT PORTFOLIO
- TABLE 159. SENSONEO.: KEY STRATEGIES
LIST OF FIGURES
- FIGURE 01. SMART WASTE MANAGEMENT MARKET, 2023-2032
- FIGURE 02. SEGMENTATION OF SMART WASTE MANAGEMENT MARKET,2023-2032
- FIGURE 03. TOP IMPACTING FACTORS IN SMART WASTE MANAGEMENT MARKET
- FIGURE 04. TOP INVESTMENT POCKETS IN SMART WASTE MANAGEMENT MARKET (2024-2032)
- FIGURE 05. BARGAINING POWER OF SUPPLIERS
- FIGURE 06. BARGAINING POWER OF BUYERS
- FIGURE 07. THREAT OF SUBSTITUTION
- FIGURE 08. THREAT OF SUBSTITUTION
- FIGURE 09. COMPETITIVE RIVALRY
- FIGURE 10. GLOBAL SMART WASTE MANAGEMENT MARKET:DRIVERS, RESTRAINTS AND OPPORTUNITIES
- FIGURE 11. SMART WASTE MANAGEMENT MARKET, BY WASTE TYPE, 2023 AND 2032(%)
- FIGURE 12. COMPARATIVE SHARE ANALYSIS OF SMART WASTE MANAGEMENT MARKET FOR SOLID WASTE, BY COUNTRY 2023 AND 2032(%)
- FIGURE 13. COMPARATIVE SHARE ANALYSIS OF SMART WASTE MANAGEMENT MARKET FOR SPECIAL WASTE, BY COUNTRY 2023 AND 2032(%)
- FIGURE 14. COMPARATIVE SHARE ANALYSIS OF SMART WASTE MANAGEMENT MARKET FOR E-WASTE, BY COUNTRY 2023 AND 2032(%)
- FIGURE 15. SMART WASTE MANAGEMENT MARKET, BY METHOD, 2023 AND 2032(%)
- FIGURE 16. COMPARATIVE SHARE ANALYSIS OF SMART WASTE MANAGEMENT MARKET FOR SMART COLLECTION, BY COUNTRY 2023 AND 2032(%)
- FIGURE 17. COMPARATIVE SHARE ANALYSIS OF SMART WASTE MANAGEMENT MARKET FOR SMART PROCESSING, BY COUNTRY 2023 AND 2032(%)
- FIGURE 18. COMPARATIVE SHARE ANALYSIS OF SMART WASTE MANAGEMENT MARKET FOR SMART DISPOSAL, BY COUNTRY 2023 AND 2032(%)
- FIGURE 19. SMART WASTE MANAGEMENT MARKET, BY SOURCE, 2023 AND 2032(%)
- FIGURE 20. COMPARATIVE SHARE ANALYSIS OF SMART WASTE MANAGEMENT MARKET FOR RESIDENTIAL, BY COUNTRY 2023 AND 2032(%)
- FIGURE 21. COMPARATIVE SHARE ANALYSIS OF SMART WASTE MANAGEMENT MARKET FOR COMMERCIAL, BY COUNTRY 2023 AND 2032(%)
- FIGURE 22. COMPARATIVE SHARE ANALYSIS OF SMART WASTE MANAGEMENT MARKET FOR INDUSTRIAL, BY COUNTRY 2023 AND 2032(%)
- FIGURE 23. SMART WASTE MANAGEMENT MARKET BY REGION, 2023 AND 2032(%)
- FIGURE 24. U.S. SMART WASTE MANAGEMENT MARKET, 2023-2032 ($MILLION)
- FIGURE 25. CANADA SMART WASTE MANAGEMENT MARKET, 2023-2032 ($MILLION)
- FIGURE 26. MEXICO SMART WASTE MANAGEMENT MARKET, 2023-2032 ($MILLION)
- FIGURE 27. GERMANY SMART WASTE MANAGEMENT MARKET, 2023-2032 ($MILLION)
- FIGURE 28. FRANCE SMART WASTE MANAGEMENT MARKET, 2023-2032 ($MILLION)
- FIGURE 29. UK SMART WASTE MANAGEMENT MARKET, 2023-2032 ($MILLION)
- FIGURE 30. ITALY SMART WASTE MANAGEMENT MARKET, 2023-2032 ($MILLION)
- FIGURE 31. REST OF EUROPE SMART WASTE MANAGEMENT MARKET, 2023-2032 ($MILLION)
- FIGURE 32. CHINA SMART WASTE MANAGEMENT MARKET, 2023-2032 ($MILLION)
- FIGURE 33. INDIA SMART WASTE MANAGEMENT MARKET, 2023-2032 ($MILLION)
- FIGURE 34. JAPAN SMART WASTE MANAGEMENT MARKET, 2023-2032 ($MILLION)
- FIGURE 35. SOUTH KOREA SMART WASTE MANAGEMENT MARKET, 2023-2032 ($MILLION)
- FIGURE 36. REST OF ASIA-PACIFIC SMART WASTE MANAGEMENT MARKET, 2023-2032 ($MILLION)
- FIGURE 37. BRAZIL SMART WASTE MANAGEMENT MARKET, 2023-2032 ($MILLION)
- FIGURE 38. ARGENTINA SMART WASTE MANAGEMENT MARKET, 2023-2032 ($MILLION)
- FIGURE 39. COLOMBIA SMART WASTE MANAGEMENT MARKET, 2023-2032 ($MILLION)
- FIGURE 40. REST OF LATIN AMERICA SMART WASTE MANAGEMENT MARKET, 2023-2032 ($MILLION)
- FIGURE 41. SAUDI ARABIA SMART WASTE MANAGEMENT MARKET, 2023-2032 ($MILLION)
- FIGURE 42. UAE SMART WASTE MANAGEMENT MARKET, 2023-2032 ($MILLION)
- FIGURE 43. SOUTH AFRICA SMART WASTE MANAGEMENT MARKET, 2023-2032 ($MILLION)
- FIGURE 44. NIGERIA SMART WASTE MANAGEMENT MARKET, 2023-2032 ($MILLION)
- FIGURE 45. REST OF MEA SMART WASTE MANAGEMENT MARKET, 2023-2032 ($MILLION)
- FIGURE 46. TOP WINNING STRATEGIES, BY YEAR
- FIGURE 47. TOP WINNING STRATEGIES, BY DEVELOPMENT
- FIGURE 48. TOP WINNING STRATEGIES, BY COMPANY
- FIGURE 49. PRODUCT MAPPING OF TOP 10 PLAYERS
- FIGURE 50. COMPETITIVE DASHBOARD
- FIGURE 51. COMPETITIVE HEATMAP: SMART WASTE MANAGEMENT MARKET
- FIGURE 52. TOP PLAYER POSITIONING, 2023

