
PUBLISHER: Allied Market Research | PRODUCT CODE: 1513336

PUBLISHER: Allied Market Research | PRODUCT CODE: 1513336
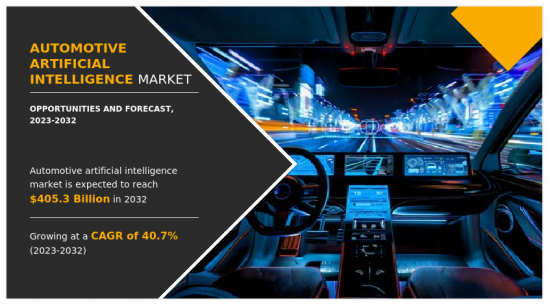
Automotive Artificial Intelligence Market By Component, By Technology, By Application : Global Opportunity Analysis and Industry Forecast, 2023-2032
The global automotive artificial intelligence market size was valued at $13.8 billion in 2022, and is projected to reach $405.3 billion by 2032, growing at a CAGR of 40.7% from 2023 to 2032.
Automotive artificial intelligence refers to the use of AI technology in automobiles to increase various aspects of the automobile system, including efficiency, safety, convenience, and to improve the overall driving experience. The automotive industry has witnessed the advent of artificial intelligence and is among the major industries that uses AI to augment and mimic the action of humans. Furthermore, emergence of modern automobile functions such as advanced driver assistance system (ADAS), adaptive cruise control (ACC), blind spot alert, autonomous driving, predictive maintenance, intelligent traffic management, and surge in demand for convenient features attract automotive manufacturers toward AI.
The automotive artificial intelligence market growth is driven by surge in demand for autonomous vehicles, growth in high-speed internet & 5G technology, and rise in demand for enhanced user experience & convenience features. However, factors such as a rise in security and privacy concerns and a stringent regulatory landscape are anticipated to hinder the market growth rate. Furthermore, the increase in demand for premium vehicles and growth in connected vehicle technology are forecasted to provide lucrative growth market growth opportunities.
In recent years, autonomous vehicles have gained popularity due to various additional features it offers such as self-driving, automatic parking, and a variety of other features. Autonomous vehicles minimize human efforts and make driving safer and more convenient. Moreover, major global companies such as Nvidia Corporation, Intel Corporation, and Tesla, Inc., have invested heavily in R&D for the development of the technology.
For instance, the Tesla, Inc. autopilot system has features such as keeping the vehicle within a lane while driving, auto changing the lanes whenever required, and self-parking, which is one of the most advanced systems available in the market currently. Moreover, autonomous vehicles are anticipated to reduce human intervention and are of vital importance in industries that have a shortage of manpower, especially in the transportation and logistics sector. This, in turn, is expected to drive the growth of the automotive artificial intelligence market.
Autonomous vehicles have made vehicle driving for consumers safe and convenient. However, there are certain threats that are faced by the manufacturers that are related to security and privacy concerns such as safety of personal data, cyber-attacks, and data breaches.
For instance, on May 12, 2023, Toyota Motor Corporation announced that due to a human error, the vehicle data of 2.15 million customers in Japan, or approximately the entire customer base that signed up for its primary cloud service platforms since 2012, had been publicly available. The data included vehicle location as well as identification numbers of vehicle devices. These types of instances of intruding on a customer's privacy are some of the major restraints in the market.
Furthermore, the demand for premium luxury vehicles is driven by a rise in global standards of living and increase in disposable income among people. It is evident that the premium automobile market has seen an increase in sales recently, and as the majority of premium cars on the road now are equipped with artificial intelligence technology, there is an enormous amount of opportunity for expansion in artificial intelligence in the automotive market. The largest manufacturers of luxury automobiles include General Motors, BMW, Honda Motor Co., Ltd., Tesla, Inc., and others are continuously focusing on development of the technology to enhance AI features in their products.
The automotive artificial intelligence market is segmented on the basis of component, technology, application, and region. On the basis of component, the market is divided into hardware, software, and services. On the basis of technology, the market is classified into machine learning & deep learning, computer vision, natural language processing, and others. By application, the global market is segregated into semi-autonomous and autonomous. On the basis of the region, the market has been analyzed across North America, Europe, Asia-Pacific, and Latin America and Middle East and Africa.
The key companies profiled in the report include Nvidia Corporation, Alphabet Inc., Intel Corporation, IBM, Microsoft Corporation, BMW AG, Uber Technologies, Inc., Tesla, Inc., Toyota Motor Corporation, AB Volvo
Key Benefits For Stakeholders
- This report provides a quantitative analysis of the market segments, current trends, estimations, and dynamics of the automotive artificial intelligence market analysis from 2022 to 2032 to identify the prevailing automotive artificial intelligence market opportunities.
- The market research is offered along with information related to key drivers, restraints, and opportunities.
- Porter's five forces analysis highlights the potency of buyers and suppliers to enable stakeholders make profit-oriented business decisions and strengthen their supplier-buyer network.
- In-depth analysis of the automotive artificial intelligence market segmentation assists to determine the prevailing market opportunities.
- Major countries in each region are mapped according to their revenue contribution to the global market.
- Market player positioning facilitates benchmarking and provides a clear understanding of the present position of the market players.
- The report includes the analysis of the regional as well as global automotive artificial intelligence market trends, key players, market segments, application areas, and market growth strategies.
Additional benefits you will get with this purchase are:
- Quarterly Update and* (only available with a corporate license, on listed price)
- 5 additional Company Profile of client Choice pre- or Post-purchase, as a free update.
- Free Upcoming Version on the Purchase of Five and Enterprise User License.
- 16 analyst hours of support* (post-purchase, if you find additional data requirements upon review of the report, you may receive support amounting to 16 analyst hours to solve questions, and post-sale queries)
- 15% Free Customization* (in case the scope or segment of the report does not match your requirements, 15% is equivalent to 3 working days of free work, applicable once)
- Free data Pack on the Five and Enterprise User License. (Excel version of the report)
- Free Updated report if the report is 6-12 months old or older.
- 24-hour priority response*
- Free Industry updates and white papers.
Possible Customization with this report (with additional cost and timeline, please talk to the sales executive to know more)
- Upcoming/New Entrant by Regions
- Go To Market Strategy
- Additional company profiles with specific to client's interest
- Additional country or region analysis- market size and forecast
- SWOT Analysis
Key Market Segments
By Component
- Hardware
- Software
- Services
By Technology
- Machine Learning and Deep Learning
- Computer Vision
- Natural Language Processing
- Others
By Application
- Semi-Autonomous
- Autonomous
By Region
- North America
- U.S.
- Canada
- Mexico
- Europe
- Germany
- France
- UK
- Spain
- Rest of Europe
- Asia-Pacific
- China
- India
- Japan
- South Korea
- Rest of Asia-Pacific
- Latin America
- Brazil
- Argentina
- Rest of Latin America
- Middle East and Africa
- GCC Countries
- South Africa
- Rest of Middle East And Africa
Key Market Players:
- Uber Technologies, Inc
- Tesla, Inc.
- Toyota Motor Corporation
- Nvidia Corporation
- Alphabet Inc
- Intel Corporation
- IBM
- Microsoft Corporation
- BMW AG
- AB Volvo
TABLE OF CONTENTS
CHAPTER 1: INTRODUCTION
- 1.1. Report Description
- 1.2. Key market segments
- 1.3. Key benefits to the stakeholders
- 1.4. Research Methodology
- 1.4.1. Primary research
- 1.4.2. Secondary research
- 1.4.3. Analyst tools and models
CHAPTER 2: EXECUTIVE SUMMARY
- 2.1. CXO perspective
CHAPTER 3: MARKET OVERVIEW
- 3.1. Market definition and scope
- 3.2. Key findings
- 3.2.1. Top impacting factors
- 3.2.2. Top investment pockets
- 3.3. Porter's Five Forces Analysis
- 3.4. Market dynamics
- 3.4.1. Drivers
- 3.4.2. Restraints
- 3.4.3. Opportunities
CHAPTER 4: AUTOMOTIVE ARTIFICIAL INTELLIGENCE MARKET, BY COMPONENT
- 4.1. Overview
- 4.1.1. Market size and forecast
- 4.2. Hardware
- 4.2.1. Key market trends, growth factors and opportunities
- 4.2.2. Market size and forecast, by region
- 4.2.3. Market share analysis by country
- 4.3. Software
- 4.3.1. Key market trends, growth factors and opportunities
- 4.3.2. Market size and forecast, by region
- 4.3.3. Market share analysis by country
- 4.4. Services
- 4.4.1. Key market trends, growth factors and opportunities
- 4.4.2. Market size and forecast, by region
- 4.4.3. Market share analysis by country
CHAPTER 5: AUTOMOTIVE ARTIFICIAL INTELLIGENCE MARKET, BY TECHNOLOGY
- 5.1. Overview
- 5.1.1. Market size and forecast
- 5.2. Machine Learning and Deep Learning
- 5.2.1. Key market trends, growth factors and opportunities
- 5.2.2. Market size and forecast, by region
- 5.2.3. Market share analysis by country
- 5.3. Computer Vision
- 5.3.1. Key market trends, growth factors and opportunities
- 5.3.2. Market size and forecast, by region
- 5.3.3. Market share analysis by country
- 5.4. Natural Language Processing
- 5.4.1. Key market trends, growth factors and opportunities
- 5.4.2. Market size and forecast, by region
- 5.4.3. Market share analysis by country
- 5.5. Others
- 5.5.1. Key market trends, growth factors and opportunities
- 5.5.2. Market size and forecast, by region
- 5.5.3. Market share analysis by country
CHAPTER 6: AUTOMOTIVE ARTIFICIAL INTELLIGENCE MARKET, BY APPLICATION
- 6.1. Overview
- 6.1.1. Market size and forecast
- 6.2. Semi-Autonomous
- 6.2.1. Key market trends, growth factors and opportunities
- 6.2.2. Market size and forecast, by region
- 6.2.3. Market share analysis by country
- 6.3. Autonomous
- 6.3.1. Key market trends, growth factors and opportunities
- 6.3.2. Market size and forecast, by region
- 6.3.3. Market share analysis by country
CHAPTER 7: AUTOMOTIVE ARTIFICIAL INTELLIGENCE MARKET, BY REGION
- 7.1. Overview
- 7.1.1. Market size and forecast By Region
- 7.2. North America
- 7.2.1. Key market trends, growth factors and opportunities
- 7.2.2. Market size and forecast, by Component
- 7.2.3. Market size and forecast, by Technology
- 7.2.4. Market size and forecast, by Application
- 7.2.5. Market size and forecast, by country
- 7.2.5.1. U.S.
- 7.2.5.1.1. Market size and forecast, by Component
- 7.2.5.1.2. Market size and forecast, by Technology
- 7.2.5.1.3. Market size and forecast, by Application
- 7.2.5.2. Canada
- 7.2.5.2.1. Market size and forecast, by Component
- 7.2.5.2.2. Market size and forecast, by Technology
- 7.2.5.2.3. Market size and forecast, by Application
- 7.2.5.3. Mexico
- 7.2.5.3.1. Market size and forecast, by Component
- 7.2.5.3.2. Market size and forecast, by Technology
- 7.2.5.3.3. Market size and forecast, by Application
- 7.3. Europe
- 7.3.1. Key market trends, growth factors and opportunities
- 7.3.2. Market size and forecast, by Component
- 7.3.3. Market size and forecast, by Technology
- 7.3.4. Market size and forecast, by Application
- 7.3.5. Market size and forecast, by country
- 7.3.5.1. Germany
- 7.3.5.1.1. Market size and forecast, by Component
- 7.3.5.1.2. Market size and forecast, by Technology
- 7.3.5.1.3. Market size and forecast, by Application
- 7.3.5.2. France
- 7.3.5.2.1. Market size and forecast, by Component
- 7.3.5.2.2. Market size and forecast, by Technology
- 7.3.5.2.3. Market size and forecast, by Application
- 7.3.5.3. UK
- 7.3.5.3.1. Market size and forecast, by Component
- 7.3.5.3.2. Market size and forecast, by Technology
- 7.3.5.3.3. Market size and forecast, by Application
- 7.3.5.4. Spain
- 7.3.5.4.1. Market size and forecast, by Component
- 7.3.5.4.2. Market size and forecast, by Technology
- 7.3.5.4.3. Market size and forecast, by Application
- 7.3.5.5. Rest of Europe
- 7.3.5.5.1. Market size and forecast, by Component
- 7.3.5.5.2. Market size and forecast, by Technology
- 7.3.5.5.3. Market size and forecast, by Application
- 7.4. Asia-Pacific
- 7.4.1. Key market trends, growth factors and opportunities
- 7.4.2. Market size and forecast, by Component
- 7.4.3. Market size and forecast, by Technology
- 7.4.4. Market size and forecast, by Application
- 7.4.5. Market size and forecast, by country
- 7.4.5.1. China
- 7.4.5.1.1. Market size and forecast, by Component
- 7.4.5.1.2. Market size and forecast, by Technology
- 7.4.5.1.3. Market size and forecast, by Application
- 7.4.5.2. India
- 7.4.5.2.1. Market size and forecast, by Component
- 7.4.5.2.2. Market size and forecast, by Technology
- 7.4.5.2.3. Market size and forecast, by Application
- 7.4.5.3. Japan
- 7.4.5.3.1. Market size and forecast, by Component
- 7.4.5.3.2. Market size and forecast, by Technology
- 7.4.5.3.3. Market size and forecast, by Application
- 7.4.5.4. South Korea
- 7.4.5.4.1. Market size and forecast, by Component
- 7.4.5.4.2. Market size and forecast, by Technology
- 7.4.5.4.3. Market size and forecast, by Application
- 7.4.5.5. Rest of Asia-Pacific
- 7.4.5.5.1. Market size and forecast, by Component
- 7.4.5.5.2. Market size and forecast, by Technology
- 7.4.5.5.3. Market size and forecast, by Application
- 7.5. Latin America
- 7.5.1. Key market trends, growth factors and opportunities
- 7.5.2. Market size and forecast, by Component
- 7.5.3. Market size and forecast, by Technology
- 7.5.4. Market size and forecast, by Application
- 7.5.5. Market size and forecast, by country
- 7.5.5.1. Brazil
- 7.5.5.1.1. Market size and forecast, by Component
- 7.5.5.1.2. Market size and forecast, by Technology
- 7.5.5.1.3. Market size and forecast, by Application
- 7.5.5.2. Argentina
- 7.5.5.2.1. Market size and forecast, by Component
- 7.5.5.2.2. Market size and forecast, by Technology
- 7.5.5.2.3. Market size and forecast, by Application
- 7.5.5.3. Rest of Latin America
- 7.5.5.3.1. Market size and forecast, by Component
- 7.5.5.3.2. Market size and forecast, by Technology
- 7.5.5.3.3. Market size and forecast, by Application
- 7.6. Middle East and Africa
- 7.6.1. Key market trends, growth factors and opportunities
- 7.6.2. Market size and forecast, by Component
- 7.6.3. Market size and forecast, by Technology
- 7.6.4. Market size and forecast, by Application
- 7.6.5. Market size and forecast, by country
- 7.6.5.1. GCC Countries
- 7.6.5.1.1. Market size and forecast, by Component
- 7.6.5.1.2. Market size and forecast, by Technology
- 7.6.5.1.3. Market size and forecast, by Application
- 7.6.5.2. South Africa
- 7.6.5.2.1. Market size and forecast, by Component
- 7.6.5.2.2. Market size and forecast, by Technology
- 7.6.5.2.3. Market size and forecast, by Application
- 7.6.5.3. Rest of Middle East And Africa
- 7.6.5.3.1. Market size and forecast, by Component
- 7.6.5.3.2. Market size and forecast, by Technology
- 7.6.5.3.3. Market size and forecast, by Application
CHAPTER 8: COMPETITIVE LANDSCAPE
- 8.1. Introduction
- 8.2. Top winning strategies
- 8.3. Product mapping of top 10 player
- 8.4. Competitive dashboard
- 8.5. Competitive heatmap
- 8.6. Top player positioning, 2022
CHAPTER 9: COMPANY PROFILES
- 9.1. Nvidia Corporation
- 9.1.1. Company overview
- 9.1.2. Key executives
- 9.1.3. Company snapshot
- 9.1.4. Operating business segments
- 9.1.5. Product portfolio
- 9.1.6. Business performance
- 9.1.7. Key strategic moves and developments
- 9.2. Alphabet Inc
- 9.2.1. Company overview
- 9.2.2. Key executives
- 9.2.3. Company snapshot
- 9.2.4. Operating business segments
- 9.2.5. Product portfolio
- 9.2.6. Business performance
- 9.2.7. Key strategic moves and developments
- 9.3. Intel Corporation
- 9.3.1. Company overview
- 9.3.2. Key executives
- 9.3.3. Company snapshot
- 9.3.4. Operating business segments
- 9.3.5. Product portfolio
- 9.3.6. Business performance
- 9.3.7. Key strategic moves and developments
- 9.4. IBM
- 9.4.1. Company overview
- 9.4.2. Key executives
- 9.4.3. Company snapshot
- 9.4.4. Operating business segments
- 9.4.5. Product portfolio
- 9.4.6. Business performance
- 9.4.7. Key strategic moves and developments
- 9.5. Microsoft Corporation
- 9.5.1. Company overview
- 9.5.2. Key executives
- 9.5.3. Company snapshot
- 9.5.4. Operating business segments
- 9.5.5. Product portfolio
- 9.5.6. Business performance
- 9.5.7. Key strategic moves and developments
- 9.6. BMW AG
- 9.6.1. Company overview
- 9.6.2. Key executives
- 9.6.3. Company snapshot
- 9.6.4. Operating business segments
- 9.6.5. Product portfolio
- 9.6.6. Business performance
- 9.6.7. Key strategic moves and developments
- 9.7. Uber Technologies, Inc
- 9.7.1. Company overview
- 9.7.2. Key executives
- 9.7.3. Company snapshot
- 9.7.4. Operating business segments
- 9.7.5. Product portfolio
- 9.7.6. Business performance
- 9.7.7. Key strategic moves and developments
- 9.8. Tesla, Inc.
- 9.8.1. Company overview
- 9.8.2. Key executives
- 9.8.3. Company snapshot
- 9.8.4. Operating business segments
- 9.8.5. Product portfolio
- 9.8.6. Business performance
- 9.8.7. Key strategic moves and developments
- 9.9. Toyota Motor Corporation
- 9.9.1. Company overview
- 9.9.2. Key executives
- 9.9.3. Company snapshot
- 9.9.4. Operating business segments
- 9.9.5. Product portfolio
- 9.9.6. Business performance
- 9.9.7. Key strategic moves and developments
- 9.10. AB Volvo
- 9.10.1. Company overview
- 9.10.2. Key executives
- 9.10.3. Company snapshot
- 9.10.4. Operating business segments
- 9.10.5. Product portfolio
- 9.10.6. Business performance
- 9.10.7. Key strategic moves and developments
LIST OF TABLES
- TABLE 01. GLOBAL AUTOMOTIVE ARTIFICIAL INTELLIGENCE MARKET, BY COMPONENT, 2022-2032 ($MILLION)
- TABLE 02. AUTOMOTIVE ARTIFICIAL INTELLIGENCE MARKET FOR HARDWARE, BY REGION, 2022-2032 ($MILLION)
- TABLE 03. AUTOMOTIVE ARTIFICIAL INTELLIGENCE MARKET FOR SOFTWARE, BY REGION, 2022-2032 ($MILLION)
- TABLE 04. AUTOMOTIVE ARTIFICIAL INTELLIGENCE MARKET FOR SERVICES, BY REGION, 2022-2032 ($MILLION)
- TABLE 05. GLOBAL AUTOMOTIVE ARTIFICIAL INTELLIGENCE MARKET, BY TECHNOLOGY, 2022-2032 ($MILLION)
- TABLE 06. AUTOMOTIVE ARTIFICIAL INTELLIGENCE MARKET FOR MACHINE LEARNING AND DEEP LEARNING, BY REGION, 2022-2032 ($MILLION)
- TABLE 07. AUTOMOTIVE ARTIFICIAL INTELLIGENCE MARKET FOR COMPUTER VISION, BY REGION, 2022-2032 ($MILLION)
- TABLE 08. AUTOMOTIVE ARTIFICIAL INTELLIGENCE MARKET FOR NATURAL LANGUAGE PROCESSING, BY REGION, 2022-2032 ($MILLION)
- TABLE 09. AUTOMOTIVE ARTIFICIAL INTELLIGENCE MARKET FOR OTHERS, BY REGION, 2022-2032 ($MILLION)
- TABLE 10. GLOBAL AUTOMOTIVE ARTIFICIAL INTELLIGENCE MARKET, BY APPLICATION, 2022-2032 ($MILLION)
- TABLE 11. AUTOMOTIVE ARTIFICIAL INTELLIGENCE MARKET FOR SEMI-AUTONOMOUS, BY REGION, 2022-2032 ($MILLION)
- TABLE 12. AUTOMOTIVE ARTIFICIAL INTELLIGENCE MARKET FOR AUTONOMOUS, BY REGION, 2022-2032 ($MILLION)
- TABLE 13. AUTOMOTIVE ARTIFICIAL INTELLIGENCE MARKET, BY REGION, 2022-2032 ($MILLION)
- TABLE 14. NORTH AMERICA AUTOMOTIVE ARTIFICIAL INTELLIGENCE MARKET, BY COMPONENT, 2022-2032 ($MILLION)
- TABLE 15. NORTH AMERICA AUTOMOTIVE ARTIFICIAL INTELLIGENCE MARKET, BY TECHNOLOGY, 2022-2032 ($MILLION)
- TABLE 16. NORTH AMERICA AUTOMOTIVE ARTIFICIAL INTELLIGENCE MARKET, BY APPLICATION, 2022-2032 ($MILLION)
- TABLE 17. NORTH AMERICA AUTOMOTIVE ARTIFICIAL INTELLIGENCE MARKET, BY COUNTRY, 2022-2032 ($MILLION)
- TABLE 18. U.S. AUTOMOTIVE ARTIFICIAL INTELLIGENCE MARKET, BY COMPONENT, 2022-2032 ($MILLION)
- TABLE 19. U.S. AUTOMOTIVE ARTIFICIAL INTELLIGENCE MARKET, BY TECHNOLOGY, 2022-2032 ($MILLION)
- TABLE 20. U.S. AUTOMOTIVE ARTIFICIAL INTELLIGENCE MARKET, BY APPLICATION, 2022-2032 ($MILLION)
- TABLE 21. CANADA AUTOMOTIVE ARTIFICIAL INTELLIGENCE MARKET, BY COMPONENT, 2022-2032 ($MILLION)
- TABLE 22. CANADA AUTOMOTIVE ARTIFICIAL INTELLIGENCE MARKET, BY TECHNOLOGY, 2022-2032 ($MILLION)
- TABLE 23. CANADA AUTOMOTIVE ARTIFICIAL INTELLIGENCE MARKET, BY APPLICATION, 2022-2032 ($MILLION)
- TABLE 24. MEXICO AUTOMOTIVE ARTIFICIAL INTELLIGENCE MARKET, BY COMPONENT, 2022-2032 ($MILLION)
- TABLE 25. MEXICO AUTOMOTIVE ARTIFICIAL INTELLIGENCE MARKET, BY TECHNOLOGY, 2022-2032 ($MILLION)
- TABLE 26. MEXICO AUTOMOTIVE ARTIFICIAL INTELLIGENCE MARKET, BY APPLICATION, 2022-2032 ($MILLION)
- TABLE 27. EUROPE AUTOMOTIVE ARTIFICIAL INTELLIGENCE MARKET, BY COMPONENT, 2022-2032 ($MILLION)
- TABLE 28. EUROPE AUTOMOTIVE ARTIFICIAL INTELLIGENCE MARKET, BY TECHNOLOGY, 2022-2032 ($MILLION)
- TABLE 29. EUROPE AUTOMOTIVE ARTIFICIAL INTELLIGENCE MARKET, BY APPLICATION, 2022-2032 ($MILLION)
- TABLE 30. EUROPE AUTOMOTIVE ARTIFICIAL INTELLIGENCE MARKET, BY COUNTRY, 2022-2032 ($MILLION)
- TABLE 31. GERMANY AUTOMOTIVE ARTIFICIAL INTELLIGENCE MARKET, BY COMPONENT, 2022-2032 ($MILLION)
- TABLE 32. GERMANY AUTOMOTIVE ARTIFICIAL INTELLIGENCE MARKET, BY TECHNOLOGY, 2022-2032 ($MILLION)
- TABLE 33. GERMANY AUTOMOTIVE ARTIFICIAL INTELLIGENCE MARKET, BY APPLICATION, 2022-2032 ($MILLION)
- TABLE 34. FRANCE AUTOMOTIVE ARTIFICIAL INTELLIGENCE MARKET, BY COMPONENT, 2022-2032 ($MILLION)
- TABLE 35. FRANCE AUTOMOTIVE ARTIFICIAL INTELLIGENCE MARKET, BY TECHNOLOGY, 2022-2032 ($MILLION)
- TABLE 36. FRANCE AUTOMOTIVE ARTIFICIAL INTELLIGENCE MARKET, BY APPLICATION, 2022-2032 ($MILLION)
- TABLE 37. UK AUTOMOTIVE ARTIFICIAL INTELLIGENCE MARKET, BY COMPONENT, 2022-2032 ($MILLION)
- TABLE 38. UK AUTOMOTIVE ARTIFICIAL INTELLIGENCE MARKET, BY TECHNOLOGY, 2022-2032 ($MILLION)
- TABLE 39. UK AUTOMOTIVE ARTIFICIAL INTELLIGENCE MARKET, BY APPLICATION, 2022-2032 ($MILLION)
- TABLE 40. SPAIN AUTOMOTIVE ARTIFICIAL INTELLIGENCE MARKET, BY COMPONENT, 2022-2032 ($MILLION)
- TABLE 41. SPAIN AUTOMOTIVE ARTIFICIAL INTELLIGENCE MARKET, BY TECHNOLOGY, 2022-2032 ($MILLION)
- TABLE 42. SPAIN AUTOMOTIVE ARTIFICIAL INTELLIGENCE MARKET, BY APPLICATION, 2022-2032 ($MILLION)
- TABLE 43. REST OF EUROPE AUTOMOTIVE ARTIFICIAL INTELLIGENCE MARKET, BY COMPONENT, 2022-2032 ($MILLION)
- TABLE 44. REST OF EUROPE AUTOMOTIVE ARTIFICIAL INTELLIGENCE MARKET, BY TECHNOLOGY, 2022-2032 ($MILLION)
- TABLE 45. REST OF EUROPE AUTOMOTIVE ARTIFICIAL INTELLIGENCE MARKET, BY APPLICATION, 2022-2032 ($MILLION)
- TABLE 46. ASIA-PACIFIC AUTOMOTIVE ARTIFICIAL INTELLIGENCE MARKET, BY COMPONENT, 2022-2032 ($MILLION)
- TABLE 47. ASIA-PACIFIC AUTOMOTIVE ARTIFICIAL INTELLIGENCE MARKET, BY TECHNOLOGY, 2022-2032 ($MILLION)
- TABLE 48. ASIA-PACIFIC AUTOMOTIVE ARTIFICIAL INTELLIGENCE MARKET, BY APPLICATION, 2022-2032 ($MILLION)
- TABLE 49. ASIA-PACIFIC AUTOMOTIVE ARTIFICIAL INTELLIGENCE MARKET, BY COUNTRY, 2022-2032 ($MILLION)
- TABLE 50. CHINA AUTOMOTIVE ARTIFICIAL INTELLIGENCE MARKET, BY COMPONENT, 2022-2032 ($MILLION)
- TABLE 51. CHINA AUTOMOTIVE ARTIFICIAL INTELLIGENCE MARKET, BY TECHNOLOGY, 2022-2032 ($MILLION)
- TABLE 52. CHINA AUTOMOTIVE ARTIFICIAL INTELLIGENCE MARKET, BY APPLICATION, 2022-2032 ($MILLION)
- TABLE 53. INDIA AUTOMOTIVE ARTIFICIAL INTELLIGENCE MARKET, BY COMPONENT, 2022-2032 ($MILLION)
- TABLE 54. INDIA AUTOMOTIVE ARTIFICIAL INTELLIGENCE MARKET, BY TECHNOLOGY, 2022-2032 ($MILLION)
- TABLE 55. INDIA AUTOMOTIVE ARTIFICIAL INTELLIGENCE MARKET, BY APPLICATION, 2022-2032 ($MILLION)
- TABLE 56. JAPAN AUTOMOTIVE ARTIFICIAL INTELLIGENCE MARKET, BY COMPONENT, 2022-2032 ($MILLION)
- TABLE 57. JAPAN AUTOMOTIVE ARTIFICIAL INTELLIGENCE MARKET, BY TECHNOLOGY, 2022-2032 ($MILLION)
- TABLE 58. JAPAN AUTOMOTIVE ARTIFICIAL INTELLIGENCE MARKET, BY APPLICATION, 2022-2032 ($MILLION)
- TABLE 59. SOUTH KOREA AUTOMOTIVE ARTIFICIAL INTELLIGENCE MARKET, BY COMPONENT, 2022-2032 ($MILLION)
- TABLE 60. SOUTH KOREA AUTOMOTIVE ARTIFICIAL INTELLIGENCE MARKET, BY TECHNOLOGY, 2022-2032 ($MILLION)
- TABLE 61. SOUTH KOREA AUTOMOTIVE ARTIFICIAL INTELLIGENCE MARKET, BY APPLICATION, 2022-2032 ($MILLION)
- TABLE 62. REST OF ASIA-PACIFIC AUTOMOTIVE ARTIFICIAL INTELLIGENCE MARKET, BY COMPONENT, 2022-2032 ($MILLION)
- TABLE 63. REST OF ASIA-PACIFIC AUTOMOTIVE ARTIFICIAL INTELLIGENCE MARKET, BY TECHNOLOGY, 2022-2032 ($MILLION)
- TABLE 64. REST OF ASIA-PACIFIC AUTOMOTIVE ARTIFICIAL INTELLIGENCE MARKET, BY APPLICATION, 2022-2032 ($MILLION)
- TABLE 65. LATIN AMERICA AUTOMOTIVE ARTIFICIAL INTELLIGENCE MARKET, BY COMPONENT, 2022-2032 ($MILLION)
- TABLE 66. LATIN AMERICA AUTOMOTIVE ARTIFICIAL INTELLIGENCE MARKET, BY TECHNOLOGY, 2022-2032 ($MILLION)
- TABLE 67. LATIN AMERICA AUTOMOTIVE ARTIFICIAL INTELLIGENCE MARKET, BY APPLICATION, 2022-2032 ($MILLION)
- TABLE 68. LATIN AMERICA AUTOMOTIVE ARTIFICIAL INTELLIGENCE MARKET, BY COUNTRY, 2022-2032 ($MILLION)
- TABLE 69. BRAZIL AUTOMOTIVE ARTIFICIAL INTELLIGENCE MARKET, BY COMPONENT, 2022-2032 ($MILLION)
- TABLE 70. BRAZIL AUTOMOTIVE ARTIFICIAL INTELLIGENCE MARKET, BY TECHNOLOGY, 2022-2032 ($MILLION)
- TABLE 71. BRAZIL AUTOMOTIVE ARTIFICIAL INTELLIGENCE MARKET, BY APPLICATION, 2022-2032 ($MILLION)
- TABLE 72. ARGENTINA AUTOMOTIVE ARTIFICIAL INTELLIGENCE MARKET, BY COMPONENT, 2022-2032 ($MILLION)
- TABLE 73. ARGENTINA AUTOMOTIVE ARTIFICIAL INTELLIGENCE MARKET, BY TECHNOLOGY, 2022-2032 ($MILLION)
- TABLE 74. ARGENTINA AUTOMOTIVE ARTIFICIAL INTELLIGENCE MARKET, BY APPLICATION, 2022-2032 ($MILLION)
- TABLE 75. REST OF LATIN AMERICA AUTOMOTIVE ARTIFICIAL INTELLIGENCE MARKET, BY COMPONENT, 2022-2032 ($MILLION)
- TABLE 76. REST OF LATIN AMERICA AUTOMOTIVE ARTIFICIAL INTELLIGENCE MARKET, BY TECHNOLOGY, 2022-2032 ($MILLION)
- TABLE 77. REST OF LATIN AMERICA AUTOMOTIVE ARTIFICIAL INTELLIGENCE MARKET, BY APPLICATION, 2022-2032 ($MILLION)
- TABLE 78. MIDDLE EAST AND AFRICA AUTOMOTIVE ARTIFICIAL INTELLIGENCE MARKET, BY COMPONENT, 2022-2032 ($MILLION)
- TABLE 79. MIDDLE EAST AND AFRICA AUTOMOTIVE ARTIFICIAL INTELLIGENCE MARKET, BY TECHNOLOGY, 2022-2032 ($MILLION)
- TABLE 80. MIDDLE EAST AND AFRICA AUTOMOTIVE ARTIFICIAL INTELLIGENCE MARKET, BY APPLICATION, 2022-2032 ($MILLION)
- TABLE 81. MIDDLE EAST AND AFRICA AUTOMOTIVE ARTIFICIAL INTELLIGENCE MARKET, BY COUNTRY, 2022-2032 ($MILLION)
- TABLE 82. GCC COUNTRIES AUTOMOTIVE ARTIFICIAL INTELLIGENCE MARKET, BY COMPONENT, 2022-2032 ($MILLION)
- TABLE 83. GCC COUNTRIES AUTOMOTIVE ARTIFICIAL INTELLIGENCE MARKET, BY TECHNOLOGY, 2022-2032 ($MILLION)
- TABLE 84. GCC COUNTRIES AUTOMOTIVE ARTIFICIAL INTELLIGENCE MARKET, BY APPLICATION, 2022-2032 ($MILLION)
- TABLE 85. SOUTH AFRICA AUTOMOTIVE ARTIFICIAL INTELLIGENCE MARKET, BY COMPONENT, 2022-2032 ($MILLION)
- TABLE 86. SOUTH AFRICA AUTOMOTIVE ARTIFICIAL INTELLIGENCE MARKET, BY TECHNOLOGY, 2022-2032 ($MILLION)
- TABLE 87. SOUTH AFRICA AUTOMOTIVE ARTIFICIAL INTELLIGENCE MARKET, BY APPLICATION, 2022-2032 ($MILLION)
- TABLE 88. REST OF MIDDLE EAST AND AFRICA AUTOMOTIVE ARTIFICIAL INTELLIGENCE MARKET, BY COMPONENT, 2022-2032 ($MILLION)
- TABLE 89. REST OF MIDDLE EAST AND AFRICA AUTOMOTIVE ARTIFICIAL INTELLIGENCE MARKET, BY TECHNOLOGY, 2022-2032 ($MILLION)
- TABLE 90. REST OF MIDDLE EAST AND AFRICA AUTOMOTIVE ARTIFICIAL INTELLIGENCE MARKET, BY APPLICATION, 2022-2032 ($MILLION)
- TABLE 91. NVIDIA CORPORATION: KEY EXECUTIVES
- TABLE 92. NVIDIA CORPORATION: COMPANY SNAPSHOT
- TABLE 93. NVIDIA CORPORATION: PRODUCT SEGMENTS
- TABLE 94. NVIDIA CORPORATION: SERVICE SEGMENTS
- TABLE 95. NVIDIA CORPORATION: PRODUCT PORTFOLIO
- TABLE 96. NVIDIA CORPORATION: KEY STRATEGIES
- TABLE 97. ALPHABET INC: KEY EXECUTIVES
- TABLE 98. ALPHABET INC: COMPANY SNAPSHOT
- TABLE 99. ALPHABET INC: PRODUCT SEGMENTS
- TABLE 100. ALPHABET INC: SERVICE SEGMENTS
- TABLE 101. ALPHABET INC: PRODUCT PORTFOLIO
- TABLE 102. ALPHABET INC: KEY STRATEGIES
- TABLE 103. INTEL CORPORATION: KEY EXECUTIVES
- TABLE 104. INTEL CORPORATION: COMPANY SNAPSHOT
- TABLE 105. INTEL CORPORATION: PRODUCT SEGMENTS
- TABLE 106. INTEL CORPORATION: SERVICE SEGMENTS
- TABLE 107. INTEL CORPORATION: PRODUCT PORTFOLIO
- TABLE 108. INTEL CORPORATION: KEY STRATEGIES
- TABLE 109. IBM: KEY EXECUTIVES
- TABLE 110. IBM: COMPANY SNAPSHOT
- TABLE 111. IBM: PRODUCT SEGMENTS
- TABLE 112. IBM: SERVICE SEGMENTS
- TABLE 113. IBM: PRODUCT PORTFOLIO
- TABLE 114. IBM: KEY STRATEGIES
- TABLE 115. MICROSOFT CORPORATION: KEY EXECUTIVES
- TABLE 116. MICROSOFT CORPORATION: COMPANY SNAPSHOT
- TABLE 117. MICROSOFT CORPORATION: PRODUCT SEGMENTS
- TABLE 118. MICROSOFT CORPORATION: SERVICE SEGMENTS
- TABLE 119. MICROSOFT CORPORATION: PRODUCT PORTFOLIO
- TABLE 120. MICROSOFT CORPORATION: KEY STRATEGIES
- TABLE 121. BMW AG: KEY EXECUTIVES
- TABLE 122. BMW AG: COMPANY SNAPSHOT
- TABLE 123. BMW AG: PRODUCT SEGMENTS
- TABLE 124. BMW AG: SERVICE SEGMENTS
- TABLE 125. BMW AG: PRODUCT PORTFOLIO
- TABLE 126. BMW AG: KEY STRATEGIES
- TABLE 127. UBER TECHNOLOGIES, INC: KEY EXECUTIVES
- TABLE 128. UBER TECHNOLOGIES, INC: COMPANY SNAPSHOT
- TABLE 129. UBER TECHNOLOGIES, INC: PRODUCT SEGMENTS
- TABLE 130. UBER TECHNOLOGIES, INC: SERVICE SEGMENTS
- TABLE 131. UBER TECHNOLOGIES, INC: PRODUCT PORTFOLIO
- TABLE 132. UBER TECHNOLOGIES, INC: KEY STRATEGIES
- TABLE 133. TESLA, INC.: KEY EXECUTIVES
- TABLE 134. TESLA, INC.: COMPANY SNAPSHOT
- TABLE 135. TESLA, INC.: PRODUCT SEGMENTS
- TABLE 136. TESLA, INC.: SERVICE SEGMENTS
- TABLE 137. TESLA, INC.: PRODUCT PORTFOLIO
- TABLE 138. TESLA, INC.: KEY STRATEGIES
- TABLE 139. TOYOTA MOTOR CORPORATION: KEY EXECUTIVES
- TABLE 140. TOYOTA MOTOR CORPORATION: COMPANY SNAPSHOT
- TABLE 141. TOYOTA MOTOR CORPORATION: PRODUCT SEGMENTS
- TABLE 142. TOYOTA MOTOR CORPORATION: SERVICE SEGMENTS
- TABLE 143. TOYOTA MOTOR CORPORATION: PRODUCT PORTFOLIO
- TABLE 144. TOYOTA MOTOR CORPORATION: KEY STRATEGIES
- TABLE 145. AB VOLVO: KEY EXECUTIVES
- TABLE 146. AB VOLVO: COMPANY SNAPSHOT
- TABLE 147. AB VOLVO: PRODUCT SEGMENTS
- TABLE 148. AB VOLVO: SERVICE SEGMENTS
- TABLE 149. AB VOLVO: PRODUCT PORTFOLIO
- TABLE 150. AB VOLVO: KEY STRATEGIES
LIST OF FIGURES
- FIGURE 01. AUTOMOTIVE ARTIFICIAL INTELLIGENCE MARKET, 2022-2032
- FIGURE 02. SEGMENTATION OF AUTOMOTIVE ARTIFICIAL INTELLIGENCE MARKET,2022-2032
- FIGURE 03. TOP IMPACTING FACTORS IN AUTOMOTIVE ARTIFICIAL INTELLIGENCE MARKET
- FIGURE 04. TOP INVESTMENT POCKETS IN AUTOMOTIVE ARTIFICIAL INTELLIGENCE MARKET (2023-2032)
- FIGURE 05. BARGAINING POWER OF SUPPLIERS
- FIGURE 06. BARGAINING POWER OF BUYERS
- FIGURE 07. THREAT OF SUBSTITUTION
- FIGURE 08. THREAT OF SUBSTITUTION
- FIGURE 09. COMPETITIVE RIVALRY
- FIGURE 10. GLOBAL AUTOMOTIVE ARTIFICIAL INTELLIGENCE MARKET:DRIVERS, RESTRAINTS AND OPPORTUNITIES
- FIGURE 11. AUTOMOTIVE ARTIFICIAL INTELLIGENCE MARKET, BY COMPONENT, 2022 AND 2032(%)
- FIGURE 12. COMPARATIVE SHARE ANALYSIS OF AUTOMOTIVE ARTIFICIAL INTELLIGENCE MARKET FOR HARDWARE, BY COUNTRY 2022 AND 2032(%)
- FIGURE 13. COMPARATIVE SHARE ANALYSIS OF AUTOMOTIVE ARTIFICIAL INTELLIGENCE MARKET FOR SOFTWARE, BY COUNTRY 2022 AND 2032(%)
- FIGURE 14. COMPARATIVE SHARE ANALYSIS OF AUTOMOTIVE ARTIFICIAL INTELLIGENCE MARKET FOR SERVICES, BY COUNTRY 2022 AND 2032(%)
- FIGURE 15. AUTOMOTIVE ARTIFICIAL INTELLIGENCE MARKET, BY TECHNOLOGY, 2022 AND 2032(%)
- FIGURE 16. COMPARATIVE SHARE ANALYSIS OF AUTOMOTIVE ARTIFICIAL INTELLIGENCE MARKET FOR MACHINE LEARNING AND DEEP LEARNING, BY COUNTRY 2022 AND 2032(%)
- FIGURE 17. COMPARATIVE SHARE ANALYSIS OF AUTOMOTIVE ARTIFICIAL INTELLIGENCE MARKET FOR COMPUTER VISION, BY COUNTRY 2022 AND 2032(%)
- FIGURE 18. COMPARATIVE SHARE ANALYSIS OF AUTOMOTIVE ARTIFICIAL INTELLIGENCE MARKET FOR NATURAL LANGUAGE PROCESSING, BY COUNTRY 2022 AND 2032(%)
- FIGURE 19. COMPARATIVE SHARE ANALYSIS OF AUTOMOTIVE ARTIFICIAL INTELLIGENCE MARKET FOR OTHERS, BY COUNTRY 2022 AND 2032(%)
- FIGURE 20. AUTOMOTIVE ARTIFICIAL INTELLIGENCE MARKET, BY APPLICATION, 2022 AND 2032(%)
- FIGURE 21. COMPARATIVE SHARE ANALYSIS OF AUTOMOTIVE ARTIFICIAL INTELLIGENCE MARKET FOR SEMI-AUTONOMOUS, BY COUNTRY 2022 AND 2032(%)
- FIGURE 22. COMPARATIVE SHARE ANALYSIS OF AUTOMOTIVE ARTIFICIAL INTELLIGENCE MARKET FOR AUTONOMOUS, BY COUNTRY 2022 AND 2032(%)
- FIGURE 23. AUTOMOTIVE ARTIFICIAL INTELLIGENCE MARKET BY REGION, 2022 AND 2032(%)
- FIGURE 24. U.S. AUTOMOTIVE ARTIFICIAL INTELLIGENCE MARKET, 2022-2032 ($MILLION)
- FIGURE 25. CANADA AUTOMOTIVE ARTIFICIAL INTELLIGENCE MARKET, 2022-2032 ($MILLION)
- FIGURE 26. MEXICO AUTOMOTIVE ARTIFICIAL INTELLIGENCE MARKET, 2022-2032 ($MILLION)
- FIGURE 27. GERMANY AUTOMOTIVE ARTIFICIAL INTELLIGENCE MARKET, 2022-2032 ($MILLION)
- FIGURE 28. FRANCE AUTOMOTIVE ARTIFICIAL INTELLIGENCE MARKET, 2022-2032 ($MILLION)
- FIGURE 29. UK AUTOMOTIVE ARTIFICIAL INTELLIGENCE MARKET, 2022-2032 ($MILLION)
- FIGURE 30. SPAIN AUTOMOTIVE ARTIFICIAL INTELLIGENCE MARKET, 2022-2032 ($MILLION)
- FIGURE 31. REST OF EUROPE AUTOMOTIVE ARTIFICIAL INTELLIGENCE MARKET, 2022-2032 ($MILLION)
- FIGURE 32. CHINA AUTOMOTIVE ARTIFICIAL INTELLIGENCE MARKET, 2022-2032 ($MILLION)
- FIGURE 33. INDIA AUTOMOTIVE ARTIFICIAL INTELLIGENCE MARKET, 2022-2032 ($MILLION)
- FIGURE 34. JAPAN AUTOMOTIVE ARTIFICIAL INTELLIGENCE MARKET, 2022-2032 ($MILLION)
- FIGURE 35. SOUTH KOREA AUTOMOTIVE ARTIFICIAL INTELLIGENCE MARKET, 2022-2032 ($MILLION)
- FIGURE 36. REST OF ASIA-PACIFIC AUTOMOTIVE ARTIFICIAL INTELLIGENCE MARKET, 2022-2032 ($MILLION)
- FIGURE 37. BRAZIL AUTOMOTIVE ARTIFICIAL INTELLIGENCE MARKET, 2022-2032 ($MILLION)
- FIGURE 38. ARGENTINA AUTOMOTIVE ARTIFICIAL INTELLIGENCE MARKET, 2022-2032 ($MILLION)
- FIGURE 39. REST OF LATIN AMERICA AUTOMOTIVE ARTIFICIAL INTELLIGENCE MARKET, 2022-2032 ($MILLION)
- FIGURE 40. GCC COUNTRIES AUTOMOTIVE ARTIFICIAL INTELLIGENCE MARKET, 2022-2032 ($MILLION)
- FIGURE 41. SOUTH AFRICA AUTOMOTIVE ARTIFICIAL INTELLIGENCE MARKET, 2022-2032 ($MILLION)
- FIGURE 42. REST OF MIDDLE EAST AND AFRICA AUTOMOTIVE ARTIFICIAL INTELLIGENCE MARKET, 2022-2032 ($MILLION)
- FIGURE 43. TOP WINNING STRATEGIES, BY YEAR
- FIGURE 44. TOP WINNING STRATEGIES, BY DEVELOPMENT
- FIGURE 45. TOP WINNING STRATEGIES, BY COMPANY
- FIGURE 46. PRODUCT MAPPING OF TOP 10 PLAYERS
- FIGURE 47. COMPETITIVE DASHBOARD
- FIGURE 48. COMPETITIVE HEATMAP: AUTOMOTIVE ARTIFICIAL INTELLIGENCE MARKET
- FIGURE 49. TOP PLAYER POSITIONING, 2022

