
PUBLISHER: Allied Market Research | PRODUCT CODE: 1513325

PUBLISHER: Allied Market Research | PRODUCT CODE: 1513325
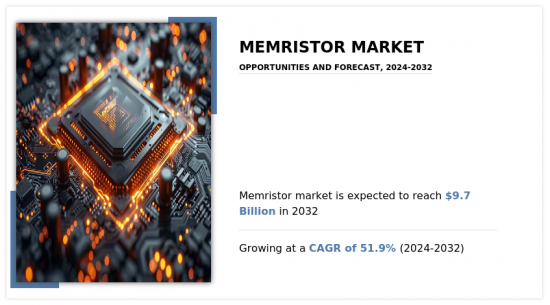
Memristor Market By Type, By Industry Vertical : Global Opportunity Analysis and Industry Forecast, 2024-2032
A memristor is an electrical component that limits or regulates the flow of electrical current in a circuit and remembers the amount of charge that has previously flowed through it. Memristors are important as they are non-volatile, which means that they retain memory without power.
Rise in demand for industrial robots serves as a significant driving force for the memristor market. As industries increasingly adopt automation to enhance efficiency, productivity, and flexibility in manufacturing processes, the need for high-performance memory solutions becomes crucial. Memristors offer distinct advantages for industrial robot applications, including fast data processing, low power consumption, and non-volatile memory capabilities. These features are essential for supporting the complex computational tasks and real-time decision-making requirements of industrial robots, enabling them to operate seamlessly in dynamic production environments. Moreover, as industrial robots become more sophisticated and intelligent, incorporating AI and machine learning algorithms for tasks such as predictive maintenance and adaptive control, the demand for memristors as fundamental components of these advanced robotic systems is expected to grow, thus driving expansion and innovation in the memristor market.
However, high deployment cost serves as a significant restraint for the memristor market. While memristors offer compelling benefits such as fast data processing, low power consumption, and non-volatile memory, the initial investment required for their deployment can be prohibitive. This high cost includes various aspects, such as R&D expenses, manufacturing costs, and others. In addition, specialized expertise and infrastructure are often needed for Memristor deployment, further adding to the overall cost. As a result, businesses and industries may hesitate to adopt memristor technology, especially when more affordable alternatives are available. Thus, the high deployment cost hinders the widespread adoption of memristors across various applications and industries.
However, rise in demand for neural networks presents a notable opportunity for the memristor market. With neural networks gaining prominence in diverse domains such as artificial intelligence and pattern recognition, there is a growing necessity for efficient hardware solutions capable of supporting complex computations. Memristors offer distinctive advantages for neural network applications, including their capacity to replicate synaptic behavior and enable parallel processing. This positions them favorably for applications in neuromorphic computing and AI accelerators, where they can notably enhance performance and energy efficiency. Furthermore, memristors' non-volatile memory features ensure data reliability, which is crucial for the dependable operation of neural networks. The memristor market is segmented on the basis of type, industry vertical, and region. On the basis of type, the market is divided into molecular & ionic thin film memristors, and spin and magnetic memristors. On the basis of industry vertical, the market is classified into consumer electronics, IT and telecom, automotive, healthcare, and others.
Region-wise, it is analyzed across North America (the U.S., Canada, and Mexico), Europe (the UK, Germany, France, Italy, and the rest of Europe), Asia-Pacific (China, Japan, India, South Korea, and rest of Asia-Pacific), Latin America (Brazil, Argentina, and rest of Latin America), and Middle East and Africa (UAE, Saudi Arabia, Qatar, South Africa, and rest of Middle East & Africa).
The key players profiled in the report include, Crossbar Inc., Panasonic Corporation, 4DS Memory Limited, Micron Technologies Inc., Samsung Group, Sony Corporation, Intel Corporation, IBM Corporation, SK Hynix Inc., and Toshiba Corp. These key players have adopted strategies such as product portfolio expansion, mergers & acquisitions, agreements, geographical expansion, and collaborations to enhance their market penetration.
Key Benefits For Stakeholders
- This report provides a quantitative analysis of the market segments, current trends, estimations, and dynamics of the memristor market analysis from 2023 to 2032 to identify the prevailing memristor market opportunities.
- The market research is offered along with information related to key drivers, restraints, and opportunities.
- Porter's five forces analysis highlights the potency of buyers and suppliers to enable stakeholders make profit-oriented business decisions and strengthen their supplier-buyer network.
- In-depth analysis of the memristor market segmentation assists to determine the prevailing market opportunities.
- Major countries in each region are mapped according to their revenue contribution to the global market.
- Market player positioning facilitates benchmarking and provides a clear understanding of the present position of the market players.
- The report includes the analysis of the regional as well as global memristor market trends, key players, market segments, application areas, and market growth strategies.
Additional benefits you will get with this purchase are:
- Quarterly Update and* (only available with a corporate license, on listed price)
- 5 additional Company Profile of client Choice pre- or Post-purchase, as a free update.
- Free Upcoming Version on the Purchase of Five and Enterprise User License.
- 16 analyst hours of support* (post-purchase, if you find additional data requirements upon review of the report, you may receive support amounting to 16 analyst hours to solve questions, and post-sale queries)
- 15% Free Customization* (in case the scope or segment of the report does not match your requirements, 15% is equivalent to 3 working days of free work, applicable once)
- Free data Pack on the Five and Enterprise User License. (Excel version of the report)
- Free Updated report if the report is 6-12 months old or older.
- 24-hour priority response*
- Free Industry updates and white papers.
Possible Customization with this report (with additional cost and timeline, please talk to the sales executive to know more)
- Product Life Cycle
- New Product Development/ Product Matrix of Key Players
- Additional company profiles with specific to client's interest
- Additional country or region analysis- market size and forecast
- Key player details (including location, contact details, supplier/vendor network etc. in excel format)
- Market share analysis of players at global/region/country level
- SWOT Analysis
Key Market Segments
By Type
- Molecular and Ionic thin film memristors
- Spin and magnetic memristors
By Industry Vertical
- Consumer Electronics
- IT and Telecommunication
- Automotive
- Healthcare
- Others
By Region
- North America
- U.S.
- Canada
- Mexico
- Europe
- Germany
- UK
- France
- Italy
- Rest of Europe
- Asia-Pacific
- China
- Japan
- India
- South Korea
- Rest of Asia-Pacific
- Latin America
- Brazil
- Argentina
- Rest of Latin America
- Middle East and Africa
- UAE
- Saudi Arabia
- Qatar
- Rest of Middle East And Africa
Key Market Players:
- Crossbar Inc.
- Panasonic Corporation
- 4DS Memory Limited
- Micron Technologies Inc
- Samsung Group
- Sony Corporation
- Intel Corporation
- IBM Corporation
- SK HYNIX INC.
- Toshiba Corp
TABLE OF CONTENTS
CHAPTER 1: INTRODUCTION
- 1.1. Report description
- 1.2. Key market segments
- 1.3. Key benefits to the stakeholders
- 1.4. Research methodology
- 1.4.1. Primary research
- 1.4.2. Secondary research
- 1.4.3. Analyst tools and models
CHAPTER 2: EXECUTIVE SUMMARY
- 2.1. CXO perspective
CHAPTER 3: MARKET OVERVIEW
- 3.1. Market definition and scope
- 3.2. Key findings
- 3.2.1. Top impacting factors
- 3.2.2. Top investment pockets
- 3.3. Porter's five forces analysis
- 3.4. Market dynamics
- 3.4.1. Drivers
- 3.4.2. Restraints
- 3.4.3. Opportunities
CHAPTER 4: MEMRISTOR MARKET, BY TYPE
- 4.1. Overview
- 4.1.1. Market size and forecast
- 4.2. Molecular and Ionic thin film memristors
- 4.2.1. Key market trends, growth factors and opportunities
- 4.2.2. Market size and forecast, by region
- 4.2.3. Market share analysis by country
- 4.3. Spin and magnetic memristors
- 4.3.1. Key market trends, growth factors and opportunities
- 4.3.2. Market size and forecast, by region
- 4.3.3. Market share analysis by country
CHAPTER 5: MEMRISTOR MARKET, BY INDUSTRY VERTICAL
- 5.1. Overview
- 5.1.1. Market size and forecast
- 5.2. Consumer Electronics
- 5.2.1. Key market trends, growth factors and opportunities
- 5.2.2. Market size and forecast, by region
- 5.2.3. Market share analysis by country
- 5.3. IT and Telecommunication
- 5.3.1. Key market trends, growth factors and opportunities
- 5.3.2. Market size and forecast, by region
- 5.3.3. Market share analysis by country
- 5.4. Automotive
- 5.4.1. Key market trends, growth factors and opportunities
- 5.4.2. Market size and forecast, by region
- 5.4.3. Market share analysis by country
- 5.5. Healthcare
- 5.5.1. Key market trends, growth factors and opportunities
- 5.5.2. Market size and forecast, by region
- 5.5.3. Market share analysis by country
- 5.6. Others
- 5.6.1. Key market trends, growth factors and opportunities
- 5.6.2. Market size and forecast, by region
- 5.6.3. Market share analysis by country
CHAPTER 6: MEMRISTOR MARKET, BY REGION
- 6.1. Overview
- 6.1.1. Market size and forecast By Region
- 6.2. North America
- 6.2.1. Key market trends, growth factors and opportunities
- 6.2.2. Market size and forecast, by Type
- 6.2.3. Market size and forecast, by Industry Vertical
- 6.2.4. Market size and forecast, by country
- 6.2.4.1. U.S.
- 6.2.4.1.1. Market size and forecast, by Type
- 6.2.4.1.2. Market size and forecast, by Industry Vertical
- 6.2.4.2. Canada
- 6.2.4.2.1. Market size and forecast, by Type
- 6.2.4.2.2. Market size and forecast, by Industry Vertical
- 6.2.4.3. Mexico
- 6.2.4.3.1. Market size and forecast, by Type
- 6.2.4.3.2. Market size and forecast, by Industry Vertical
- 6.3. Europe
- 6.3.1. Key market trends, growth factors and opportunities
- 6.3.2. Market size and forecast, by Type
- 6.3.3. Market size and forecast, by Industry Vertical
- 6.3.4. Market size and forecast, by country
- 6.3.4.1. Germany
- 6.3.4.1.1. Market size and forecast, by Type
- 6.3.4.1.2. Market size and forecast, by Industry Vertical
- 6.3.4.2. UK
- 6.3.4.2.1. Market size and forecast, by Type
- 6.3.4.2.2. Market size and forecast, by Industry Vertical
- 6.3.4.3. France
- 6.3.4.3.1. Market size and forecast, by Type
- 6.3.4.3.2. Market size and forecast, by Industry Vertical
- 6.3.4.4. Italy
- 6.3.4.4.1. Market size and forecast, by Type
- 6.3.4.4.2. Market size and forecast, by Industry Vertical
- 6.3.4.5. Rest of Europe
- 6.3.4.5.1. Market size and forecast, by Type
- 6.3.4.5.2. Market size and forecast, by Industry Vertical
- 6.4. Asia-Pacific
- 6.4.1. Key market trends, growth factors and opportunities
- 6.4.2. Market size and forecast, by Type
- 6.4.3. Market size and forecast, by Industry Vertical
- 6.4.4. Market size and forecast, by country
- 6.4.4.1. China
- 6.4.4.1.1. Market size and forecast, by Type
- 6.4.4.1.2. Market size and forecast, by Industry Vertical
- 6.4.4.2. Japan
- 6.4.4.2.1. Market size and forecast, by Type
- 6.4.4.2.2. Market size and forecast, by Industry Vertical
- 6.4.4.3. India
- 6.4.4.3.1. Market size and forecast, by Type
- 6.4.4.3.2. Market size and forecast, by Industry Vertical
- 6.4.4.4. South Korea
- 6.4.4.4.1. Market size and forecast, by Type
- 6.4.4.4.2. Market size and forecast, by Industry Vertical
- 6.4.4.5. Rest of Asia-Pacific
- 6.4.4.5.1. Market size and forecast, by Type
- 6.4.4.5.2. Market size and forecast, by Industry Vertical
- 6.5. Latin America
- 6.5.1. Key market trends, growth factors and opportunities
- 6.5.2. Market size and forecast, by Type
- 6.5.3. Market size and forecast, by Industry Vertical
- 6.5.4. Market size and forecast, by country
- 6.5.4.1. Brazil
- 6.5.4.1.1. Market size and forecast, by Type
- 6.5.4.1.2. Market size and forecast, by Industry Vertical
- 6.5.4.2. Argentina
- 6.5.4.2.1. Market size and forecast, by Type
- 6.5.4.2.2. Market size and forecast, by Industry Vertical
- 6.5.4.3. Rest of Latin America
- 6.5.4.3.1. Market size and forecast, by Type
- 6.5.4.3.2. Market size and forecast, by Industry Vertical
- 6.6. Middle East and Africa
- 6.6.1. Key market trends, growth factors and opportunities
- 6.6.2. Market size and forecast, by Type
- 6.6.3. Market size and forecast, by Industry Vertical
- 6.6.4. Market size and forecast, by country
- 6.6.4.1. UAE
- 6.6.4.1.1. Market size and forecast, by Type
- 6.6.4.1.2. Market size and forecast, by Industry Vertical
- 6.6.4.2. Saudi Arabia
- 6.6.4.2.1. Market size and forecast, by Type
- 6.6.4.2.2. Market size and forecast, by Industry Vertical
- 6.6.4.3. Qatar
- 6.6.4.3.1. Market size and forecast, by Type
- 6.6.4.3.2. Market size and forecast, by Industry Vertical
- 6.6.4.4. Rest of Middle East And Africa
- 6.6.4.4.1. Market size and forecast, by Type
- 6.6.4.4.2. Market size and forecast, by Industry Vertical
CHAPTER 7: COMPETITIVE LANDSCAPE
- 7.1. Introduction
- 7.2. Top winning strategies
- 7.3. Product mapping of top 10 player
- 7.4. Competitive dashboard
- 7.5. Competitive heatmap
- 7.6. Top player positioning, 2023
CHAPTER 8: COMPANY PROFILES
- 8.1. Crossbar Inc.
- 8.1.1. Company overview
- 8.1.2. Key executives
- 8.1.3. Company snapshot
- 8.1.4. Operating business segments
- 8.1.5. Product portfolio
- 8.1.6. Business performance
- 8.1.7. Key strategic moves and developments
- 8.2. Panasonic Corporation
- 8.2.1. Company overview
- 8.2.2. Key executives
- 8.2.3. Company snapshot
- 8.2.4. Operating business segments
- 8.2.5. Product portfolio
- 8.2.6. Business performance
- 8.2.7. Key strategic moves and developments
- 8.3. 4DS Memory Limited
- 8.3.1. Company overview
- 8.3.2. Key executives
- 8.3.3. Company snapshot
- 8.3.4. Operating business segments
- 8.3.5. Product portfolio
- 8.3.6. Business performance
- 8.3.7. Key strategic moves and developments
- 8.4. Micron Technologies Inc
- 8.4.1. Company overview
- 8.4.2. Key executives
- 8.4.3. Company snapshot
- 8.4.4. Operating business segments
- 8.4.5. Product portfolio
- 8.4.6. Business performance
- 8.4.7. Key strategic moves and developments
- 8.5. Samsung Group
- 8.5.1. Company overview
- 8.5.2. Key executives
- 8.5.3. Company snapshot
- 8.5.4. Operating business segments
- 8.5.5. Product portfolio
- 8.5.6. Business performance
- 8.5.7. Key strategic moves and developments
- 8.6. Sony Corporation
- 8.6.1. Company overview
- 8.6.2. Key executives
- 8.6.3. Company snapshot
- 8.6.4. Operating business segments
- 8.6.5. Product portfolio
- 8.6.6. Business performance
- 8.6.7. Key strategic moves and developments
- 8.7. Intel Corporation
- 8.7.1. Company overview
- 8.7.2. Key executives
- 8.7.3. Company snapshot
- 8.7.4. Operating business segments
- 8.7.5. Product portfolio
- 8.7.6. Business performance
- 8.7.7. Key strategic moves and developments
- 8.8. IBM Corporation
- 8.8.1. Company overview
- 8.8.2. Key executives
- 8.8.3. Company snapshot
- 8.8.4. Operating business segments
- 8.8.5. Product portfolio
- 8.8.6. Business performance
- 8.8.7. Key strategic moves and developments
- 8.9. SK HYNIX INC.
- 8.9.1. Company overview
- 8.9.2. Key executives
- 8.9.3. Company snapshot
- 8.9.4. Operating business segments
- 8.9.5. Product portfolio
- 8.9.6. Business performance
- 8.9.7. Key strategic moves and developments
- 8.10. Toshiba Corp
- 8.10.1. Company overview
- 8.10.2. Key executives
- 8.10.3. Company snapshot
- 8.10.4. Operating business segments
- 8.10.5. Product portfolio
- 8.10.6. Business performance
- 8.10.7. Key strategic moves and developments
LIST OF TABLES
- TABLE 01. GLOBAL MEMRISTOR MARKET, BY TYPE, 2023-2032 ($MILLION)
- TABLE 02. MEMRISTOR MARKET FOR MOLECULAR AND IONIC THIN FILM MEMRISTORS, BY REGION, 2023-2032 ($MILLION)
- TABLE 03. MEMRISTOR MARKET FOR SPIN AND MAGNETIC MEMRISTORS, BY REGION, 2023-2032 ($MILLION)
- TABLE 04. GLOBAL MEMRISTOR MARKET, BY INDUSTRY VERTICAL, 2023-2032 ($MILLION)
- TABLE 05. MEMRISTOR MARKET FOR CONSUMER ELECTRONICS, BY REGION, 2023-2032 ($MILLION)
- TABLE 06. MEMRISTOR MARKET FOR IT AND TELECOMMUNICATION, BY REGION, 2023-2032 ($MILLION)
- TABLE 07. MEMRISTOR MARKET FOR AUTOMOTIVE, BY REGION, 2023-2032 ($MILLION)
- TABLE 08. MEMRISTOR MARKET FOR HEALTHCARE, BY REGION, 2023-2032 ($MILLION)
- TABLE 09. MEMRISTOR MARKET FOR OTHERS, BY REGION, 2023-2032 ($MILLION)
- TABLE 10. MEMRISTOR MARKET, BY REGION, 2023-2032 ($MILLION)
- TABLE 11. NORTH AMERICA MEMRISTOR MARKET, BY TYPE, 2023-2032 ($MILLION)
- TABLE 12. NORTH AMERICA MEMRISTOR MARKET, BY INDUSTRY VERTICAL, 2023-2032 ($MILLION)
- TABLE 13. NORTH AMERICA MEMRISTOR MARKET, BY COUNTRY, 2023-2032 ($MILLION)
- TABLE 14. U.S. MEMRISTOR MARKET, BY TYPE, 2023-2032 ($MILLION)
- TABLE 15. U.S. MEMRISTOR MARKET, BY INDUSTRY VERTICAL, 2023-2032 ($MILLION)
- TABLE 16. CANADA MEMRISTOR MARKET, BY TYPE, 2023-2032 ($MILLION)
- TABLE 17. CANADA MEMRISTOR MARKET, BY INDUSTRY VERTICAL, 2023-2032 ($MILLION)
- TABLE 18. MEXICO MEMRISTOR MARKET, BY TYPE, 2023-2032 ($MILLION)
- TABLE 19. MEXICO MEMRISTOR MARKET, BY INDUSTRY VERTICAL, 2023-2032 ($MILLION)
- TABLE 20. EUROPE MEMRISTOR MARKET, BY TYPE, 2023-2032 ($MILLION)
- TABLE 21. EUROPE MEMRISTOR MARKET, BY INDUSTRY VERTICAL, 2023-2032 ($MILLION)
- TABLE 22. EUROPE MEMRISTOR MARKET, BY COUNTRY, 2023-2032 ($MILLION)
- TABLE 23. GERMANY MEMRISTOR MARKET, BY TYPE, 2023-2032 ($MILLION)
- TABLE 24. GERMANY MEMRISTOR MARKET, BY INDUSTRY VERTICAL, 2023-2032 ($MILLION)
- TABLE 25. UK MEMRISTOR MARKET, BY TYPE, 2023-2032 ($MILLION)
- TABLE 26. UK MEMRISTOR MARKET, BY INDUSTRY VERTICAL, 2023-2032 ($MILLION)
- TABLE 27. FRANCE MEMRISTOR MARKET, BY TYPE, 2023-2032 ($MILLION)
- TABLE 28. FRANCE MEMRISTOR MARKET, BY INDUSTRY VERTICAL, 2023-2032 ($MILLION)
- TABLE 29. ITALY MEMRISTOR MARKET, BY TYPE, 2023-2032 ($MILLION)
- TABLE 30. ITALY MEMRISTOR MARKET, BY INDUSTRY VERTICAL, 2023-2032 ($MILLION)
- TABLE 31. REST OF EUROPE MEMRISTOR MARKET, BY TYPE, 2023-2032 ($MILLION)
- TABLE 32. REST OF EUROPE MEMRISTOR MARKET, BY INDUSTRY VERTICAL, 2023-2032 ($MILLION)
- TABLE 33. ASIA-PACIFIC MEMRISTOR MARKET, BY TYPE, 2023-2032 ($MILLION)
- TABLE 34. ASIA-PACIFIC MEMRISTOR MARKET, BY INDUSTRY VERTICAL, 2023-2032 ($MILLION)
- TABLE 35. ASIA-PACIFIC MEMRISTOR MARKET, BY COUNTRY, 2023-2032 ($MILLION)
- TABLE 36. CHINA MEMRISTOR MARKET, BY TYPE, 2023-2032 ($MILLION)
- TABLE 37. CHINA MEMRISTOR MARKET, BY INDUSTRY VERTICAL, 2023-2032 ($MILLION)
- TABLE 38. JAPAN MEMRISTOR MARKET, BY TYPE, 2023-2032 ($MILLION)
- TABLE 39. JAPAN MEMRISTOR MARKET, BY INDUSTRY VERTICAL, 2023-2032 ($MILLION)
- TABLE 40. INDIA MEMRISTOR MARKET, BY TYPE, 2023-2032 ($MILLION)
- TABLE 41. INDIA MEMRISTOR MARKET, BY INDUSTRY VERTICAL, 2023-2032 ($MILLION)
- TABLE 42. SOUTH KOREA MEMRISTOR MARKET, BY TYPE, 2023-2032 ($MILLION)
- TABLE 43. SOUTH KOREA MEMRISTOR MARKET, BY INDUSTRY VERTICAL, 2023-2032 ($MILLION)
- TABLE 44. REST OF ASIA-PACIFIC MEMRISTOR MARKET, BY TYPE, 2023-2032 ($MILLION)
- TABLE 45. REST OF ASIA-PACIFIC MEMRISTOR MARKET, BY INDUSTRY VERTICAL, 2023-2032 ($MILLION)
- TABLE 46. LATIN AMERICA MEMRISTOR MARKET, BY TYPE, 2023-2032 ($MILLION)
- TABLE 47. LATIN AMERICA MEMRISTOR MARKET, BY INDUSTRY VERTICAL, 2023-2032 ($MILLION)
- TABLE 48. LATIN AMERICA MEMRISTOR MARKET, BY COUNTRY, 2023-2032 ($MILLION)
- TABLE 49. BRAZIL MEMRISTOR MARKET, BY TYPE, 2023-2032 ($MILLION)
- TABLE 50. BRAZIL MEMRISTOR MARKET, BY INDUSTRY VERTICAL, 2023-2032 ($MILLION)
- TABLE 51. ARGENTINA MEMRISTOR MARKET, BY TYPE, 2023-2032 ($MILLION)
- TABLE 52. ARGENTINA MEMRISTOR MARKET, BY INDUSTRY VERTICAL, 2023-2032 ($MILLION)
- TABLE 53. REST OF LATIN AMERICA MEMRISTOR MARKET, BY TYPE, 2023-2032 ($MILLION)
- TABLE 54. REST OF LATIN AMERICA MEMRISTOR MARKET, BY INDUSTRY VERTICAL, 2023-2032 ($MILLION)
- TABLE 55. MIDDLE EAST AND AFRICA MEMRISTOR MARKET, BY TYPE, 2023-2032 ($MILLION)
- TABLE 56. MIDDLE EAST AND AFRICA MEMRISTOR MARKET, BY INDUSTRY VERTICAL, 2023-2032 ($MILLION)
- TABLE 57. MIDDLE EAST AND AFRICA MEMRISTOR MARKET, BY COUNTRY, 2023-2032 ($MILLION)
- TABLE 58. UAE MEMRISTOR MARKET, BY TYPE, 2023-2032 ($MILLION)
- TABLE 59. UAE MEMRISTOR MARKET, BY INDUSTRY VERTICAL, 2023-2032 ($MILLION)
- TABLE 60. SAUDI ARABIA MEMRISTOR MARKET, BY TYPE, 2023-2032 ($MILLION)
- TABLE 61. SAUDI ARABIA MEMRISTOR MARKET, BY INDUSTRY VERTICAL, 2023-2032 ($MILLION)
- TABLE 62. QATAR MEMRISTOR MARKET, BY TYPE, 2023-2032 ($MILLION)
- TABLE 63. QATAR MEMRISTOR MARKET, BY INDUSTRY VERTICAL, 2023-2032 ($MILLION)
- TABLE 64. REST OF MIDDLE EAST AND AFRICA MEMRISTOR MARKET, BY TYPE, 2023-2032 ($MILLION)
- TABLE 65. REST OF MIDDLE EAST AND AFRICA MEMRISTOR MARKET, BY INDUSTRY VERTICAL, 2023-2032 ($MILLION)
- TABLE 66. CROSSBAR INC.: KEY EXECUTIVES
- TABLE 67. CROSSBAR INC.: COMPANY SNAPSHOT
- TABLE 68. CROSSBAR INC.: PRODUCT SEGMENTS
- TABLE 69. CROSSBAR INC.: SERVICE SEGMENTS
- TABLE 70. CROSSBAR INC.: PRODUCT PORTFOLIO
- TABLE 71. CROSSBAR INC.: KEY STRATEGIES
- TABLE 72. PANASONIC CORPORATION: KEY EXECUTIVES
- TABLE 73. PANASONIC CORPORATION: COMPANY SNAPSHOT
- TABLE 74. PANASONIC CORPORATION: PRODUCT SEGMENTS
- TABLE 75. PANASONIC CORPORATION: SERVICE SEGMENTS
- TABLE 76. PANASONIC CORPORATION: PRODUCT PORTFOLIO
- TABLE 77. PANASONIC CORPORATION: KEY STRATEGIES
- TABLE 78. 4DS MEMORY LIMITED: KEY EXECUTIVES
- TABLE 79. 4DS MEMORY LIMITED: COMPANY SNAPSHOT
- TABLE 80. 4DS MEMORY LIMITED: PRODUCT SEGMENTS
- TABLE 81. 4DS MEMORY LIMITED: SERVICE SEGMENTS
- TABLE 82. 4DS MEMORY LIMITED: PRODUCT PORTFOLIO
- TABLE 83. 4DS MEMORY LIMITED: KEY STRATEGIES
- TABLE 84. MICRON TECHNOLOGIES INC: KEY EXECUTIVES
- TABLE 85. MICRON TECHNOLOGIES INC: COMPANY SNAPSHOT
- TABLE 86. MICRON TECHNOLOGIES INC: PRODUCT SEGMENTS
- TABLE 87. MICRON TECHNOLOGIES INC: SERVICE SEGMENTS
- TABLE 88. MICRON TECHNOLOGIES INC: PRODUCT PORTFOLIO
- TABLE 89. MICRON TECHNOLOGIES INC: KEY STRATEGIES
- TABLE 90. SAMSUNG GROUP: KEY EXECUTIVES
- TABLE 91. SAMSUNG GROUP: COMPANY SNAPSHOT
- TABLE 92. SAMSUNG GROUP: PRODUCT SEGMENTS
- TABLE 93. SAMSUNG GROUP: SERVICE SEGMENTS
- TABLE 94. SAMSUNG GROUP: PRODUCT PORTFOLIO
- TABLE 95. SAMSUNG GROUP: KEY STRATEGIES
- TABLE 96. Sony Corporation CORPORATION: KEY EXECUTIVES
- TABLE 97. Sony Corporation CORPORATION: COMPANY SNAPSHOT
- TABLE 98. Sony Corporation CORPORATION: PRODUCT SEGMENTS
- TABLE 99. Sony Corporation CORPORATION: SERVICE SEGMENTS
- TABLE 100. Sony Corporation CORPORATION: PRODUCT PORTFOLIO
- TABLE 101. Sony Corporation CORPORATION: KEY STRATEGIES
- TABLE 102. INTEL CORPORATION: KEY EXECUTIVES
- TABLE 103. INTEL CORPORATION: COMPANY SNAPSHOT
- TABLE 104. INTEL CORPORATION: PRODUCT SEGMENTS
- TABLE 105. INTEL CORPORATION: SERVICE SEGMENTS
- TABLE 106. INTEL CORPORATION: PRODUCT PORTFOLIO
- TABLE 107. INTEL CORPORATION: KEY STRATEGIES
- TABLE 108. IBM CORPORATION: KEY EXECUTIVES
- TABLE 109. IBM CORPORATION: COMPANY SNAPSHOT
- TABLE 110. IBM CORPORATION: PRODUCT SEGMENTS
- TABLE 111. IBM CORPORATION: SERVICE SEGMENTS
- TABLE 112. IBM CORPORATION: PRODUCT PORTFOLIO
- TABLE 113. IBM CORPORATION: KEY STRATEGIES
- TABLE 114. SK HYNIX INC.: KEY EXECUTIVES
- TABLE 115. SK HYNIX INC.: COMPANY SNAPSHOT
- TABLE 116. SK HYNIX INC.: PRODUCT SEGMENTS
- TABLE 117. SK HYNIX INC.: SERVICE SEGMENTS
- TABLE 118. SK HYNIX INC.: PRODUCT PORTFOLIO
- TABLE 119. SK HYNIX INC.: KEY STRATEGIES
- TABLE 120. TOSHIBA CORP: KEY EXECUTIVES
- TABLE 121. TOSHIBA CORP: COMPANY SNAPSHOT
- TABLE 122. TOSHIBA CORP: PRODUCT SEGMENTS
- TABLE 123. TOSHIBA CORP: SERVICE SEGMENTS
- TABLE 124. TOSHIBA CORP: PRODUCT PORTFOLIO
- TABLE 125. TOSHIBA CORP: KEY STRATEGIES
LIST OF FIGURES
- FIGURE 01. MEMRISTOR MARKET, 2023-2032
- FIGURE 02. SEGMENTATION OF MEMRISTOR MARKET,2023-2032
- FIGURE 03. TOP IMPACTING FACTORS IN MEMRISTOR MARKET
- FIGURE 04. TOP INVESTMENT POCKETS IN MEMRISTOR MARKET (2024-2032)
- FIGURE 05. BARGAINING POWER OF SUPPLIERS
- FIGURE 06. BARGAINING POWER OF BUYERS
- FIGURE 07. THREAT OF SUBSTITUTION
- FIGURE 08. THREAT OF SUBSTITUTION
- FIGURE 09. COMPETITIVE RIVALRY
- FIGURE 10. GLOBAL MEMRISTOR MARKET:DRIVERS, RESTRAINTS AND OPPORTUNITIES
- FIGURE 11. MEMRISTOR MARKET, BY TYPE, 2023 AND 2032(%)
- FIGURE 12. COMPARATIVE SHARE ANALYSIS OF MEMRISTOR MARKET FOR MOLECULAR AND IONIC THIN FILM MEMRISTORS, BY COUNTRY 2023 AND 2032(%)
- FIGURE 13. COMPARATIVE SHARE ANALYSIS OF MEMRISTOR MARKET FOR SPIN AND MAGNETIC MEMRISTORS, BY COUNTRY 2023 AND 2032(%)
- FIGURE 14. MEMRISTOR MARKET, BY INDUSTRY VERTICAL, 2023 AND 2032(%)
- FIGURE 15. COMPARATIVE SHARE ANALYSIS OF MEMRISTOR MARKET FOR CONSUMER ELECTRONICS, BY COUNTRY 2023 AND 2032(%)
- FIGURE 16. COMPARATIVE SHARE ANALYSIS OF MEMRISTOR MARKET FOR IT AND TELECOMMUNICATION, BY COUNTRY 2023 AND 2032(%)
- FIGURE 17. COMPARATIVE SHARE ANALYSIS OF MEMRISTOR MARKET FOR AUTOMOTIVE, BY COUNTRY 2023 AND 2032(%)
- FIGURE 18. COMPARATIVE SHARE ANALYSIS OF MEMRISTOR MARKET FOR HEALTHCARE, BY COUNTRY 2023 AND 2032(%)
- FIGURE 19. COMPARATIVE SHARE ANALYSIS OF MEMRISTOR MARKET FOR OTHERS, BY COUNTRY 2023 AND 2032(%)
- FIGURE 20. MEMRISTOR MARKET BY REGION, 2023 AND 2032(%)
- FIGURE 21. U.S. MEMRISTOR MARKET, 2023-2032 ($MILLION)
- FIGURE 22. CANADA MEMRISTOR MARKET, 2023-2032 ($MILLION)
- FIGURE 23. MEXICO MEMRISTOR MARKET, 2023-2032 ($MILLION)
- FIGURE 24. GERMANY MEMRISTOR MARKET, 2023-2032 ($MILLION)
- FIGURE 25. UK MEMRISTOR MARKET, 2023-2032 ($MILLION)
- FIGURE 26. FRANCE MEMRISTOR MARKET, 2023-2032 ($MILLION)
- FIGURE 27. ITALY MEMRISTOR MARKET, 2023-2032 ($MILLION)
- FIGURE 28. REST OF EUROPE MEMRISTOR MARKET, 2023-2032 ($MILLION)
- FIGURE 29. CHINA MEMRISTOR MARKET, 2023-2032 ($MILLION)
- FIGURE 30. JAPAN MEMRISTOR MARKET, 2023-2032 ($MILLION)
- FIGURE 31. INDIA MEMRISTOR MARKET, 2023-2032 ($MILLION)
- FIGURE 32. SOUTH KOREA MEMRISTOR MARKET, 2023-2032 ($MILLION)
- FIGURE 33. REST OF ASIA-PACIFIC MEMRISTOR MARKET, 2023-2032 ($MILLION)
- FIGURE 34. BRAZIL MEMRISTOR MARKET, 2023-2032 ($MILLION)
- FIGURE 35. ARGENTINA MEMRISTOR MARKET, 2023-2032 ($MILLION)
- FIGURE 36. REST OF LATIN AMERICA MEMRISTOR MARKET, 2023-2032 ($MILLION)
- FIGURE 37. UAE MEMRISTOR MARKET, 2023-2032 ($MILLION)
- FIGURE 38. SAUDI ARABIA MEMRISTOR MARKET, 2023-2032 ($MILLION)
- FIGURE 39. QATAR MEMRISTOR MARKET, 2023-2032 ($MILLION)
- FIGURE 40. REST OF MIDDLE EAST AND AFRICA MEMRISTOR MARKET, 2023-2032 ($MILLION)
- FIGURE 41. TOP WINNING STRATEGIES, BY YEAR
- FIGURE 42. TOP WINNING STRATEGIES, BY DEVELOPMENT
- FIGURE 43. TOP WINNING STRATEGIES, BY COMPANY
- FIGURE 44. PRODUCT MAPPING OF TOP 10 PLAYERS
- FIGURE 45. COMPETITIVE DASHBOARD
- FIGURE 46. COMPETITIVE HEATMAP: MEMRISTOR MARKET
- FIGURE 47. TOP PLAYER POSITIONING, 2023

