
PUBLISHER: Allied Market Research | PRODUCT CODE: 1472373

PUBLISHER: Allied Market Research | PRODUCT CODE: 1472373
Wood Pellets Biomass Boilers Market By Type (Fully Automated Biomass Boiler, Combined Heat and Power Biomass Systems, Semi-automated Industrial Biomass Boilers?, Others), By Application : Global Opportunity Analysis and Industry Forecast, 2023-2032
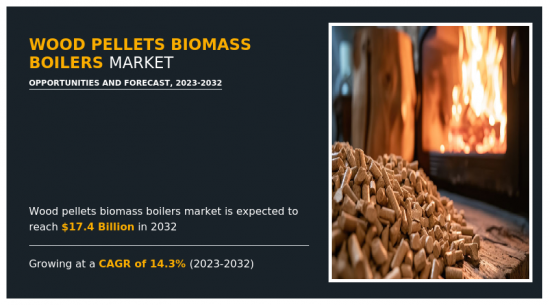
The global wood pellets biomass boilers market is anticipated to reach $17,410.2 million by 2032, growing from $4,637.0 million in 2022 at a CAGR of 14.3% from 2023 to 2032. Wood pellets biomass boilers represent a sustainable and environmentally friendly heating solution with numerous advantages. These boilers utilize renewable energy sources, such as wood pellets, which can be rapidly replenished, making them more sustainable than non-renewable fossil fuel boilers like oil. They produce less emissions compared to traditional heating systems, contributing to cleaner air and reduced carbon footprints.
Wood pellets biomass boilers exhibit versatility by providing not only heating but also on-demand hot water and electricity. They can use a primary heat source and incorporate a backup heat source, offering flexibility. In addition, their efficiency depends on factors like the type of biomass fuel, boiler size, and regular maintenance. Regular upkeep is essential, preventing issues like clogging and ensuring optimal efficiency over time. In addition, biomass boilers are considered a low-carbon option, releasing a balanced amount of carbon dioxide into the atmosphere as absorbed during plant growth. Government incentives, such as the Renewable Heat Incentive (RHI), further enhance the popularity of wood pellets biomass boilers by providing financial support to users.
One significant limitation of the wood pellets biomass boilers is the space requirement for biomass boilers. These systems are notably larger than traditional fossil fuel boilers, demanding more installation space. In addition, adequate space is crucial for the storage of biomass fuel, such as wood pellets, and it must be stored in a dry place to maintain its quality, adding another spatial consideration. Also, these boilers present labor-intensive requirements. Continuous feeding of wood into the system and regular cleaning, especially for manual biomass boilers, can be time-consuming and demanding. This aspect may deter users who seek low-maintenance heating solutions.
For commercial and industrial applications, biomass boilers offer environmental preservation benefits, cost savings, and efficiency which is predicted to generate excellent growth opportunities in the market. They demonstrate a commitment toward sustainability, making businesses leaders in eco-friendly practices. The scalability of biomass boilers makes them suitable for large-scale operations, contributing to fuel availability and security. The wood pellets biomass boilers industry supports a circular economy by utilizing organic waste materials, reducing landfill usage, and promoting waste reduction. Continuous technological advancements, such as combined heat and power (CHP) systems, enhance energy efficiency and utilization.
The key players profiled in this report include Thermax Limited, Babcock & Wilcox Enterprises, Inc., ANDRITZ, Drax, Hurst Boiler & Welding Co, Inc., Woodco, Viessmann, John Cockerill, Forbes Marshall, and Schmid AG energy solutions. The market players are continuously striving to achieve a dominant position in this competitive market using strategies such as business expansion, partnership, and acquisition.
Key Benefits For Stakeholders
- This report provides a quantitative analysis of the market segments, current trends, estimations, and dynamics of the wood pellets biomass boilers market analysis from 2022 to 2032 to identify the prevailing wood pellets biomass boilers market opportunities.
- The market research is offered along with information related to key drivers, restraints, and opportunities.
- Porter's five forces analysis highlights the potency of buyers and suppliers to enable stakeholders make profit-oriented business decisions and strengthen their supplier-buyer network.
- In-depth analysis of the wood pellets biomass boilers market segmentation assists to determine the prevailing market opportunities.
- Major countries in each region are mapped according to their revenue contribution to the global market.
- Market player positioning facilitates benchmarking and provides a clear understanding of the present position of the market players.
- The report includes the analysis of the regional as well as global wood pellets biomass boilers market trends, key players, market segments, application areas, and market growth strategies.
Additional benefits you will get with this purchase are:
- Quarterly Update and* (only available with a corporate license, on listed price)
- 5 additional Company Profile of client Choice pre- or Post-purchase, as a free update.
- Free Upcoming Version on the Purchase of Five and Enterprise User License.
- 16 analyst hours of support* (post-purchase, if you find additional data requirements upon review of the report, you may receive support amounting to 16 analyst hours to solve questions, and post-sale queries)
- 15% Free Customization* (in case the scope or segment of the report does not match your requirements, 15% is equivalent to 3 working days of free work, applicable once)
- Free data Pack on the Five and Enterprise User License. (Excel version of the report)
- Free Updated report if the report is 6-12 months old or older.
- 24-hour priority response*
- Free Industry updates and white papers.
Possible Customization with this report (with additional cost and timeline, please talk to the sales executive to know more)
- Consumer Buying Behavior Analysis
- Installed Base analysis
- Investment Opportunities
- Upcoming/New Entrant by Regions
- Technology Trend Analysis
- Go To Market Strategy
- Pain Point Analysis
- Regulatory Guidelines
- Strategic Recommendations
- Additional company profiles with specific to client's interest
- Additional country or region analysis- market size and forecast
- Brands Share Analysis
- Criss-cross segment analysis- market size and forecast
- Expanded list for Company Profiles
- Historic market data
- Key player details (including location, contact details, supplier/vendor network etc. in excel format)
- SWOT Analysis
Key Market Segments
By Type
- Fully Automated Biomass Boiler
- Combined Heat and Power (CHP) Biomass Systems
- Semi-automated Industrial Biomass Boilers
- Others
By Application
- Residential
- Commercial
By Region
- North America
- U.S.
- Canada
- Mexico
- Europe
- Germany
- UK
- France
- Italy
- Netherlands
- Rest of Europe
- Asia-Pacific
- China
- Japan
- India
- South Korea
- Australia
- Rest of Asia-Pacific
- LAMEA
- Brazil
- United Arab Emirates
- Saudi Arabia
- South Africa
- Rest of LAMEA
Key Market Players:
- Thermax Limited
- Babcock & Wilcox Enterprises, Inc.
- Andritz AG
- Drax
- Hurst Boiler & Welding Co, Inc.
- Woodco
- Viessmann
- John Cockerill
- Forbes Marshall
- Schmid AG energy solutions
TABLE OF CONTENTS
CHAPTER 1: INTRODUCTION
- 1.1. Report description
- 1.2. Key market segments
- 1.3. Key benefits to the stakeholders
- 1.4. Research methodology
- 1.4.1. Primary research
- 1.4.2. Secondary research
- 1.4.3. Analyst tools and models
CHAPTER 2: EXECUTIVE SUMMARY
- 2.1. CXO perspective
CHAPTER 3: MARKET OVERVIEW
- 3.1. Market definition and scope
- 3.2. Key findings
- 3.2.1. Top impacting factors
- 3.2.2. Top investment pockets
- 3.3. Porter's five forces analysis
- 3.4. Market dynamics
- 3.4.1. Drivers
- 3.4.2. Restraints
- 3.4.3. Opportunities
- 3.5. Market Share Analysis
- 3.6. Brand Share Analysis
- 3.7. Value Chain Analysis
- 3.8. Regulatory Guidelines
- 3.9. Patent Landscape
CHAPTER 4: WOOD PELLETS BIOMASS BOILERS MARKET, BY TYPE
- 4.1. Overview
- 4.1.1. Market size and forecast
- 4.2. Fully Automated Biomass Boiler
- 4.2.1. Key market trends, growth factors and opportunities
- 4.2.2. Market size and forecast, by region
- 4.2.3. Market share analysis by country
- 4.3. Combined Heat and Power (CHP) Biomass Systems
- 4.3.1. Key market trends, growth factors and opportunities
- 4.3.2. Market size and forecast, by region
- 4.3.3. Market share analysis by country
- 4.4. Semi-automated Industrial Biomass Boilers
- 4.4.1. Key market trends, growth factors and opportunities
- 4.4.2. Market size and forecast, by region
- 4.4.3. Market share analysis by country
- 4.5. Others
- 4.5.1. Key market trends, growth factors and opportunities
- 4.5.2. Market size and forecast, by region
- 4.5.3. Market share analysis by country
CHAPTER 5: WOOD PELLETS BIOMASS BOILERS MARKET, BY APPLICATION
- 5.1. Overview
- 5.1.1. Market size and forecast
- 5.2. Residential
- 5.2.1. Key market trends, growth factors and opportunities
- 5.2.2. Market size and forecast, by region
- 5.2.3. Market share analysis by country
- 5.3. Commercial
- 5.3.1. Key market trends, growth factors and opportunities
- 5.3.2. Market size and forecast, by region
- 5.3.3. Market share analysis by country
CHAPTER 6: WOOD PELLETS BIOMASS BOILERS MARKET, BY REGION
- 6.1. Overview
- 6.1.1. Market size and forecast By Region
- 6.2. North America
- 6.2.1. Key market trends, growth factors and opportunities
- 6.2.2. Market size and forecast, by Type
- 6.2.3. Market size and forecast, by Application
- 6.2.4. Market size and forecast, by country
- 6.2.4.1. U.S.
- 6.2.4.1.1. Market size and forecast, by Type
- 6.2.4.1.2. Market size and forecast, by Application
- 6.2.4.2. Canada
- 6.2.4.2.1. Market size and forecast, by Type
- 6.2.4.2.2. Market size and forecast, by Application
- 6.2.4.3. Mexico
- 6.2.4.3.1. Market size and forecast, by Type
- 6.2.4.3.2. Market size and forecast, by Application
- 6.3. Europe
- 6.3.1. Key market trends, growth factors and opportunities
- 6.3.2. Market size and forecast, by Type
- 6.3.3. Market size and forecast, by Application
- 6.3.4. Market size and forecast, by country
- 6.3.4.1. Germany
- 6.3.4.1.1. Market size and forecast, by Type
- 6.3.4.1.2. Market size and forecast, by Application
- 6.3.4.2. UK
- 6.3.4.2.1. Market size and forecast, by Type
- 6.3.4.2.2. Market size and forecast, by Application
- 6.3.4.3. France
- 6.3.4.3.1. Market size and forecast, by Type
- 6.3.4.3.2. Market size and forecast, by Application
- 6.3.4.4. Italy
- 6.3.4.4.1. Market size and forecast, by Type
- 6.3.4.4.2. Market size and forecast, by Application
- 6.3.4.5. Netherlands
- 6.3.4.5.1. Market size and forecast, by Type
- 6.3.4.5.2. Market size and forecast, by Application
- 6.3.4.6. Rest of Europe
- 6.3.4.6.1. Market size and forecast, by Type
- 6.3.4.6.2. Market size and forecast, by Application
- 6.4. Asia-Pacific
- 6.4.1. Key market trends, growth factors and opportunities
- 6.4.2. Market size and forecast, by Type
- 6.4.3. Market size and forecast, by Application
- 6.4.4. Market size and forecast, by country
- 6.4.4.1. China
- 6.4.4.1.1. Market size and forecast, by Type
- 6.4.4.1.2. Market size and forecast, by Application
- 6.4.4.2. Japan
- 6.4.4.2.1. Market size and forecast, by Type
- 6.4.4.2.2. Market size and forecast, by Application
- 6.4.4.3. India
- 6.4.4.3.1. Market size and forecast, by Type
- 6.4.4.3.2. Market size and forecast, by Application
- 6.4.4.4. South Korea
- 6.4.4.4.1. Market size and forecast, by Type
- 6.4.4.4.2. Market size and forecast, by Application
- 6.4.4.5. Australia
- 6.4.4.5.1. Market size and forecast, by Type
- 6.4.4.5.2. Market size and forecast, by Application
- 6.4.4.6. Rest of Asia-Pacific
- 6.4.4.6.1. Market size and forecast, by Type
- 6.4.4.6.2. Market size and forecast, by Application
- 6.5. LAMEA
- 6.5.1. Key market trends, growth factors and opportunities
- 6.5.2. Market size and forecast, by Type
- 6.5.3. Market size and forecast, by Application
- 6.5.4. Market size and forecast, by country
- 6.5.4.1. Brazil
- 6.5.4.1.1. Market size and forecast, by Type
- 6.5.4.1.2. Market size and forecast, by Application
- 6.5.4.2. United Arab Emirates
- 6.5.4.2.1. Market size and forecast, by Type
- 6.5.4.2.2. Market size and forecast, by Application
- 6.5.4.3. Saudi Arabia
- 6.5.4.3.1. Market size and forecast, by Type
- 6.5.4.3.2. Market size and forecast, by Application
- 6.5.4.4. South Africa
- 6.5.4.4.1. Market size and forecast, by Type
- 6.5.4.4.2. Market size and forecast, by Application
- 6.5.4.5. Rest of LAMEA
- 6.5.4.5.1. Market size and forecast, by Type
- 6.5.4.5.2. Market size and forecast, by Application
CHAPTER 7: COMPETITIVE LANDSCAPE
- 7.1. Introduction
- 7.2. Top winning strategies
- 7.3. Product mapping of top 10 player
- 7.4. Competitive dashboard
- 7.5. Competitive heatmap
- 7.6. Top player positioning, 2022
CHAPTER 8: COMPANY PROFILES
- 8.1. Thermax Limited
- 8.1.1. Company overview
- 8.1.2. Key executives
- 8.1.3. Company snapshot
- 8.1.4. Operating business segments
- 8.1.5. Product portfolio
- 8.1.6. Business performance
- 8.1.7. Key strategic moves and developments
- 8.2. Babcock & Wilcox Enterprises, Inc.
- 8.2.1. Company overview
- 8.2.2. Key executives
- 8.2.3. Company snapshot
- 8.2.4. Operating business segments
- 8.2.5. Product portfolio
- 8.2.6. Business performance
- 8.2.7. Key strategic moves and developments
- 8.3. Andritz AG
- 8.3.1. Company overview
- 8.3.2. Key executives
- 8.3.3. Company snapshot
- 8.3.4. Operating business segments
- 8.3.5. Product portfolio
- 8.3.6. Business performance
- 8.3.7. Key strategic moves and developments
- 8.4. Drax
- 8.4.1. Company overview
- 8.4.2. Key executives
- 8.4.3. Company snapshot
- 8.4.4. Operating business segments
- 8.4.5. Product portfolio
- 8.4.6. Business performance
- 8.4.7. Key strategic moves and developments
- 8.5. Hurst Boiler & Welding Co, Inc.
- 8.5.1. Company overview
- 8.5.2. Key executives
- 8.5.3. Company snapshot
- 8.5.4. Operating business segments
- 8.5.5. Product portfolio
- 8.5.6. Business performance
- 8.5.7. Key strategic moves and developments
- 8.6. Woodco
- 8.6.1. Company overview
- 8.6.2. Key executives
- 8.6.3. Company snapshot
- 8.6.4. Operating business segments
- 8.6.5. Product portfolio
- 8.6.6. Business performance
- 8.6.7. Key strategic moves and developments
- 8.7. Viessmann
- 8.7.1. Company overview
- 8.7.2. Key executives
- 8.7.3. Company snapshot
- 8.7.4. Operating business segments
- 8.7.5. Product portfolio
- 8.7.6. Business performance
- 8.7.7. Key strategic moves and developments
- 8.8. John Cockerill
- 8.8.1. Company overview
- 8.8.2. Key executives
- 8.8.3. Company snapshot
- 8.8.4. Operating business segments
- 8.8.5. Product portfolio
- 8.8.6. Business performance
- 8.8.7. Key strategic moves and developments
- 8.9. Forbes Marshall
- 8.9.1. Company overview
- 8.9.2. Key executives
- 8.9.3. Company snapshot
- 8.9.4. Operating business segments
- 8.9.5. Product portfolio
- 8.9.6. Business performance
- 8.9.7. Key strategic moves and developments
- 8.10. Schmid AG energy solutions
- 8.10.1. Company overview
- 8.10.2. Key executives
- 8.10.3. Company snapshot
- 8.10.4. Operating business segments
- 8.10.5. Product portfolio
- 8.10.6. Business performance
- 8.10.7. Key strategic moves and developments
LIST OF TABLES
- TABLE 01. GLOBAL WOOD PELLETS BIOMASS BOILERS MARKET, BY TYPE, 2022-2032 ($MILLION)
- TABLE 02. WOOD PELLETS BIOMASS BOILERS MARKET FOR FULLY AUTOMATED BIOMASS BOILER, BY REGION, 2022-2032 ($MILLION)
- TABLE 03. WOOD PELLETS BIOMASS BOILERS MARKET FOR COMBINED HEAT AND POWER (CHP) BIOMASS SYSTEMS, BY REGION, 2022-2032 ($MILLION)
- TABLE 04. WOOD PELLETS BIOMASS BOILERS MARKET FOR SEMI-AUTOMATED INDUSTRIAL BIOMASS BOILERS , BY REGION, 2022-2032 ($MILLION)
- TABLE 05. WOOD PELLETS BIOMASS BOILERS MARKET FOR OTHERS, BY REGION, 2022-2032 ($MILLION)
- TABLE 06. GLOBAL WOOD PELLETS BIOMASS BOILERS MARKET, BY APPLICATION, 2022-2032 ($MILLION)
- TABLE 07. WOOD PELLETS BIOMASS BOILERS MARKET FOR RESIDENTIAL, BY REGION, 2022-2032 ($MILLION)
- TABLE 08. WOOD PELLETS BIOMASS BOILERS MARKET FOR COMMERCIAL, BY REGION, 2022-2032 ($MILLION)
- TABLE 09. WOOD PELLETS BIOMASS BOILERS MARKET, BY REGION, 2022-2032 ($MILLION)
- TABLE 10. NORTH AMERICA WOOD PELLETS BIOMASS BOILERS MARKET, BY TYPE, 2022-2032 ($MILLION)
- TABLE 11. NORTH AMERICA WOOD PELLETS BIOMASS BOILERS MARKET, BY APPLICATION, 2022-2032 ($MILLION)
- TABLE 12. NORTH AMERICA WOOD PELLETS BIOMASS BOILERS MARKET, BY COUNTRY, 2022-2032 ($MILLION)
- TABLE 13. U.S. WOOD PELLETS BIOMASS BOILERS MARKET, BY TYPE, 2022-2032 ($MILLION)
- TABLE 14. U.S. WOOD PELLETS BIOMASS BOILERS MARKET, BY APPLICATION, 2022-2032 ($MILLION)
- TABLE 15. CANADA WOOD PELLETS BIOMASS BOILERS MARKET, BY TYPE, 2022-2032 ($MILLION)
- TABLE 16. CANADA WOOD PELLETS BIOMASS BOILERS MARKET, BY APPLICATION, 2022-2032 ($MILLION)
- TABLE 17. MEXICO WOOD PELLETS BIOMASS BOILERS MARKET, BY TYPE, 2022-2032 ($MILLION)
- TABLE 18. MEXICO WOOD PELLETS BIOMASS BOILERS MARKET, BY APPLICATION, 2022-2032 ($MILLION)
- TABLE 19. EUROPE WOOD PELLETS BIOMASS BOILERS MARKET, BY TYPE, 2022-2032 ($MILLION)
- TABLE 20. EUROPE WOOD PELLETS BIOMASS BOILERS MARKET, BY APPLICATION, 2022-2032 ($MILLION)
- TABLE 21. EUROPE WOOD PELLETS BIOMASS BOILERS MARKET, BY COUNTRY, 2022-2032 ($MILLION)
- TABLE 22. GERMANY WOOD PELLETS BIOMASS BOILERS MARKET, BY TYPE, 2022-2032 ($MILLION)
- TABLE 23. GERMANY WOOD PELLETS BIOMASS BOILERS MARKET, BY APPLICATION, 2022-2032 ($MILLION)
- TABLE 24. UK WOOD PELLETS BIOMASS BOILERS MARKET, BY TYPE, 2022-2032 ($MILLION)
- TABLE 25. UK WOOD PELLETS BIOMASS BOILERS MARKET, BY APPLICATION, 2022-2032 ($MILLION)
- TABLE 26. FRANCE WOOD PELLETS BIOMASS BOILERS MARKET, BY TYPE, 2022-2032 ($MILLION)
- TABLE 27. FRANCE WOOD PELLETS BIOMASS BOILERS MARKET, BY APPLICATION, 2022-2032 ($MILLION)
- TABLE 28. ITALY WOOD PELLETS BIOMASS BOILERS MARKET, BY TYPE, 2022-2032 ($MILLION)
- TABLE 29. ITALY WOOD PELLETS BIOMASS BOILERS MARKET, BY APPLICATION, 2022-2032 ($MILLION)
- TABLE 30. NETHERLANDS WOOD PELLETS BIOMASS BOILERS MARKET, BY TYPE, 2022-2032 ($MILLION)
- TABLE 31. NETHERLANDS WOOD PELLETS BIOMASS BOILERS MARKET, BY APPLICATION, 2022-2032 ($MILLION)
- TABLE 32. REST OF EUROPE WOOD PELLETS BIOMASS BOILERS MARKET, BY TYPE, 2022-2032 ($MILLION)
- TABLE 33. REST OF EUROPE WOOD PELLETS BIOMASS BOILERS MARKET, BY APPLICATION, 2022-2032 ($MILLION)
- TABLE 34. ASIA-PACIFIC WOOD PELLETS BIOMASS BOILERS MARKET, BY TYPE, 2022-2032 ($MILLION)
- TABLE 35. ASIA-PACIFIC WOOD PELLETS BIOMASS BOILERS MARKET, BY APPLICATION, 2022-2032 ($MILLION)
- TABLE 36. ASIA-PACIFIC WOOD PELLETS BIOMASS BOILERS MARKET, BY COUNTRY, 2022-2032 ($MILLION)
- TABLE 37. CHINA WOOD PELLETS BIOMASS BOILERS MARKET, BY TYPE, 2022-2032 ($MILLION)
- TABLE 38. CHINA WOOD PELLETS BIOMASS BOILERS MARKET, BY APPLICATION, 2022-2032 ($MILLION)
- TABLE 39. JAPAN WOOD PELLETS BIOMASS BOILERS MARKET, BY TYPE, 2022-2032 ($MILLION)
- TABLE 40. JAPAN WOOD PELLETS BIOMASS BOILERS MARKET, BY APPLICATION, 2022-2032 ($MILLION)
- TABLE 41. INDIA WOOD PELLETS BIOMASS BOILERS MARKET, BY TYPE, 2022-2032 ($MILLION)
- TABLE 42. INDIA WOOD PELLETS BIOMASS BOILERS MARKET, BY APPLICATION, 2022-2032 ($MILLION)
- TABLE 43. SOUTH KOREA WOOD PELLETS BIOMASS BOILERS MARKET, BY TYPE, 2022-2032 ($MILLION)
- TABLE 44. SOUTH KOREA WOOD PELLETS BIOMASS BOILERS MARKET, BY APPLICATION, 2022-2032 ($MILLION)
- TABLE 45. AUSTRALIA WOOD PELLETS BIOMASS BOILERS MARKET, BY TYPE, 2022-2032 ($MILLION)
- TABLE 46. AUSTRALIA WOOD PELLETS BIOMASS BOILERS MARKET, BY APPLICATION, 2022-2032 ($MILLION)
- TABLE 47. REST OF ASIA-PACIFIC WOOD PELLETS BIOMASS BOILERS MARKET, BY TYPE, 2022-2032 ($MILLION)
- TABLE 48. REST OF ASIA-PACIFIC WOOD PELLETS BIOMASS BOILERS MARKET, BY APPLICATION, 2022-2032 ($MILLION)
- TABLE 49. LAMEA WOOD PELLETS BIOMASS BOILERS MARKET, BY TYPE, 2022-2032 ($MILLION)
- TABLE 50. LAMEA WOOD PELLETS BIOMASS BOILERS MARKET, BY APPLICATION, 2022-2032 ($MILLION)
- TABLE 51. LAMEA WOOD PELLETS BIOMASS BOILERS MARKET, BY COUNTRY, 2022-2032 ($MILLION)
- TABLE 52. BRAZIL WOOD PELLETS BIOMASS BOILERS MARKET, BY TYPE, 2022-2032 ($MILLION)
- TABLE 53. BRAZIL WOOD PELLETS BIOMASS BOILERS MARKET, BY APPLICATION, 2022-2032 ($MILLION)
- TABLE 54. UNITED ARAB EMIRATES WOOD PELLETS BIOMASS BOILERS MARKET, BY TYPE, 2022-2032 ($MILLION)
- TABLE 55. UNITED ARAB EMIRATES WOOD PELLETS BIOMASS BOILERS MARKET, BY APPLICATION, 2022-2032 ($MILLION)
- TABLE 56. SAUDI ARABIA WOOD PELLETS BIOMASS BOILERS MARKET, BY TYPE, 2022-2032 ($MILLION)
- TABLE 57. SAUDI ARABIA WOOD PELLETS BIOMASS BOILERS MARKET, BY APPLICATION, 2022-2032 ($MILLION)
- TABLE 58. SOUTH AFRICA WOOD PELLETS BIOMASS BOILERS MARKET, BY TYPE, 2022-2032 ($MILLION)
- TABLE 59. SOUTH AFRICA WOOD PELLETS BIOMASS BOILERS MARKET, BY APPLICATION, 2022-2032 ($MILLION)
- TABLE 60. REST OF LAMEA WOOD PELLETS BIOMASS BOILERS MARKET, BY TYPE, 2022-2032 ($MILLION)
- TABLE 61. REST OF LAMEA WOOD PELLETS BIOMASS BOILERS MARKET, BY APPLICATION, 2022-2032 ($MILLION)
- TABLE 62. THERMAX LIMITED: KEY EXECUTIVES
- TABLE 63. THERMAX LIMITED: COMPANY SNAPSHOT
- TABLE 64. THERMAX LIMITED: PRODUCT SEGMENTS
- TABLE 65. THERMAX LIMITED: SERVICE SEGMENTS
- TABLE 66. THERMAX LIMITED: PRODUCT PORTFOLIO
- TABLE 67. THERMAX LIMITED: KEY STRATERGIES
- TABLE 68. BABCOCK & WILCOX ENTERPRISES, INC.: KEY EXECUTIVES
- TABLE 69. BABCOCK & WILCOX ENTERPRISES, INC.: COMPANY SNAPSHOT
- TABLE 70. BABCOCK & WILCOX ENTERPRISES, INC.: PRODUCT SEGMENTS
- TABLE 71. BABCOCK & WILCOX ENTERPRISES, INC.: SERVICE SEGMENTS
- TABLE 72. BABCOCK & WILCOX ENTERPRISES, INC.: PRODUCT PORTFOLIO
- TABLE 73. BABCOCK & WILCOX ENTERPRISES, INC.: KEY STRATERGIES
- TABLE 74. ANDRITZ AG: KEY EXECUTIVES
- TABLE 75. ANDRITZ AG: COMPANY SNAPSHOT
- TABLE 76. ANDRITZ AG: PRODUCT SEGMENTS
- TABLE 77. ANDRITZ AG: SERVICE SEGMENTS
- TABLE 78. ANDRITZ AG: PRODUCT PORTFOLIO
- TABLE 79. ANDRITZ AG: KEY STRATERGIES
- TABLE 80. DRAX: KEY EXECUTIVES
- TABLE 81. DRAX: COMPANY SNAPSHOT
- TABLE 82. DRAX: PRODUCT SEGMENTS
- TABLE 83. DRAX: SERVICE SEGMENTS
- TABLE 84. DRAX: PRODUCT PORTFOLIO
- TABLE 85. DRAX: KEY STRATERGIES
- TABLE 86. HURST BOILER & WELDING CO, INC.: KEY EXECUTIVES
- TABLE 87. HURST BOILER & WELDING CO, INC.: COMPANY SNAPSHOT
- TABLE 88. HURST BOILER & WELDING CO, INC.: PRODUCT SEGMENTS
- TABLE 89. HURST BOILER & WELDING CO, INC.: SERVICE SEGMENTS
- TABLE 90. HURST BOILER & WELDING CO, INC.: PRODUCT PORTFOLIO
- TABLE 91. HURST BOILER & WELDING CO, INC.: KEY STRATERGIES
- TABLE 92. WOODCO: KEY EXECUTIVES
- TABLE 93. WOODCO: COMPANY SNAPSHOT
- TABLE 94. WOODCO: PRODUCT SEGMENTS
- TABLE 95. WOODCO: SERVICE SEGMENTS
- TABLE 96. WOODCO: PRODUCT PORTFOLIO
- TABLE 97. WOODCO: KEY STRATERGIES
- TABLE 98. VIESSMANN: KEY EXECUTIVES
- TABLE 99. VIESSMANN: COMPANY SNAPSHOT
- TABLE 100. VIESSMANN: PRODUCT SEGMENTS
- TABLE 101. VIESSMANN: SERVICE SEGMENTS
- TABLE 102. VIESSMANN: PRODUCT PORTFOLIO
- TABLE 103. VIESSMANN: KEY STRATERGIES
- TABLE 104. JOHN COCKERILL: KEY EXECUTIVES
- TABLE 105. JOHN COCKERILL: COMPANY SNAPSHOT
- TABLE 106. JOHN COCKERILL: PRODUCT SEGMENTS
- TABLE 107. JOHN COCKERILL: SERVICE SEGMENTS
- TABLE 108. JOHN COCKERILL: PRODUCT PORTFOLIO
- TABLE 109. JOHN COCKERILL: KEY STRATERGIES
- TABLE 110. FORBES MARSHALL: KEY EXECUTIVES
- TABLE 111. FORBES MARSHALL: COMPANY SNAPSHOT
- TABLE 112. FORBES MARSHALL: PRODUCT SEGMENTS
- TABLE 113. FORBES MARSHALL: SERVICE SEGMENTS
- TABLE 114. FORBES MARSHALL: PRODUCT PORTFOLIO
- TABLE 115. FORBES MARSHALL: KEY STRATERGIES
- TABLE 116. SCHMID AG ENERGY SOLUTIONS: KEY EXECUTIVES
- TABLE 117. SCHMID AG ENERGY SOLUTIONS: COMPANY SNAPSHOT
- TABLE 118. SCHMID AG ENERGY SOLUTIONS: PRODUCT SEGMENTS
- TABLE 119. SCHMID AG ENERGY SOLUTIONS: SERVICE SEGMENTS
- TABLE 120. SCHMID AG ENERGY SOLUTIONS: PRODUCT PORTFOLIO
- TABLE 121. SCHMID AG ENERGY SOLUTIONS: KEY STRATERGIES
LIST OF FIGURES
- FIGURE 01. WOOD PELLETS BIOMASS BOILERS MARKET, 2022-2032
- FIGURE 02. SEGMENTATION OF WOOD PELLETS BIOMASS BOILERS MARKET,2022-2032
- FIGURE 03. TOP IMPACTING FACTORS IN WOOD PELLETS BIOMASS BOILERS MARKET
- FIGURE 04. TOP INVESTMENT POCKETS IN WOOD PELLETS BIOMASS BOILERS MARKET (2023-2032)
- FIGURE 05. BARGAINING POWER OF SUPPLIERS
- FIGURE 06. BARGAINING POWER OF BUYERS
- FIGURE 07. THREAT OF SUBSTITUTION
- FIGURE 08. THREAT OF SUBSTITUTION
- FIGURE 09. COMPETITIVE RIVALRY
- FIGURE 10. GLOBAL WOOD PELLETS BIOMASS BOILERS MARKET:DRIVERS, RESTRAINTS AND OPPORTUNITIES
- FIGURE 11. PATENT ANALYSIS BY COMPANY
- FIGURE 12. PATENT ANALYSIS BY COUNTRY
- FIGURE 13. WOOD PELLETS BIOMASS BOILERS MARKET, BY TYPE, 2022 AND 2032(%)
- FIGURE 14. COMPARATIVE SHARE ANALYSIS OF WOOD PELLETS BIOMASS BOILERS MARKET FOR FULLY AUTOMATED BIOMASS BOILER, BY COUNTRY 2022 AND 2032(%)
- FIGURE 15. COMPARATIVE SHARE ANALYSIS OF WOOD PELLETS BIOMASS BOILERS MARKET FOR COMBINED HEAT AND POWER (CHP) BIOMASS SYSTEMS, BY COUNTRY 2022 AND 2032(%)
- FIGURE 16. COMPARATIVE SHARE ANALYSIS OF WOOD PELLETS BIOMASS BOILERS MARKET FOR SEMI-AUTOMATED INDUSTRIAL BIOMASS BOILERS , BY COUNTRY 2022 AND 2032(%)
- FIGURE 17. COMPARATIVE SHARE ANALYSIS OF WOOD PELLETS BIOMASS BOILERS MARKET FOR OTHERS, BY COUNTRY 2022 AND 2032(%)
- FIGURE 18. WOOD PELLETS BIOMASS BOILERS MARKET, BY APPLICATION, 2022 AND 2032(%)
- FIGURE 19. COMPARATIVE SHARE ANALYSIS OF WOOD PELLETS BIOMASS BOILERS MARKET FOR RESIDENTIAL, BY COUNTRY 2022 AND 2032(%)
- FIGURE 20. COMPARATIVE SHARE ANALYSIS OF WOOD PELLETS BIOMASS BOILERS MARKET FOR COMMERCIAL, BY COUNTRY 2022 AND 2032(%)
- FIGURE 21. WOOD PELLETS BIOMASS BOILERS MARKET BY REGION, 2022 AND 2032(%)
- FIGURE 22. U.S. WOOD PELLETS BIOMASS BOILERS MARKET, 2022-2032 ($MILLION)
- FIGURE 23. CANADA WOOD PELLETS BIOMASS BOILERS MARKET, 2022-2032 ($MILLION)
- FIGURE 24. MEXICO WOOD PELLETS BIOMASS BOILERS MARKET, 2022-2032 ($MILLION)
- FIGURE 25. GERMANY WOOD PELLETS BIOMASS BOILERS MARKET, 2022-2032 ($MILLION)
- FIGURE 26. UK WOOD PELLETS BIOMASS BOILERS MARKET, 2022-2032 ($MILLION)
- FIGURE 27. FRANCE WOOD PELLETS BIOMASS BOILERS MARKET, 2022-2032 ($MILLION)
- FIGURE 28. ITALY WOOD PELLETS BIOMASS BOILERS MARKET, 2022-2032 ($MILLION)
- FIGURE 29. NETHERLANDS WOOD PELLETS BIOMASS BOILERS MARKET, 2022-2032 ($MILLION)
- FIGURE 30. REST OF EUROPE WOOD PELLETS BIOMASS BOILERS MARKET, 2022-2032 ($MILLION)
- FIGURE 31. CHINA WOOD PELLETS BIOMASS BOILERS MARKET, 2022-2032 ($MILLION)
- FIGURE 32. JAPAN WOOD PELLETS BIOMASS BOILERS MARKET, 2022-2032 ($MILLION)
- FIGURE 33. INDIA WOOD PELLETS BIOMASS BOILERS MARKET, 2022-2032 ($MILLION)
- FIGURE 34. SOUTH KOREA WOOD PELLETS BIOMASS BOILERS MARKET, 2022-2032 ($MILLION)
- FIGURE 35. AUSTRALIA WOOD PELLETS BIOMASS BOILERS MARKET, 2022-2032 ($MILLION)
- FIGURE 36. REST OF ASIA-PACIFIC WOOD PELLETS BIOMASS BOILERS MARKET, 2022-2032 ($MILLION)
- FIGURE 37. BRAZIL WOOD PELLETS BIOMASS BOILERS MARKET, 2022-2032 ($MILLION)
- FIGURE 38. UNITED ARAB EMIRATES WOOD PELLETS BIOMASS BOILERS MARKET, 2022-2032 ($MILLION)
- FIGURE 39. SAUDI ARABIA WOOD PELLETS BIOMASS BOILERS MARKET, 2022-2032 ($MILLION)
- FIGURE 40. SOUTH AFRICA WOOD PELLETS BIOMASS BOILERS MARKET, 2022-2032 ($MILLION)
- FIGURE 41. REST OF LAMEA WOOD PELLETS BIOMASS BOILERS MARKET, 2022-2032 ($MILLION)
- FIGURE 42. TOP WINNING STRATEGIES, BY YEAR
- FIGURE 43. TOP WINNING STRATEGIES, BY DEVELOPMENT
- FIGURE 44. TOP WINNING STRATEGIES, BY COMPANY
- FIGURE 45. PRODUCT MAPPING OF TOP 10 PLAYERS
- FIGURE 46. COMPETITIVE DASHBOARD
- FIGURE 47. COMPETITIVE HEATMAP: WOOD PELLETS BIOMASS BOILERS MARKET
- FIGURE 48. TOP PLAYER POSITIONING, 2022

