
PUBLISHER: Allied Market Research | PRODUCT CODE: 1472334

PUBLISHER: Allied Market Research | PRODUCT CODE: 1472334
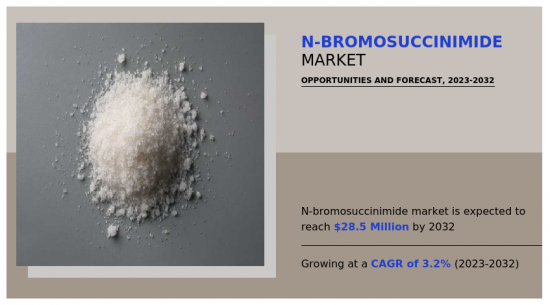
N-Bromosuccinimide Market By Content (Content 99, Content 98), By Application (Pharmaceutical Industry, Pesticides Industry, Others): Global Opportunity Analysis and Industry Forecast, 2023-2032
The N-Bromosuccinimide market attained $21.1 million in 2022 and is projected to reach $28.5 million by 2032, growing at a CAGR of 3.2% from 2023 to 2032.
N-Bromosuccinimide (NBS) is a versatile organic compound utilized in various chemical reactions, particularly in organic synthesis. It appears as a white crystalline solid and is composed of a succinimide ring with a bromine atom attached. NBS is primarily employed as a brominating agent, facilitating substitution reactions where hydrogen atoms are replaced with bromine atoms. Its selective bromination capabilities make it valuable in synthesizing organic compounds, including pharmaceuticals and complex molecules. NBS is preferred over other brominating agents due to its mild nature, which minimizes unwanted side reactions. Its controlled reactivity and broad applicability make it a cornerstone in organic chemistry.
The increasing demand for specialty chemicals is poised to significantly drive the growth of the N-Bromosuccinimide market. Specialty chemicals play a crucial role in various industries, including pharmaceuticals, agrochemicals, flavors, fragrances, and polymers. NBS, as a key brominating agent, finds extensive use in the synthesis of specialty chemicals due to its selective bromination capabilities and compatibility with a wide range of substrates. As industries increasingly focus on developing high-value-added products with specific functionalities, the demand for specialty chemicals continues to rise. This trend is fueled by factors such as evolving consumer preferences, technological advancements, and regulatory requirements. Consequently, the demand for NBS as a vital ingredient in the production of specialty chemicals is expected to experience a notable upsurge.
Manufacturers of NBS are likely to witness expanded opportunities and increased market penetration as they cater to the growing needs of industries reliant on specialty chemicals. Moreover, the versatility and efficacy of NBS in various chemical processes position it as a preferred choice, further bolstering its market growth amidst the burgeoning demand for specialty chemicals.
The availability of alternatives poses a significant challenge to the growth of the N-Bromosuccinimide (NBS) market. NBS is commonly used as a brominating agent in various chemical reactions, particularly in organic synthesis, due to its selectivity and efficiency. However, alternative reagents and methods for bromination reactions exist, including other brominating agents such as bromine, bromine salts, and organic bromides. In addition, non-bromine-based methods such as metal-catalyzed bromination reactions or radical bromination processes offer alternatives to NBS in certain applications.
These alternative reagents and methods may offer advantages such as lower cost, easier handling, improved safety profiles, or environmental friendliness compared to NBS. For example, some alternative brominating agents may be more readily available or less expensive than NBS, particularly in regions where NBS production or distribution is limited. Furthermore, alternatives that minimize the generation of hazardous by-products or reduce environmental impact may be preferred in industries with stringent regulations or sustainability goals. The availability of alternatives not only provides consumers with options but also intensifies competition within the market for brominating agents. This competitive pressure can limit the market share and growth prospects of NBS, particularly if alternative reagents or methods offer comparable performance at a lower cost or with other advantages.
The shift towards bromine-based reagents presents a lucrative opportunity for the N-Bromosuccinimide (NBS) market. Bromine-based reagents are highly valued in various industries due to their versatility and efficacy in a wide range of chemical reactions. NBS, being a key bromine-based reagent, benefits from this trend as it offers unique advantages such as selective bromination and compatibility with diverse synthesis methodologies. Industries including pharmaceuticals, agrochemicals, and polymers increasingly rely on bromine-based reagents like NBS to meet their evolving needs for efficient and sustainable chemical processes.
Moreover, the properties of NBS make it particularly suitable for applications requiring precise control over bromination reactions, such as in the synthesis of pharmaceutical intermediates and specialty chemicals. As industries worldwide recognize the benefits of bromine-based reagents in enhancing product quality and process efficiency, the demand for NBS is expected to experience significant growth. Manufacturers of NBS are thus presented with a lucrative opportunity to capitalize on this shift towards bromine-based chemistry by offering high-quality products and innovative solutions tailored to meet the evolving demands of various industrial sectors.
The N-Bromosuccinimide market is segmented based on content, application, and region. By content, the market is bifurcated into content 99% and content 98%. By application, it is categorized into pharmaceutical industry, pesticides industry, and others. Region-wise, the market is studied across North America, Europe, Asia-Pacific, and LAMEA.
The major players operating in the global N-Bromosuccinimide market are Nanjing Suru Chemical Co., Ltd., HALIDES CHEMICALS PVT. LTD., Anhui Wotu Chemical Co., Ltd., Yizheng East Chemical Co., Ltd., Jiangxi Dasuo Chemical Co., Ltd., Purecha Group, Zhejiang Kente Catalysts Technologies Co., Ltd., SAMUH LAXMI CHEMICALS (BOM) P. LTD., Resins & Allied Products Maharashtra, India, and MODY CHEMI PHARMA LTD.
Other players include HARIKRISHNA ENTERPRISE, Global Pharma Chem., Haihang Industry, Fengchen Group Co., Ltd., Spectrum Chemical, and Clever Pathway Private Limited.
Key Benefits For Stakeholders
- This report provides a quantitative analysis of the market segments, current trends, estimations, and dynamics of the n-bromosuccinimide market analysis from 2022 to 2032 to identify the prevailing n-bromosuccinimide market opportunities.
- The market research is offered along with information related to key drivers, restraints, and opportunities.
- Porter's five forces analysis highlights the potency of buyers and suppliers to enable stakeholders make profit-oriented business decisions and strengthen their supplier-buyer network.
- In-depth analysis of the n-bromosuccinimide market segmentation assists to determine the prevailing market opportunities.
- Major countries in each region are mapped according to their revenue contribution to the global market.
- Market player positioning facilitates benchmarking and provides a clear understanding of the present position of the market players.
- The report includes the analysis of the regional as well as global n-bromosuccinimide market trends, key players, market segments, application areas, and market growth strategies.
Additional benefits you will get with this purchase are:
- Quarterly Update and* (only available with a corporate license, on listed price)
- 5 additional Company Profile of client Choice pre- or Post-purchase, as a free update.
- Free Upcoming Version on the Purchase of Five and Enterprise User License.
- 16 analyst hours of support* (post-purchase, if you find additional data requirements upon review of the report, you may receive support amounting to 16 analyst hours to solve questions, and post-sale queries)
- 15% Free Customization* (in case the scope or segment of the report does not match your requirements, 15% is equivalent to 3 working days of free work, applicable once)
- Free data Pack on the Five and Enterprise User License. (Excel version of the report)
- Free Updated report if the report is 6-12 months old or older.
- 24-hour priority response*
- Free Industry updates and white papers.
Possible Customization with this report (with additional cost and timeline, please talk to the sales executive to know more)
- Analysis of raw material in a product (by %)
- Manufacturing Capacity
- Consumer Buying Behavior Analysis
- End user preferences and pain points
- Investment Opportunities
- Product Benchmarking / Product specification and applications
- Senario Analysis & Growth Trend Comparision
- Supply Chain Analysis & Vendor Margins
- Upcoming/New Entrant by Regions
- Market share analysis of players by products/segments
- New Product Development/ Product Matrix of Key Players
- Regulatory Guidelines
- Strategic Recommedations
- Additional company profiles with specific to client's interest
- Additional country or region analysis- market size and forecast
- Average Selling Price Analysis / Price Point Analysis
- Expanded list for Company Profiles
- Key player details (including location, contact details, supplier/vendor network etc. in excel format)
- List of customers/consumers/raw material suppliers- value chain analysis
- Market share analysis of players at global/region/country level
- Product Consumption Analysis
- SWOT Analysis
- Volume Market Size and Forecast
Key Market Segments
By Content
- Content 99
- Content 98
By Application
- Pharmaceutical Industry
- Pesticides Industry
- Others
By Region
- North America
- U.S.
- Canada
- Mexico
- Europe
- Germany
- France
- UK
- Spain
- Italy
- Rest of Europe
- Asia-Pacific
- China
- India
- Japan
- South Korea
- Australia
- Rest of Asia-Pacific
- LAMEA
- Brazil
- South Africa
- Saudi Arabi
- Rest of LAMEA
Key Market Players:
- Nanjing Suru Chemical Co., Ltd
- HALIDES CHEMICALS PVT. LTD.
- Anhui Wotu Chemical Co., Ltd.
- Yizheng East Chemical Co., Ltd.
- Jiangxi Dasuo Chemical Co., Ltd
- Purecha Group
- Zhejiang Kente Catalysts Technologies Co., Ltd.
- SAMUH LAXMI CHEMICALS (BOM) P. LTD
- Resins & Allied Products Maharashtra, India
- MODY CHEMI PHARMA LTD.
TABLE OF CONTENTS
CHAPTER 1: INTRODUCTION
- 1.1. Report description
- 1.2. Key market segments
- 1.3. Key benefits to the stakeholders
- 1.4. Research methodology
- 1.4.1. Primary research
- 1.4.2. Secondary research
- 1.4.3. Analyst tools and models
CHAPTER 2: EXECUTIVE SUMMARY
- 2.1. CXO perspective
CHAPTER 3: MARKET OVERVIEW
- 3.1. Market definition and scope
- 3.2. Key findings
- 3.2.1. Top impacting factors
- 3.2.2. Top investment pockets
- 3.3. Porter's five forces analysis
- 3.4. Market dynamics
- 3.4.1. Drivers
- 3.4.2. Restraints
- 3.4.3. Opportunities
- 3.5. Value Chain Analysis
- 3.6. Key Regulation Analysis
- 3.7. Patent Landscape
CHAPTER 4: N-BROMOSUCCINIMIDE MARKET, BY CONTENT
- 4.1. Overview
- 4.1.1. Market size and forecast
- 4.2. Content 99
- 4.2.1. Key market trends, growth factors and opportunities
- 4.2.2. Market size and forecast, by region
- 4.2.3. Market share analysis by country
- 4.3. Content 98
- 4.3.1. Key market trends, growth factors and opportunities
- 4.3.2. Market size and forecast, by region
- 4.3.3. Market share analysis by country
CHAPTER 5: N-BROMOSUCCINIMIDE MARKET, BY APPLICATION
- 5.1. Overview
- 5.1.1. Market size and forecast
- 5.2. Pharmaceutical Industry
- 5.2.1. Key market trends, growth factors and opportunities
- 5.2.2. Market size and forecast, by region
- 5.2.3. Market share analysis by country
- 5.3. Pesticides Industry
- 5.3.1. Key market trends, growth factors and opportunities
- 5.3.2. Market size and forecast, by region
- 5.3.3. Market share analysis by country
- 5.4. Others
- 5.4.1. Key market trends, growth factors and opportunities
- 5.4.2. Market size and forecast, by region
- 5.4.3. Market share analysis by country
CHAPTER 6: N-BROMOSUCCINIMIDE MARKET, BY REGION
- 6.1. Overview
- 6.1.1. Market size and forecast By Region
- 6.2. North America
- 6.2.1. Key market trends, growth factors and opportunities
- 6.2.2. Market size and forecast, by Content
- 6.2.3. Market size and forecast, by Application
- 6.2.4. Market size and forecast, by country
- 6.2.4.1. U.S.
- 6.2.4.1.1. Market size and forecast, by Content
- 6.2.4.1.2. Market size and forecast, by Application
- 6.2.4.2. Canada
- 6.2.4.2.1. Market size and forecast, by Content
- 6.2.4.2.2. Market size and forecast, by Application
- 6.2.4.3. Mexico
- 6.2.4.3.1. Market size and forecast, by Content
- 6.2.4.3.2. Market size and forecast, by Application
- 6.3. Europe
- 6.3.1. Key market trends, growth factors and opportunities
- 6.3.2. Market size and forecast, by Content
- 6.3.3. Market size and forecast, by Application
- 6.3.4. Market size and forecast, by country
- 6.3.4.1. Germany
- 6.3.4.1.1. Market size and forecast, by Content
- 6.3.4.1.2. Market size and forecast, by Application
- 6.3.4.2. France
- 6.3.4.2.1. Market size and forecast, by Content
- 6.3.4.2.2. Market size and forecast, by Application
- 6.3.4.3. UK
- 6.3.4.3.1. Market size and forecast, by Content
- 6.3.4.3.2. Market size and forecast, by Application
- 6.3.4.4. Spain
- 6.3.4.4.1. Market size and forecast, by Content
- 6.3.4.4.2. Market size and forecast, by Application
- 6.3.4.5. Italy
- 6.3.4.5.1. Market size and forecast, by Content
- 6.3.4.5.2. Market size and forecast, by Application
- 6.3.4.6. Rest of Europe
- 6.3.4.6.1. Market size and forecast, by Content
- 6.3.4.6.2. Market size and forecast, by Application
- 6.4. Asia-Pacific
- 6.4.1. Key market trends, growth factors and opportunities
- 6.4.2. Market size and forecast, by Content
- 6.4.3. Market size and forecast, by Application
- 6.4.4. Market size and forecast, by country
- 6.4.4.1. China
- 6.4.4.1.1. Market size and forecast, by Content
- 6.4.4.1.2. Market size and forecast, by Application
- 6.4.4.2. India
- 6.4.4.2.1. Market size and forecast, by Content
- 6.4.4.2.2. Market size and forecast, by Application
- 6.4.4.3. Japan
- 6.4.4.3.1. Market size and forecast, by Content
- 6.4.4.3.2. Market size and forecast, by Application
- 6.4.4.4. South Korea
- 6.4.4.4.1. Market size and forecast, by Content
- 6.4.4.4.2. Market size and forecast, by Application
- 6.4.4.5. Australia
- 6.4.4.5.1. Market size and forecast, by Content
- 6.4.4.5.2. Market size and forecast, by Application
- 6.4.4.6. Rest of Asia-Pacific
- 6.4.4.6.1. Market size and forecast, by Content
- 6.4.4.6.2. Market size and forecast, by Application
- 6.5. LAMEA
- 6.5.1. Key market trends, growth factors and opportunities
- 6.5.2. Market size and forecast, by Content
- 6.5.3. Market size and forecast, by Application
- 6.5.4. Market size and forecast, by country
- 6.5.4.1. Brazil
- 6.5.4.1.1. Market size and forecast, by Content
- 6.5.4.1.2. Market size and forecast, by Application
- 6.5.4.2. South Africa
- 6.5.4.2.1. Market size and forecast, by Content
- 6.5.4.2.2. Market size and forecast, by Application
- 6.5.4.3. Saudi Arabi
- 6.5.4.3.1. Market size and forecast, by Content
- 6.5.4.3.2. Market size and forecast, by Application
- 6.5.4.4. Rest of LAMEA
- 6.5.4.4.1. Market size and forecast, by Content
- 6.5.4.4.2. Market size and forecast, by Application
CHAPTER 7: COMPETITIVE LANDSCAPE
- 7.1. Introduction
- 7.2. Top winning strategies
- 7.3. Product mapping of top 10 player
- 7.4. Competitive dashboard
- 7.5. Competitive heatmap
- 7.6. Top player positioning, 2022
CHAPTER 8: COMPANY PROFILES
- 8.1. Nanjing Suru Chemical Co., Ltd
- 8.1.1. Company overview
- 8.1.2. Key executives
- 8.1.3. Company snapshot
- 8.1.4. Operating business segments
- 8.1.5. Product portfolio
- 8.1.6. Business performance
- 8.1.7. Key strategic moves and developments
- 8.2. HALIDES CHEMICALS PVT. LTD.
- 8.2.1. Company overview
- 8.2.2. Key executives
- 8.2.3. Company snapshot
- 8.2.4. Operating business segments
- 8.2.5. Product portfolio
- 8.2.6. Business performance
- 8.2.7. Key strategic moves and developments
- 8.3. Anhui Wotu Chemical Co., Ltd.
- 8.3.1. Company overview
- 8.3.2. Key executives
- 8.3.3. Company snapshot
- 8.3.4. Operating business segments
- 8.3.5. Product portfolio
- 8.3.6. Business performance
- 8.3.7. Key strategic moves and developments
- 8.4. Yizheng East Chemical Co., Ltd.
- 8.4.1. Company overview
- 8.4.2. Key executives
- 8.4.3. Company snapshot
- 8.4.4. Operating business segments
- 8.4.5. Product portfolio
- 8.4.6. Business performance
- 8.4.7. Key strategic moves and developments
- 8.5. Jiangxi Dasuo Chemical Co., Ltd
- 8.5.1. Company overview
- 8.5.2. Key executives
- 8.5.3. Company snapshot
- 8.5.4. Operating business segments
- 8.5.5. Product portfolio
- 8.5.6. Business performance
- 8.5.7. Key strategic moves and developments
- 8.6. Purecha Group
- 8.6.1. Company overview
- 8.6.2. Key executives
- 8.6.3. Company snapshot
- 8.6.4. Operating business segments
- 8.6.5. Product portfolio
- 8.6.6. Business performance
- 8.6.7. Key strategic moves and developments
- 8.7. Zhejiang Kente Catalysts Technologies Co., Ltd.
- 8.7.1. Company overview
- 8.7.2. Key executives
- 8.7.3. Company snapshot
- 8.7.4. Operating business segments
- 8.7.5. Product portfolio
- 8.7.6. Business performance
- 8.7.7. Key strategic moves and developments
- 8.8. SAMUH LAXMI CHEMICALS (BOM) P. LTD
- 8.8.1. Company overview
- 8.8.2. Key executives
- 8.8.3. Company snapshot
- 8.8.4. Operating business segments
- 8.8.5. Product portfolio
- 8.8.6. Business performance
- 8.8.7. Key strategic moves and developments
- 8.9. Resins & Allied Products Maharashtra, India
- 8.9.1. Company overview
- 8.9.2. Key executives
- 8.9.3. Company snapshot
- 8.9.4. Operating business segments
- 8.9.5. Product portfolio
- 8.9.6. Business performance
- 8.9.7. Key strategic moves and developments
- 8.10. MODY CHEMI PHARMA LTD.
- 8.10.1. Company overview
- 8.10.2. Key executives
- 8.10.3. Company snapshot
- 8.10.4. Operating business segments
- 8.10.5. Product portfolio
- 8.10.6. Business performance
- 8.10.7. Key strategic moves and developments
LIST OF TABLES
- TABLE 01. GLOBAL N-BROMOSUCCINIMIDE MARKET, BY CONTENT, 2022-2032 ($MILLION)
- TABLE 02. N-BROMOSUCCINIMIDE MARKET FOR CONTENT 99, BY REGION, 2022-2032 ($MILLION)
- TABLE 03. N-BROMOSUCCINIMIDE MARKET FOR CONTENT 98, BY REGION, 2022-2032 ($MILLION)
- TABLE 04. GLOBAL N-BROMOSUCCINIMIDE MARKET, BY APPLICATION, 2022-2032 ($MILLION)
- TABLE 05. N-BROMOSUCCINIMIDE MARKET FOR PHARMACEUTICAL INDUSTRY, BY REGION, 2022-2032 ($MILLION)
- TABLE 06. N-BROMOSUCCINIMIDE MARKET FOR PESTICIDES INDUSTRY, BY REGION, 2022-2032 ($MILLION)
- TABLE 07. N-BROMOSUCCINIMIDE MARKET FOR OTHERS, BY REGION, 2022-2032 ($MILLION)
- TABLE 08. N-BROMOSUCCINIMIDE MARKET, BY REGION, 2022-2032 ($MILLION)
- TABLE 09. NORTH AMERICA N-BROMOSUCCINIMIDE MARKET, BY CONTENT, 2022-2032 ($MILLION)
- TABLE 10. NORTH AMERICA N-BROMOSUCCINIMIDE MARKET, BY APPLICATION, 2022-2032 ($MILLION)
- TABLE 11. NORTH AMERICA N-BROMOSUCCINIMIDE MARKET, BY COUNTRY, 2022-2032 ($MILLION)
- TABLE 12. U.S. N-BROMOSUCCINIMIDE MARKET, BY CONTENT, 2022-2032 ($MILLION)
- TABLE 13. U.S. N-BROMOSUCCINIMIDE MARKET, BY APPLICATION, 2022-2032 ($MILLION)
- TABLE 14. CANADA N-BROMOSUCCINIMIDE MARKET, BY CONTENT, 2022-2032 ($MILLION)
- TABLE 15. CANADA N-BROMOSUCCINIMIDE MARKET, BY APPLICATION, 2022-2032 ($MILLION)
- TABLE 16. MEXICO N-BROMOSUCCINIMIDE MARKET, BY CONTENT, 2022-2032 ($MILLION)
- TABLE 17. MEXICO N-BROMOSUCCINIMIDE MARKET, BY APPLICATION, 2022-2032 ($MILLION)
- TABLE 18. EUROPE N-BROMOSUCCINIMIDE MARKET, BY CONTENT, 2022-2032 ($MILLION)
- TABLE 19. EUROPE N-BROMOSUCCINIMIDE MARKET, BY APPLICATION, 2022-2032 ($MILLION)
- TABLE 20. EUROPE N-BROMOSUCCINIMIDE MARKET, BY COUNTRY, 2022-2032 ($MILLION)
- TABLE 21. GERMANY N-BROMOSUCCINIMIDE MARKET, BY CONTENT, 2022-2032 ($MILLION)
- TABLE 22. GERMANY N-BROMOSUCCINIMIDE MARKET, BY APPLICATION, 2022-2032 ($MILLION)
- TABLE 23. FRANCE N-BROMOSUCCINIMIDE MARKET, BY CONTENT, 2022-2032 ($MILLION)
- TABLE 24. FRANCE N-BROMOSUCCINIMIDE MARKET, BY APPLICATION, 2022-2032 ($MILLION)
- TABLE 25. UK N-BROMOSUCCINIMIDE MARKET, BY CONTENT, 2022-2032 ($MILLION)
- TABLE 26. UK N-BROMOSUCCINIMIDE MARKET, BY APPLICATION, 2022-2032 ($MILLION)
- TABLE 27. SPAIN N-BROMOSUCCINIMIDE MARKET, BY CONTENT, 2022-2032 ($MILLION)
- TABLE 28. SPAIN N-BROMOSUCCINIMIDE MARKET, BY APPLICATION, 2022-2032 ($MILLION)
- TABLE 29. ITALY N-BROMOSUCCINIMIDE MARKET, BY CONTENT, 2022-2032 ($MILLION)
- TABLE 30. ITALY N-BROMOSUCCINIMIDE MARKET, BY APPLICATION, 2022-2032 ($MILLION)
- TABLE 31. REST OF EUROPE N-BROMOSUCCINIMIDE MARKET, BY CONTENT, 2022-2032 ($MILLION)
- TABLE 32. REST OF EUROPE N-BROMOSUCCINIMIDE MARKET, BY APPLICATION, 2022-2032 ($MILLION)
- TABLE 33. ASIA-PACIFIC N-BROMOSUCCINIMIDE MARKET, BY CONTENT, 2022-2032 ($MILLION)
- TABLE 34. ASIA-PACIFIC N-BROMOSUCCINIMIDE MARKET, BY APPLICATION, 2022-2032 ($MILLION)
- TABLE 35. ASIA-PACIFIC N-BROMOSUCCINIMIDE MARKET, BY COUNTRY, 2022-2032 ($MILLION)
- TABLE 36. CHINA N-BROMOSUCCINIMIDE MARKET, BY CONTENT, 2022-2032 ($MILLION)
- TABLE 37. CHINA N-BROMOSUCCINIMIDE MARKET, BY APPLICATION, 2022-2032 ($MILLION)
- TABLE 38. INDIA N-BROMOSUCCINIMIDE MARKET, BY CONTENT, 2022-2032 ($MILLION)
- TABLE 39. INDIA N-BROMOSUCCINIMIDE MARKET, BY APPLICATION, 2022-2032 ($MILLION)
- TABLE 40. JAPAN N-BROMOSUCCINIMIDE MARKET, BY CONTENT, 2022-2032 ($MILLION)
- TABLE 41. JAPAN N-BROMOSUCCINIMIDE MARKET, BY APPLICATION, 2022-2032 ($MILLION)
- TABLE 42. SOUTH KOREA N-BROMOSUCCINIMIDE MARKET, BY CONTENT, 2022-2032 ($MILLION)
- TABLE 43. SOUTH KOREA N-BROMOSUCCINIMIDE MARKET, BY APPLICATION, 2022-2032 ($MILLION)
- TABLE 44. AUSTRALIA N-BROMOSUCCINIMIDE MARKET, BY CONTENT, 2022-2032 ($MILLION)
- TABLE 45. AUSTRALIA N-BROMOSUCCINIMIDE MARKET, BY APPLICATION, 2022-2032 ($MILLION)
- TABLE 46. REST OF ASIA-PACIFIC N-BROMOSUCCINIMIDE MARKET, BY CONTENT, 2022-2032 ($MILLION)
- TABLE 47. REST OF ASIA-PACIFIC N-BROMOSUCCINIMIDE MARKET, BY APPLICATION, 2022-2032 ($MILLION)
- TABLE 48. LAMEA N-BROMOSUCCINIMIDE MARKET, BY CONTENT, 2022-2032 ($MILLION)
- TABLE 49. LAMEA N-BROMOSUCCINIMIDE MARKET, BY APPLICATION, 2022-2032 ($MILLION)
- TABLE 50. LAMEA N-BROMOSUCCINIMIDE MARKET, BY COUNTRY, 2022-2032 ($MILLION)
- TABLE 51. BRAZIL N-BROMOSUCCINIMIDE MARKET, BY CONTENT, 2022-2032 ($MILLION)
- TABLE 52. BRAZIL N-BROMOSUCCINIMIDE MARKET, BY APPLICATION, 2022-2032 ($MILLION)
- TABLE 53. SOUTH AFRICA N-BROMOSUCCINIMIDE MARKET, BY CONTENT, 2022-2032 ($MILLION)
- TABLE 54. SOUTH AFRICA N-BROMOSUCCINIMIDE MARKET, BY APPLICATION, 2022-2032 ($MILLION)
- TABLE 55. SAUDI ARABI N-BROMOSUCCINIMIDE MARKET, BY CONTENT, 2022-2032 ($MILLION)
- TABLE 56. SAUDI ARABI N-BROMOSUCCINIMIDE MARKET, BY APPLICATION, 2022-2032 ($MILLION)
- TABLE 57. REST OF LAMEA N-BROMOSUCCINIMIDE MARKET, BY CONTENT, 2022-2032 ($MILLION)
- TABLE 58. REST OF LAMEA N-BROMOSUCCINIMIDE MARKET, BY APPLICATION, 2022-2032 ($MILLION)
- TABLE 59. NANJING SURU CHEMICAL CO., LTD: KEY EXECUTIVES
- TABLE 60. NANJING SURU CHEMICAL CO., LTD: COMPANY SNAPSHOT
- TABLE 61. NANJING SURU CHEMICAL CO., LTD: PRODUCT SEGMENTS
- TABLE 62. NANJING SURU CHEMICAL CO., LTD: SERVICE SEGMENTS
- TABLE 63. NANJING SURU CHEMICAL CO., LTD: PRODUCT PORTFOLIO
- TABLE 64. NANJING SURU CHEMICAL CO., LTD: KEY STRATERGIES
- TABLE 65. HALIDES CHEMICALS PVT. LTD.: KEY EXECUTIVES
- TABLE 66. HALIDES CHEMICALS PVT. LTD.: COMPANY SNAPSHOT
- TABLE 67. HALIDES CHEMICALS PVT. LTD.: PRODUCT SEGMENTS
- TABLE 68. HALIDES CHEMICALS PVT. LTD.: SERVICE SEGMENTS
- TABLE 69. HALIDES CHEMICALS PVT. LTD.: PRODUCT PORTFOLIO
- TABLE 70. HALIDES CHEMICALS PVT. LTD.: KEY STRATERGIES
- TABLE 71. ANHUI WOTU CHEMICAL CO., LTD.: KEY EXECUTIVES
- TABLE 72. ANHUI WOTU CHEMICAL CO., LTD.: COMPANY SNAPSHOT
- TABLE 73. ANHUI WOTU CHEMICAL CO., LTD.: PRODUCT SEGMENTS
- TABLE 74. ANHUI WOTU CHEMICAL CO., LTD.: SERVICE SEGMENTS
- TABLE 75. ANHUI WOTU CHEMICAL CO., LTD.: PRODUCT PORTFOLIO
- TABLE 76. ANHUI WOTU CHEMICAL CO., LTD.: KEY STRATERGIES
- TABLE 77. YIZHENG EAST CHEMICAL CO., LTD.: KEY EXECUTIVES
- TABLE 78. YIZHENG EAST CHEMICAL CO., LTD.: COMPANY SNAPSHOT
- TABLE 79. YIZHENG EAST CHEMICAL CO., LTD.: PRODUCT SEGMENTS
- TABLE 80. YIZHENG EAST CHEMICAL CO., LTD.: SERVICE SEGMENTS
- TABLE 81. YIZHENG EAST CHEMICAL CO., LTD.: PRODUCT PORTFOLIO
- TABLE 82. YIZHENG EAST CHEMICAL CO., LTD.: KEY STRATERGIES
- TABLE 83. JIANGXI DASUO CHEMICAL CO., LTD: KEY EXECUTIVES
- TABLE 84. JIANGXI DASUO CHEMICAL CO., LTD: COMPANY SNAPSHOT
- TABLE 85. JIANGXI DASUO CHEMICAL CO., LTD: PRODUCT SEGMENTS
- TABLE 86. JIANGXI DASUO CHEMICAL CO., LTD: SERVICE SEGMENTS
- TABLE 87. JIANGXI DASUO CHEMICAL CO., LTD: PRODUCT PORTFOLIO
- TABLE 88. JIANGXI DASUO CHEMICAL CO., LTD: KEY STRATERGIES
- TABLE 89. PURECHA GROUP: KEY EXECUTIVES
- TABLE 90. PURECHA GROUP: COMPANY SNAPSHOT
- TABLE 91. PURECHA GROUP: PRODUCT SEGMENTS
- TABLE 92. PURECHA GROUP: SERVICE SEGMENTS
- TABLE 93. PURECHA GROUP: PRODUCT PORTFOLIO
- TABLE 94. PURECHA GROUP: KEY STRATERGIES
- TABLE 95. ZHEJIANG KENTE CATALYSTS TECHNOLOGIES CO., LTD.: KEY EXECUTIVES
- TABLE 96. ZHEJIANG KENTE CATALYSTS TECHNOLOGIES CO., LTD.: COMPANY SNAPSHOT
- TABLE 97. ZHEJIANG KENTE CATALYSTS TECHNOLOGIES CO., LTD.: PRODUCT SEGMENTS
- TABLE 98. ZHEJIANG KENTE CATALYSTS TECHNOLOGIES CO., LTD.: SERVICE SEGMENTS
- TABLE 99. ZHEJIANG KENTE CATALYSTS TECHNOLOGIES CO., LTD.: PRODUCT PORTFOLIO
- TABLE 100. ZHEJIANG KENTE CATALYSTS TECHNOLOGIES CO., LTD.: KEY STRATERGIES
- TABLE 101. SAMUH LAXMI CHEMICALS (BOM) P. LTD: KEY EXECUTIVES
- TABLE 102. SAMUH LAXMI CHEMICALS (BOM) P. LTD: COMPANY SNAPSHOT
- TABLE 103. SAMUH LAXMI CHEMICALS (BOM) P. LTD: PRODUCT SEGMENTS
- TABLE 104. SAMUH LAXMI CHEMICALS (BOM) P. LTD: SERVICE SEGMENTS
- TABLE 105. SAMUH LAXMI CHEMICALS (BOM) P. LTD: PRODUCT PORTFOLIO
- TABLE 106. SAMUH LAXMI CHEMICALS (BOM) P. LTD: KEY STRATERGIES
- TABLE 107. RESINS & ALLIED PRODUCTS MAHARASHTRA, INDIA: KEY EXECUTIVES
- TABLE 108. RESINS & ALLIED PRODUCTS MAHARASHTRA, INDIA: COMPANY SNAPSHOT
- TABLE 109. RESINS & ALLIED PRODUCTS MAHARASHTRA, INDIA: PRODUCT SEGMENTS
- TABLE 110. RESINS & ALLIED PRODUCTS MAHARASHTRA, INDIA: SERVICE SEGMENTS
- TABLE 111. RESINS & ALLIED PRODUCTS MAHARASHTRA, INDIA: PRODUCT PORTFOLIO
- TABLE 112. RESINS & ALLIED PRODUCTS MAHARASHTRA, INDIA: KEY STRATERGIES
- TABLE 113. MODY CHEMI PHARMA LTD.: KEY EXECUTIVES
- TABLE 114. MODY CHEMI PHARMA LTD.: COMPANY SNAPSHOT
- TABLE 115. MODY CHEMI PHARMA LTD.: PRODUCT SEGMENTS
- TABLE 116. MODY CHEMI PHARMA LTD.: SERVICE SEGMENTS
- TABLE 117. MODY CHEMI PHARMA LTD.: PRODUCT PORTFOLIO
- TABLE 118. MODY CHEMI PHARMA LTD.: KEY STRATERGIES
LIST OF FIGURES
- FIGURE 01. N-BROMOSUCCINIMIDE MARKET, 2022-2032
- FIGURE 02. SEGMENTATION OF N-BROMOSUCCINIMIDE MARKET,2022-2032
- FIGURE 03. TOP IMPACTING FACTORS IN N-BROMOSUCCINIMIDE MARKET
- FIGURE 04. TOP INVESTMENT POCKETS IN N-BROMOSUCCINIMIDE MARKET (2023-2032)
- FIGURE 05. BARGAINING POWER OF SUPPLIERS
- FIGURE 06. BARGAINING POWER OF BUYERS
- FIGURE 07. THREAT OF SUBSTITUTION
- FIGURE 08. THREAT OF SUBSTITUTION
- FIGURE 09. COMPETITIVE RIVALRY
- FIGURE 10. GLOBAL N-BROMOSUCCINIMIDE MARKET:DRIVERS, RESTRAINTS AND OPPORTUNITIES
- FIGURE 11. IMPACT OF KEY REGULATION: N-BROMOSUCCINIMIDE MARKET
- FIGURE 12. PATENT ANALYSIS BY COMPANY
- FIGURE 13. PATENT ANALYSIS BY COUNTRY
- FIGURE 14. N-BROMOSUCCINIMIDE MARKET, BY CONTENT, 2022 AND 2032(%)
- FIGURE 15. COMPARATIVE SHARE ANALYSIS OF N-BROMOSUCCINIMIDE MARKET FOR CONTENT 99, BY COUNTRY 2022 AND 2032(%)
- FIGURE 16. COMPARATIVE SHARE ANALYSIS OF N-BROMOSUCCINIMIDE MARKET FOR CONTENT 98, BY COUNTRY 2022 AND 2032(%)
- FIGURE 17. N-BROMOSUCCINIMIDE MARKET, BY APPLICATION, 2022 AND 2032(%)
- FIGURE 18. COMPARATIVE SHARE ANALYSIS OF N-BROMOSUCCINIMIDE MARKET FOR PHARMACEUTICAL INDUSTRY, BY COUNTRY 2022 AND 2032(%)
- FIGURE 19. COMPARATIVE SHARE ANALYSIS OF N-BROMOSUCCINIMIDE MARKET FOR PESTICIDES INDUSTRY, BY COUNTRY 2022 AND 2032(%)
- FIGURE 20. COMPARATIVE SHARE ANALYSIS OF N-BROMOSUCCINIMIDE MARKET FOR OTHERS, BY COUNTRY 2022 AND 2032(%)
- FIGURE 21. N-BROMOSUCCINIMIDE MARKET BY REGION, 2022 AND 2032(%)
- FIGURE 22. U.S. N-BROMOSUCCINIMIDE MARKET, 2022-2032 ($MILLION)
- FIGURE 23. CANADA N-BROMOSUCCINIMIDE MARKET, 2022-2032 ($MILLION)
- FIGURE 24. MEXICO N-BROMOSUCCINIMIDE MARKET, 2022-2032 ($MILLION)
- FIGURE 25. GERMANY N-BROMOSUCCINIMIDE MARKET, 2022-2032 ($MILLION)
- FIGURE 26. FRANCE N-BROMOSUCCINIMIDE MARKET, 2022-2032 ($MILLION)
- FIGURE 27. UK N-BROMOSUCCINIMIDE MARKET, 2022-2032 ($MILLION)
- FIGURE 28. SPAIN N-BROMOSUCCINIMIDE MARKET, 2022-2032 ($MILLION)
- FIGURE 29. ITALY N-BROMOSUCCINIMIDE MARKET, 2022-2032 ($MILLION)
- FIGURE 30. REST OF EUROPE N-BROMOSUCCINIMIDE MARKET, 2022-2032 ($MILLION)
- FIGURE 31. CHINA N-BROMOSUCCINIMIDE MARKET, 2022-2032 ($MILLION)
- FIGURE 32. INDIA N-BROMOSUCCINIMIDE MARKET, 2022-2032 ($MILLION)
- FIGURE 33. JAPAN N-BROMOSUCCINIMIDE MARKET, 2022-2032 ($MILLION)
- FIGURE 34. SOUTH KOREA N-BROMOSUCCINIMIDE MARKET, 2022-2032 ($MILLION)
- FIGURE 35. AUSTRALIA N-BROMOSUCCINIMIDE MARKET, 2022-2032 ($MILLION)
- FIGURE 36. REST OF ASIA-PACIFIC N-BROMOSUCCINIMIDE MARKET, 2022-2032 ($MILLION)
- FIGURE 37. BRAZIL N-BROMOSUCCINIMIDE MARKET, 2022-2032 ($MILLION)
- FIGURE 38. SOUTH AFRICA N-BROMOSUCCINIMIDE MARKET, 2022-2032 ($MILLION)
- FIGURE 39. SAUDI ARABI N-BROMOSUCCINIMIDE MARKET, 2022-2032 ($MILLION)
- FIGURE 40. REST OF LAMEA N-BROMOSUCCINIMIDE MARKET, 2022-2032 ($MILLION)
- FIGURE 41. TOP WINNING STRATEGIES, BY YEAR
- FIGURE 42. TOP WINNING STRATEGIES, BY DEVELOPMENT
- FIGURE 43. TOP WINNING STRATEGIES, BY COMPANY
- FIGURE 44. PRODUCT MAPPING OF TOP 10 PLAYERS
- FIGURE 45. COMPETITIVE DASHBOARD
- FIGURE 46. COMPETITIVE HEATMAP: N-BROMOSUCCINIMIDE MARKET
- FIGURE 47. TOP PLAYER POSITIONING, 2022

