
PUBLISHER: Allied Market Research | PRODUCT CODE: 1472275

PUBLISHER: Allied Market Research | PRODUCT CODE: 1472275
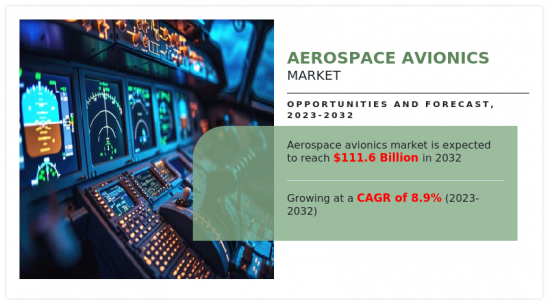
Aerospace Avionics Market By Sub-System, By Fit, By Platform, By End-Use : Global Opportunity Analysis and Industry Forecast, 2023-2032
Aerospace avionics are essential for maintaining flight safety and security. As the aviation industry faces increasing concerns, prioritizing investment in advanced avionics systems has become imperative to improve situational awareness, communication, and navigation capabilities.
Growth in demand for commercial aircraft and a rise in agreements by key players, particularly in emerging economies, are driving the growth of the avionics systems market. For instance, in October 2023, Garmin entered into a lasting agreement to supply BETA Technologies with its cutting-edge Garmin G3000(R) integrated flight deck for the CX300 electric fixed-wing and A250 electric vertical takeoff and landing (eVTOL) aircraft.
The G3000 offers high-resolution displays and advanced communication, navigation, and surveillance air traffic management capabilities. Its lightweight, flexible open system architecture seamlessly integrates with BETA's flight control, propulsion, and battery management systems.
The rapid integration of artificial intelligence (AI) and machine learning (ML) technologies into avionics systems is bolstering automation, predictive maintenance, and decision-making capabilities. Additionally, the development of more efficient and compact avionics components, such as electronically steered antennas, is reducing weight and enhancing fuel efficiency. The widespread adoption of connectivity solutions facilitates real-time data sharing, thereby improving situational awareness and passenger experience. Moreover, sustainability is emerging as a key concern, with a major emphasis on eco-friendly avionics technologies to mitigate emissions and environmental impacts. These trends collectively drive consumer demand toward smarter, more connected, and environmentally responsible avionics systems.
The global aerospace avionics market was affected by the COVID-19 pandemic, which led to disturbances in the supply chain and production procedures. The dynamics of the market were impacted by fluctuating demand and economic uncertainty. Despite these obstacles, the market quickly rebounded due to the defense industry's increased investment in the purchase of aerial, land, and marine vehicles for its aerospace avionics. Furthermore, the increasing demand for data analytics in avionics systems drives the market in this region.
The market is propelled by the surge in demand for new commercial aircraft, driven by fleet expansion and modernization initiatives undertaken by regional airlines. Furthermore, the growing collaboration among aircraft maintenance, repair, and operations (MRO) providers is projected to enhance their technical expertise, enabling them to cater to the servicing needs of the latest-generation aircraft acquired by airlines. This is due to the significantly larger size and higher installation costs associated with avionics systems on widebody aircraft compared to narrowbody aircraft.
The growing demand for avionics systems equipped with advanced communication and navigation features is anticipated to contribute to the revenue growth of the market throughout the forecast period. This increased demand spans various sectors, including military, aerospace, and defense, thereby driving the development of cutting-edge avionics systems, and fueling the global expansion of the aerospace avionics market.
Moreover, the escalating focus on integrating robust cybersecurity measures into avionics systems to mitigate cyber threats is projected to further boost market revenue growth during the forecast period. The increasing demand for advanced avionics systems aimed at enhancing aircraft operational efficiency and reducing operational expenses is on the rise. Moreover, there is anticipation that the growing focus on unmanned aerial vehicles (UAVs) development and the escalating investments in advanced avionics systems development will offer significant opportunities for market players.
For instance, in May 2022, Boeing launched the new 777-8 freighter and expanded its market-leading 777X and freighter families of jetliners with orders for up to 50 aircraft from Qatar Airways. In addition, in January 2022, Honeywell launched Anthem; a cloud-connected integrated avionics system. It improves flight efficiency, operations, safety, and comfort. Such factors are propelling the need for aerospace avionics market during the forecast period of 2022-2032.
The aerospace avionics market is segmented into subsystem, platform, fit, end-use and region. On the basis of subsystem, the market is bifurcated into flight management systems, flight control systems, health monitoring systems, electrical & emergency systems and communication, navigation, and surveillance systems. On the basis of platform, the market is divided into military aviation, commercial aviation, general aviation and special mission aviation. On the basis of fit the market is classified into retrofit and forward fit. On the basis of end-use, it is divided into OEM and aftermarket.
Region wise, the aerospace avionics market trends are analyzed across North America (U.S., Canada, and Mexico), Europe (UK, Germany, France, Russia, Italy, Spain and rest of Europe), Asia-Pacific (China, India, Japan, Australia, South Korea, and rest of Asia-Pacific), Latin America (Brazil, Argentina and Rest of Latin America) and Middle East and Africa(Saudi Arabia, UAE, Israel and Africa).
Competitive analysis and profiles of the major global aerospace avionics market players that have been provided in the report include Raytheon Technologies Corporation; Honeywell International Inc.; L3 Harris Technologies; BAE Systems; Thales Group; Curtis Wright Corporation; Northrop Grumman; Safran SA; Leonardo S.P.A, Elbit Systems Ltd. The key strategies adopted by the major players of the global market are product launch, mergers, and acquisitions.
Key Benefits For Stakeholders
- This report provides a quantitative analysis of the market segments, current trends, estimations, and dynamics of the aerospace avionics market analysis from 2022 to 2032 to identify the prevailing aerospace avionics market opportunities.
- The market research is offered along with information related to key drivers, restraints, and opportunities.
- Porter's five forces analysis highlights the potency of buyers and suppliers to enable stakeholders make profit-oriented business decisions and strengthen their supplier-buyer network.
- In-depth analysis of the aerospace avionics market segmentation assists to determine the prevailing market opportunities.
- Major countries in each region are mapped according to their revenue contribution to the global market.
- Market player positioning facilitates benchmarking and provides a clear understanding of the present position of the market players.
- The report includes the analysis of the regional as well as global aerospace avionics market trends, key players, market segments, application areas, and market growth strategies.
Additional benefits you will get with this purchase are:
- Quarterly Update and* (only available with a corporate license, on listed price)
- 5 additional Company Profile of client Choice pre- or Post-purchase, as a free update.
- Free Upcoming Version on the Purchase of Five and Enterprise User License.
- 16 analyst hours of support* (post-purchase, if you find additional data requirements upon review of the report, you may receive support amounting to 16 analyst hours to solve questions, and post-sale queries)
- 15% Free Customization* (in case the scope or segment of the report does not match your requirements, 15% is equivalent to 3 working days of free work, applicable once)
- Free data Pack on the Five and Enterprise User License. (Excel version of the report)
- Free Updated report if the report is 6-12 months old or older.
- 24-hour priority response*
- Free Industry updates and white papers.
Possible Customization with this report (with additional cost and timeline, please talk to the sales executive to know more)
- Product Benchmarking / Product specification and applications
- New Product Development/ Product Matrix of Key Players
- Import Export Analysis/Data
Key Market Segments
By Sub-System
- Communication, Navigation, and Surveillance Systems
- Flight Management Systems
- Flight Control Systems
- Health Monitoring Systems
- Electrical and Emergency Systems
By Fit
- Retrofit
- Forward Fit
By Platform
- Commerical Aviation
- Military Aviation
- Special Mission Aviation
- General Aviation
By End-Use
- OEM
- Aftermarket
By Region
- North America
- U.S.
- Canada
- Mexico
- Europe
- UK
- Germany
- France
- Russia
- Italy
- Spain
- Rest of Europe
- Asia-Pacific
- China
- India
- Japan
- Australia
- South Korea
- Rest of Asia-Pacific
- Latin America
- Brazil
- Argentina
- Rest of Latin America
- Middle East and Africa
- Saudi Arabia
- UAE
- Israel
- Africa
Key Market Players:
- Raytheon Technologies Corporation
- Honeywell International Inc.
- L3 Harris Technologies
- BAE Systems
- Thales Group
- Curtis Wright Corporation
- Northrop Grumman
- Safran SA
- Leonardo S.P.A
- ELBIT SYSTEMS LTD.
TABLE OF CONTENTS
CHAPTER 1: INTRODUCTION
- 1.1. Report description
- 1.2. Key market segments
- 1.3. Key benefits to the stakeholders
- 1.4. Research methodology
- 1.4.1. Primary research
- 1.4.2. Secondary research
- 1.4.3. Analyst tools and models
CHAPTER 2: EXECUTIVE SUMMARY
- 2.1. CXO perspective
CHAPTER 3: MARKET OVERVIEW
- 3.1. Market definition and scope
- 3.2. Key findings
- 3.2.1. Top impacting factors
- 3.2.2. Top investment pockets
- 3.3. Porter's five forces analysis
- 3.4. Market dynamics
- 3.4.1. Drivers
- 3.4.2. Restraints
- 3.4.3. Opportunities
CHAPTER 4: AEROSPACE AVIONICS MARKET, BY SUB-SYSTEM
- 4.1. Overview
- 4.1.1. Market size and forecast
- 4.2. Flight Management Systems
- 4.2.1. Key market trends, growth factors and opportunities
- 4.2.2. Market size and forecast, by region
- 4.2.3. Market share analysis by country
- 4.3. Flight Control Systems
- 4.3.1. Key market trends, growth factors and opportunities
- 4.3.2. Market size and forecast, by region
- 4.3.3. Market share analysis by country
- 4.4. Health Monitoring Systems
- 4.4.1. Key market trends, growth factors and opportunities
- 4.4.2. Market size and forecast, by region
- 4.4.3. Market share analysis by country
- 4.5. Electrical and Emergency Systems
- 4.5.1. Key market trends, growth factors and opportunities
- 4.5.2. Market size and forecast, by region
- 4.5.3. Market share analysis by country
- 4.6. Communication, Navigation, and Surveillance Systems
- 4.6.1. Key market trends, growth factors and opportunities
- 4.6.2. Market size and forecast, by region
- 4.6.3. Market share analysis by country
CHAPTER 5: AEROSPACE AVIONICS MARKET, BY FIT
- 5.1. Overview
- 5.1.1. Market size and forecast
- 5.2. Retrofit
- 5.2.1. Key market trends, growth factors and opportunities
- 5.2.2. Market size and forecast, by region
- 5.2.3. Market share analysis by country
- 5.3. Forward Fit
- 5.3.1. Key market trends, growth factors and opportunities
- 5.3.2. Market size and forecast, by region
- 5.3.3. Market share analysis by country
CHAPTER 6: AEROSPACE AVIONICS MARKET, BY PLATFORM
- 6.1. Overview
- 6.1.1. Market size and forecast
- 6.2. Commerical Aviation
- 6.2.1. Key market trends, growth factors and opportunities
- 6.2.2. Market size and forecast, by region
- 6.2.3. Market share analysis by country
- 6.3. Military Aviation
- 6.3.1. Key market trends, growth factors and opportunities
- 6.3.2. Market size and forecast, by region
- 6.3.3. Market share analysis by country
- 6.4. Special Mission Aviation
- 6.4.1. Key market trends, growth factors and opportunities
- 6.4.2. Market size and forecast, by region
- 6.4.3. Market share analysis by country
- 6.5. General Aviation
- 6.5.1. Key market trends, growth factors and opportunities
- 6.5.2. Market size and forecast, by region
- 6.5.3. Market share analysis by country
CHAPTER 7: AEROSPACE AVIONICS MARKET, BY END-USE
- 7.1. Overview
- 7.1.1. Market size and forecast
- 7.2. OEM
- 7.2.1. Key market trends, growth factors and opportunities
- 7.2.2. Market size and forecast, by region
- 7.2.3. Market share analysis by country
- 7.3. Aftermarket
- 7.3.1. Key market trends, growth factors and opportunities
- 7.3.2. Market size and forecast, by region
- 7.3.3. Market share analysis by country
CHAPTER 8: AEROSPACE AVIONICS MARKET, BY REGION
- 8.1. Overview
- 8.1.1. Market size and forecast By Region
- 8.2. North America
- 8.2.1. Key market trends, growth factors and opportunities
- 8.2.2. Market size and forecast, by Sub-System
- 8.2.3. Market size and forecast, by Fit
- 8.2.4. Market size and forecast, by Platform
- 8.2.5. Market size and forecast, by End-Use
- 8.2.6. Market size and forecast, by country
- 8.2.6.1. U.S.
- 8.2.6.1.1. Market size and forecast, by Sub-System
- 8.2.6.1.2. Market size and forecast, by Fit
- 8.2.6.1.3. Market size and forecast, by Platform
- 8.2.6.1.4. Market size and forecast, by End-Use
- 8.2.6.2. Canada
- 8.2.6.2.1. Market size and forecast, by Sub-System
- 8.2.6.2.2. Market size and forecast, by Fit
- 8.2.6.2.3. Market size and forecast, by Platform
- 8.2.6.2.4. Market size and forecast, by End-Use
- 8.2.6.3. Mexico
- 8.2.6.3.1. Market size and forecast, by Sub-System
- 8.2.6.3.2. Market size and forecast, by Fit
- 8.2.6.3.3. Market size and forecast, by Platform
- 8.2.6.3.4. Market size and forecast, by End-Use
- 8.3. Europe
- 8.3.1. Key market trends, growth factors and opportunities
- 8.3.2. Market size and forecast, by Sub-System
- 8.3.3. Market size and forecast, by Fit
- 8.3.4. Market size and forecast, by Platform
- 8.3.5. Market size and forecast, by End-Use
- 8.3.6. Market size and forecast, by country
- 8.3.6.1. UK
- 8.3.6.1.1. Market size and forecast, by Sub-System
- 8.3.6.1.2. Market size and forecast, by Fit
- 8.3.6.1.3. Market size and forecast, by Platform
- 8.3.6.1.4. Market size and forecast, by End-Use
- 8.3.6.2. Germany
- 8.3.6.2.1. Market size and forecast, by Sub-System
- 8.3.6.2.2. Market size and forecast, by Fit
- 8.3.6.2.3. Market size and forecast, by Platform
- 8.3.6.2.4. Market size and forecast, by End-Use
- 8.3.6.3. France
- 8.3.6.3.1. Market size and forecast, by Sub-System
- 8.3.6.3.2. Market size and forecast, by Fit
- 8.3.6.3.3. Market size and forecast, by Platform
- 8.3.6.3.4. Market size and forecast, by End-Use
- 8.3.6.4. Russia
- 8.3.6.4.1. Market size and forecast, by Sub-System
- 8.3.6.4.2. Market size and forecast, by Fit
- 8.3.6.4.3. Market size and forecast, by Platform
- 8.3.6.4.4. Market size and forecast, by End-Use
- 8.3.6.5. Italy
- 8.3.6.5.1. Market size and forecast, by Sub-System
- 8.3.6.5.2. Market size and forecast, by Fit
- 8.3.6.5.3. Market size and forecast, by Platform
- 8.3.6.5.4. Market size and forecast, by End-Use
- 8.3.6.6. Spain
- 8.3.6.6.1. Market size and forecast, by Sub-System
- 8.3.6.6.2. Market size and forecast, by Fit
- 8.3.6.6.3. Market size and forecast, by Platform
- 8.3.6.6.4. Market size and forecast, by End-Use
- 8.3.6.7. Rest of Europe
- 8.3.6.7.1. Market size and forecast, by Sub-System
- 8.3.6.7.2. Market size and forecast, by Fit
- 8.3.6.7.3. Market size and forecast, by Platform
- 8.3.6.7.4. Market size and forecast, by End-Use
- 8.4. Asia-Pacific
- 8.4.1. Key market trends, growth factors and opportunities
- 8.4.2. Market size and forecast, by Sub-System
- 8.4.3. Market size and forecast, by Fit
- 8.4.4. Market size and forecast, by Platform
- 8.4.5. Market size and forecast, by End-Use
- 8.4.6. Market size and forecast, by country
- 8.4.6.1. China
- 8.4.6.1.1. Market size and forecast, by Sub-System
- 8.4.6.1.2. Market size and forecast, by Fit
- 8.4.6.1.3. Market size and forecast, by Platform
- 8.4.6.1.4. Market size and forecast, by End-Use
- 8.4.6.2. India
- 8.4.6.2.1. Market size and forecast, by Sub-System
- 8.4.6.2.2. Market size and forecast, by Fit
- 8.4.6.2.3. Market size and forecast, by Platform
- 8.4.6.2.4. Market size and forecast, by End-Use
- 8.4.6.3. Japan
- 8.4.6.3.1. Market size and forecast, by Sub-System
- 8.4.6.3.2. Market size and forecast, by Fit
- 8.4.6.3.3. Market size and forecast, by Platform
- 8.4.6.3.4. Market size and forecast, by End-Use
- 8.4.6.4. Australia
- 8.4.6.4.1. Market size and forecast, by Sub-System
- 8.4.6.4.2. Market size and forecast, by Fit
- 8.4.6.4.3. Market size and forecast, by Platform
- 8.4.6.4.4. Market size and forecast, by End-Use
- 8.4.6.5. South Korea
- 8.4.6.5.1. Market size and forecast, by Sub-System
- 8.4.6.5.2. Market size and forecast, by Fit
- 8.4.6.5.3. Market size and forecast, by Platform
- 8.4.6.5.4. Market size and forecast, by End-Use
- 8.4.6.6. Rest of Asia-Pacific
- 8.4.6.6.1. Market size and forecast, by Sub-System
- 8.4.6.6.2. Market size and forecast, by Fit
- 8.4.6.6.3. Market size and forecast, by Platform
- 8.4.6.6.4. Market size and forecast, by End-Use
- 8.5. Latin America
- 8.5.1. Key market trends, growth factors and opportunities
- 8.5.2. Market size and forecast, by Sub-System
- 8.5.3. Market size and forecast, by Fit
- 8.5.4. Market size and forecast, by Platform
- 8.5.5. Market size and forecast, by End-Use
- 8.5.6. Market size and forecast, by country
- 8.5.6.1. Brazil
- 8.5.6.1.1. Market size and forecast, by Sub-System
- 8.5.6.1.2. Market size and forecast, by Fit
- 8.5.6.1.3. Market size and forecast, by Platform
- 8.5.6.1.4. Market size and forecast, by End-Use
- 8.5.6.2. Argentina
- 8.5.6.2.1. Market size and forecast, by Sub-System
- 8.5.6.2.2. Market size and forecast, by Fit
- 8.5.6.2.3. Market size and forecast, by Platform
- 8.5.6.2.4. Market size and forecast, by End-Use
- 8.5.6.3. Rest of Latin America
- 8.5.6.3.1. Market size and forecast, by Sub-System
- 8.5.6.3.2. Market size and forecast, by Fit
- 8.5.6.3.3. Market size and forecast, by Platform
- 8.5.6.3.4. Market size and forecast, by End-Use
- 8.6. Middle East and Africa
- 8.6.1. Key market trends, growth factors and opportunities
- 8.6.2. Market size and forecast, by Sub-System
- 8.6.3. Market size and forecast, by Fit
- 8.6.4. Market size and forecast, by Platform
- 8.6.5. Market size and forecast, by End-Use
- 8.6.6. Market size and forecast, by country
- 8.6.6.1. Saudi Arabia
- 8.6.6.1.1. Market size and forecast, by Sub-System
- 8.6.6.1.2. Market size and forecast, by Fit
- 8.6.6.1.3. Market size and forecast, by Platform
- 8.6.6.1.4. Market size and forecast, by End-Use
- 8.6.6.2. UAE
- 8.6.6.2.1. Market size and forecast, by Sub-System
- 8.6.6.2.2. Market size and forecast, by Fit
- 8.6.6.2.3. Market size and forecast, by Platform
- 8.6.6.2.4. Market size and forecast, by End-Use
- 8.6.6.3. Israel
- 8.6.6.3.1. Market size and forecast, by Sub-System
- 8.6.6.3.2. Market size and forecast, by Fit
- 8.6.6.3.3. Market size and forecast, by Platform
- 8.6.6.3.4. Market size and forecast, by End-Use
- 8.6.6.4. Africa
- 8.6.6.4.1. Market size and forecast, by Sub-System
- 8.6.6.4.2. Market size and forecast, by Fit
- 8.6.6.4.3. Market size and forecast, by Platform
- 8.6.6.4.4. Market size and forecast, by End-Use
CHAPTER 9: COMPETITIVE LANDSCAPE
- 9.1. Introduction
- 9.2. Top winning strategies
- 9.3. Product mapping of top 10 player
- 9.4. Competitive dashboard
- 9.5. Competitive heatmap
- 9.6. Top player positioning, 2022
CHAPTER 10: COMPANY PROFILES
- 10.1. Raytheon Technologies Corporation
- 10.1.1. Company overview
- 10.1.2. Key executives
- 10.1.3. Company snapshot
- 10.1.4. Operating business segments
- 10.1.5. Product portfolio
- 10.1.6. Business performance
- 10.1.7. Key strategic moves and developments
- 10.2. Honeywell International Inc.
- 10.2.1. Company overview
- 10.2.2. Key executives
- 10.2.3. Company snapshot
- 10.2.4. Operating business segments
- 10.2.5. Product portfolio
- 10.2.6. Business performance
- 10.2.7. Key strategic moves and developments
- 10.3. L3 Harris Technologies
- 10.3.1. Company overview
- 10.3.2. Key executives
- 10.3.3. Company snapshot
- 10.3.4. Operating business segments
- 10.3.5. Product portfolio
- 10.3.6. Business performance
- 10.3.7. Key strategic moves and developments
- 10.4. BAE Systems
- 10.4.1. Company overview
- 10.4.2. Key executives
- 10.4.3. Company snapshot
- 10.4.4. Operating business segments
- 10.4.5. Product portfolio
- 10.4.6. Business performance
- 10.4.7. Key strategic moves and developments
- 10.5. Thales Group
- 10.5.1. Company overview
- 10.5.2. Key executives
- 10.5.3. Company snapshot
- 10.5.4. Operating business segments
- 10.5.5. Product portfolio
- 10.5.6. Business performance
- 10.5.7. Key strategic moves and developments
- 10.6. Curtis Wright Corporation
- 10.6.1. Company overview
- 10.6.2. Key executives
- 10.6.3. Company snapshot
- 10.6.4. Operating business segments
- 10.6.5. Product portfolio
- 10.6.6. Business performance
- 10.6.7. Key strategic moves and developments
- 10.7. Northrop Grumman
- 10.7.1. Company overview
- 10.7.2. Key executives
- 10.7.3. Company snapshot
- 10.7.4. Operating business segments
- 10.7.5. Product portfolio
- 10.7.6. Business performance
- 10.7.7. Key strategic moves and developments
- 10.8. Safran SA
- 10.8.1. Company overview
- 10.8.2. Key executives
- 10.8.3. Company snapshot
- 10.8.4. Operating business segments
- 10.8.5. Product portfolio
- 10.8.6. Business performance
- 10.8.7. Key strategic moves and developments
- 10.9. Leonardo S.P.A
- 10.9.1. Company overview
- 10.9.2. Key executives
- 10.9.3. Company snapshot
- 10.9.4. Operating business segments
- 10.9.5. Product portfolio
- 10.9.6. Business performance
- 10.9.7. Key strategic moves and developments
- 10.10. ELBIT SYSTEMS LTD.
- 10.10.1. Company overview
- 10.10.2. Key executives
- 10.10.3. Company snapshot
- 10.10.4. Operating business segments
- 10.10.5. Product portfolio
- 10.10.6. Business performance
- 10.10.7. Key strategic moves and developments
LIST OF TABLES
- TABLE 01. GLOBAL AEROSPACE AVIONICS MARKET, BY SUB-SYSTEM, 2022-2032 ($BILLION)
- TABLE 02. AEROSPACE AVIONICS MARKET FOR FLIGHT MANAGEMENT SYSTEMS, BY REGION, 2022-2032 ($BILLION)
- TABLE 03. AEROSPACE AVIONICS MARKET FOR FLIGHT CONTROL SYSTEMS, BY REGION, 2022-2032 ($BILLION)
- TABLE 04. AEROSPACE AVIONICS MARKET FOR HEALTH MONITORING SYSTEMS, BY REGION, 2022-2032 ($BILLION)
- TABLE 05. AEROSPACE AVIONICS MARKET FOR ELECTRICAL AND EMERGENCY SYSTEMS, BY REGION, 2022-2032 ($BILLION)
- TABLE 06. AEROSPACE AVIONICS MARKET FOR COMMUNICATION, NAVIGATION, AND SURVEILLANCE SYSTEMS, BY REGION, 2022-2032 ($BILLION)
- TABLE 07. GLOBAL AEROSPACE AVIONICS MARKET, BY FIT, 2022-2032 ($BILLION)
- TABLE 08. AEROSPACE AVIONICS MARKET FOR RETROFIT, BY REGION, 2022-2032 ($BILLION)
- TABLE 09. AEROSPACE AVIONICS MARKET FOR FORWARD FIT, BY REGION, 2022-2032 ($BILLION)
- TABLE 10. GLOBAL AEROSPACE AVIONICS MARKET, BY PLATFORM, 2022-2032 ($BILLION)
- TABLE 11. AEROSPACE AVIONICS MARKET FOR COMMERICAL AVIATION, BY REGION, 2022-2032 ($BILLION)
- TABLE 12. AEROSPACE AVIONICS MARKET FOR MILITARY AVIATION, BY REGION, 2022-2032 ($BILLION)
- TABLE 13. AEROSPACE AVIONICS MARKET FOR SPECIAL MISSION AVIATION, BY REGION, 2022-2032 ($BILLION)
- TABLE 14. AEROSPACE AVIONICS MARKET FOR GENERAL AVIATION, BY REGION, 2022-2032 ($BILLION)
- TABLE 15. GLOBAL AEROSPACE AVIONICS MARKET, BY END-USE, 2022-2032 ($BILLION)
- TABLE 16. AEROSPACE AVIONICS MARKET FOR OEM, BY REGION, 2022-2032 ($BILLION)
- TABLE 17. AEROSPACE AVIONICS MARKET FOR AFTERMARKET, BY REGION, 2022-2032 ($BILLION)
- TABLE 18. AEROSPACE AVIONICS MARKET, BY REGION, 2022-2032 ($BILLION)
- TABLE 19. NORTH AMERICA AEROSPACE AVIONICS MARKET, BY SUB-SYSTEM, 2022-2032 ($BILLION)
- TABLE 20. NORTH AMERICA AEROSPACE AVIONICS MARKET, BY FIT, 2022-2032 ($BILLION)
- TABLE 21. NORTH AMERICA AEROSPACE AVIONICS MARKET, BY PLATFORM, 2022-2032 ($BILLION)
- TABLE 22. NORTH AMERICA AEROSPACE AVIONICS MARKET, BY END-USE, 2022-2032 ($BILLION)
- TABLE 23. NORTH AMERICA AEROSPACE AVIONICS MARKET, BY COUNTRY, 2022-2032 ($BILLION)
- TABLE 24. U.S. AEROSPACE AVIONICS MARKET, BY SUB-SYSTEM, 2022-2032 ($BILLION)
- TABLE 25. U.S. AEROSPACE AVIONICS MARKET, BY FIT, 2022-2032 ($BILLION)
- TABLE 26. U.S. AEROSPACE AVIONICS MARKET, BY PLATFORM, 2022-2032 ($BILLION)
- TABLE 27. U.S. AEROSPACE AVIONICS MARKET, BY END-USE, 2022-2032 ($BILLION)
- TABLE 28. CANADA AEROSPACE AVIONICS MARKET, BY SUB-SYSTEM, 2022-2032 ($BILLION)
- TABLE 29. CANADA AEROSPACE AVIONICS MARKET, BY FIT, 2022-2032 ($BILLION)
- TABLE 30. CANADA AEROSPACE AVIONICS MARKET, BY PLATFORM, 2022-2032 ($BILLION)
- TABLE 31. CANADA AEROSPACE AVIONICS MARKET, BY END-USE, 2022-2032 ($BILLION)
- TABLE 32. MEXICO AEROSPACE AVIONICS MARKET, BY SUB-SYSTEM, 2022-2032 ($BILLION)
- TABLE 33. MEXICO AEROSPACE AVIONICS MARKET, BY FIT, 2022-2032 ($BILLION)
- TABLE 34. MEXICO AEROSPACE AVIONICS MARKET, BY PLATFORM, 2022-2032 ($BILLION)
- TABLE 35. MEXICO AEROSPACE AVIONICS MARKET, BY END-USE, 2022-2032 ($BILLION)
- TABLE 36. EUROPE AEROSPACE AVIONICS MARKET, BY SUB-SYSTEM, 2022-2032 ($BILLION)
- TABLE 37. EUROPE AEROSPACE AVIONICS MARKET, BY FIT, 2022-2032 ($BILLION)
- TABLE 38. EUROPE AEROSPACE AVIONICS MARKET, BY PLATFORM, 2022-2032 ($BILLION)
- TABLE 39. EUROPE AEROSPACE AVIONICS MARKET, BY END-USE, 2022-2032 ($BILLION)
- TABLE 40. EUROPE AEROSPACE AVIONICS MARKET, BY COUNTRY, 2022-2032 ($BILLION)
- TABLE 41. UK AEROSPACE AVIONICS MARKET, BY SUB-SYSTEM, 2022-2032 ($BILLION)
- TABLE 42. UK AEROSPACE AVIONICS MARKET, BY FIT, 2022-2032 ($BILLION)
- TABLE 43. UK AEROSPACE AVIONICS MARKET, BY PLATFORM, 2022-2032 ($BILLION)
- TABLE 44. UK AEROSPACE AVIONICS MARKET, BY END-USE, 2022-2032 ($BILLION)
- TABLE 45. GERMANY AEROSPACE AVIONICS MARKET, BY SUB-SYSTEM, 2022-2032 ($BILLION)
- TABLE 46. GERMANY AEROSPACE AVIONICS MARKET, BY FIT, 2022-2032 ($BILLION)
- TABLE 47. GERMANY AEROSPACE AVIONICS MARKET, BY PLATFORM, 2022-2032 ($BILLION)
- TABLE 48. GERMANY AEROSPACE AVIONICS MARKET, BY END-USE, 2022-2032 ($BILLION)
- TABLE 49. FRANCE AEROSPACE AVIONICS MARKET, BY SUB-SYSTEM, 2022-2032 ($BILLION)
- TABLE 50. FRANCE AEROSPACE AVIONICS MARKET, BY FIT, 2022-2032 ($BILLION)
- TABLE 51. FRANCE AEROSPACE AVIONICS MARKET, BY PLATFORM, 2022-2032 ($BILLION)
- TABLE 52. FRANCE AEROSPACE AVIONICS MARKET, BY END-USE, 2022-2032 ($BILLION)
- TABLE 53. RUSSIA AEROSPACE AVIONICS MARKET, BY SUB-SYSTEM, 2022-2032 ($BILLION)
- TABLE 54. RUSSIA AEROSPACE AVIONICS MARKET, BY FIT, 2022-2032 ($BILLION)
- TABLE 55. RUSSIA AEROSPACE AVIONICS MARKET, BY PLATFORM, 2022-2032 ($BILLION)
- TABLE 56. RUSSIA AEROSPACE AVIONICS MARKET, BY END-USE, 2022-2032 ($BILLION)
- TABLE 57. ITALY AEROSPACE AVIONICS MARKET, BY SUB-SYSTEM, 2022-2032 ($BILLION)
- TABLE 58. ITALY AEROSPACE AVIONICS MARKET, BY FIT, 2022-2032 ($BILLION)
- TABLE 59. ITALY AEROSPACE AVIONICS MARKET, BY PLATFORM, 2022-2032 ($BILLION)
- TABLE 60. ITALY AEROSPACE AVIONICS MARKET, BY END-USE, 2022-2032 ($BILLION)
- TABLE 61. SPAIN AEROSPACE AVIONICS MARKET, BY SUB-SYSTEM, 2022-2032 ($BILLION)
- TABLE 62. SPAIN AEROSPACE AVIONICS MARKET, BY FIT, 2022-2032 ($BILLION)
- TABLE 63. SPAIN AEROSPACE AVIONICS MARKET, BY PLATFORM, 2022-2032 ($BILLION)
- TABLE 64. SPAIN AEROSPACE AVIONICS MARKET, BY END-USE, 2022-2032 ($BILLION)
- TABLE 65. REST OF EUROPE AEROSPACE AVIONICS MARKET, BY SUB-SYSTEM, 2022-2032 ($BILLION)
- TABLE 66. REST OF EUROPE AEROSPACE AVIONICS MARKET, BY FIT, 2022-2032 ($BILLION)
- TABLE 67. REST OF EUROPE AEROSPACE AVIONICS MARKET, BY PLATFORM, 2022-2032 ($BILLION)
- TABLE 68. REST OF EUROPE AEROSPACE AVIONICS MARKET, BY END-USE, 2022-2032 ($BILLION)
- TABLE 69. ASIA-PACIFIC AEROSPACE AVIONICS MARKET, BY SUB-SYSTEM, 2022-2032 ($BILLION)
- TABLE 70. ASIA-PACIFIC AEROSPACE AVIONICS MARKET, BY FIT, 2022-2032 ($BILLION)
- TABLE 71. ASIA-PACIFIC AEROSPACE AVIONICS MARKET, BY PLATFORM, 2022-2032 ($BILLION)
- TABLE 72. ASIA-PACIFIC AEROSPACE AVIONICS MARKET, BY END-USE, 2022-2032 ($BILLION)
- TABLE 73. ASIA-PACIFIC AEROSPACE AVIONICS MARKET, BY COUNTRY, 2022-2032 ($BILLION)
- TABLE 74. CHINA AEROSPACE AVIONICS MARKET, BY SUB-SYSTEM, 2022-2032 ($BILLION)
- TABLE 75. CHINA AEROSPACE AVIONICS MARKET, BY FIT, 2022-2032 ($BILLION)
- TABLE 76. CHINA AEROSPACE AVIONICS MARKET, BY PLATFORM, 2022-2032 ($BILLION)
- TABLE 77. CHINA AEROSPACE AVIONICS MARKET, BY END-USE, 2022-2032 ($BILLION)
- TABLE 78. INDIA AEROSPACE AVIONICS MARKET, BY SUB-SYSTEM, 2022-2032 ($BILLION)
- TABLE 79. INDIA AEROSPACE AVIONICS MARKET, BY FIT, 2022-2032 ($BILLION)
- TABLE 80. INDIA AEROSPACE AVIONICS MARKET, BY PLATFORM, 2022-2032 ($BILLION)
- TABLE 81. INDIA AEROSPACE AVIONICS MARKET, BY END-USE, 2022-2032 ($BILLION)
- TABLE 82. JAPAN AEROSPACE AVIONICS MARKET, BY SUB-SYSTEM, 2022-2032 ($BILLION)
- TABLE 83. JAPAN AEROSPACE AVIONICS MARKET, BY FIT, 2022-2032 ($BILLION)
- TABLE 84. JAPAN AEROSPACE AVIONICS MARKET, BY PLATFORM, 2022-2032 ($BILLION)
- TABLE 85. JAPAN AEROSPACE AVIONICS MARKET, BY END-USE, 2022-2032 ($BILLION)
- TABLE 86. AUSTRALIA AEROSPACE AVIONICS MARKET, BY SUB-SYSTEM, 2022-2032 ($BILLION)
- TABLE 87. AUSTRALIA AEROSPACE AVIONICS MARKET, BY FIT, 2022-2032 ($BILLION)
- TABLE 88. AUSTRALIA AEROSPACE AVIONICS MARKET, BY PLATFORM, 2022-2032 ($BILLION)
- TABLE 89. AUSTRALIA AEROSPACE AVIONICS MARKET, BY END-USE, 2022-2032 ($BILLION)
- TABLE 90. SOUTH KOREA AEROSPACE AVIONICS MARKET, BY SUB-SYSTEM, 2022-2032 ($BILLION)
- TABLE 91. SOUTH KOREA AEROSPACE AVIONICS MARKET, BY FIT, 2022-2032 ($BILLION)
- TABLE 92. SOUTH KOREA AEROSPACE AVIONICS MARKET, BY PLATFORM, 2022-2032 ($BILLION)
- TABLE 93. SOUTH KOREA AEROSPACE AVIONICS MARKET, BY END-USE, 2022-2032 ($BILLION)
- TABLE 94. REST OF ASIA-PACIFIC AEROSPACE AVIONICS MARKET, BY SUB-SYSTEM, 2022-2032 ($BILLION)
- TABLE 95. REST OF ASIA-PACIFIC AEROSPACE AVIONICS MARKET, BY FIT, 2022-2032 ($BILLION)
- TABLE 96. REST OF ASIA-PACIFIC AEROSPACE AVIONICS MARKET, BY PLATFORM, 2022-2032 ($BILLION)
- TABLE 97. REST OF ASIA-PACIFIC AEROSPACE AVIONICS MARKET, BY END-USE, 2022-2032 ($BILLION)
- TABLE 98. LATIN AMERICA AEROSPACE AVIONICS MARKET, BY SUB-SYSTEM, 2022-2032 ($BILLION)
- TABLE 99. LATIN AMERICA AEROSPACE AVIONICS MARKET, BY FIT, 2022-2032 ($BILLION)
- TABLE 100. LATIN AMERICA AEROSPACE AVIONICS MARKET, BY PLATFORM, 2022-2032 ($BILLION)
- TABLE 101. LATIN AMERICA AEROSPACE AVIONICS MARKET, BY END-USE, 2022-2032 ($BILLION)
- TABLE 102. LATIN AMERICA AEROSPACE AVIONICS MARKET, BY COUNTRY, 2022-2032 ($BILLION)
- TABLE 103. BRAZIL AEROSPACE AVIONICS MARKET, BY SUB-SYSTEM, 2022-2032 ($BILLION)
- TABLE 104. BRAZIL AEROSPACE AVIONICS MARKET, BY FIT, 2022-2032 ($BILLION)
- TABLE 105. BRAZIL AEROSPACE AVIONICS MARKET, BY PLATFORM, 2022-2032 ($BILLION)
- TABLE 106. BRAZIL AEROSPACE AVIONICS MARKET, BY END-USE, 2022-2032 ($BILLION)
- TABLE 107. ARGENTINA AEROSPACE AVIONICS MARKET, BY SUB-SYSTEM, 2022-2032 ($BILLION)
- TABLE 108. ARGENTINA AEROSPACE AVIONICS MARKET, BY FIT, 2022-2032 ($BILLION)
- TABLE 109. ARGENTINA AEROSPACE AVIONICS MARKET, BY PLATFORM, 2022-2032 ($BILLION)
- TABLE 110. ARGENTINA AEROSPACE AVIONICS MARKET, BY END-USE, 2022-2032 ($BILLION)
- TABLE 111. REST OF LATIN AMERICA AEROSPACE AVIONICS MARKET, BY SUB-SYSTEM, 2022-2032 ($BILLION)
- TABLE 112. REST OF LATIN AMERICA AEROSPACE AVIONICS MARKET, BY FIT, 2022-2032 ($BILLION)
- TABLE 113. REST OF LATIN AMERICA AEROSPACE AVIONICS MARKET, BY PLATFORM, 2022-2032 ($BILLION)
- TABLE 114. REST OF LATIN AMERICA AEROSPACE AVIONICS MARKET, BY END-USE, 2022-2032 ($BILLION)
- TABLE 115. MIDDLE EAST AND AFRICA AEROSPACE AVIONICS MARKET, BY SUB-SYSTEM, 2022-2032 ($BILLION)
- TABLE 116. MIDDLE EAST AND AFRICA AEROSPACE AVIONICS MARKET, BY FIT, 2022-2032 ($BILLION)
- TABLE 117. MIDDLE EAST AND AFRICA AEROSPACE AVIONICS MARKET, BY PLATFORM, 2022-2032 ($BILLION)
- TABLE 118. MIDDLE EAST AND AFRICA AEROSPACE AVIONICS MARKET, BY END-USE, 2022-2032 ($BILLION)
- TABLE 119. MIDDLE EAST AND AFRICA AEROSPACE AVIONICS MARKET, BY COUNTRY, 2022-2032 ($BILLION)
- TABLE 120. SAUDI ARABIA AEROSPACE AVIONICS MARKET, BY SUB-SYSTEM, 2022-2032 ($BILLION)
- TABLE 121. SAUDI ARABIA AEROSPACE AVIONICS MARKET, BY FIT, 2022-2032 ($BILLION)
- TABLE 122. SAUDI ARABIA AEROSPACE AVIONICS MARKET, BY PLATFORM, 2022-2032 ($BILLION)
- TABLE 123. SAUDI ARABIA AEROSPACE AVIONICS MARKET, BY END-USE, 2022-2032 ($BILLION)
- TABLE 124. UAE AEROSPACE AVIONICS MARKET, BY SUB-SYSTEM, 2022-2032 ($BILLION)
- TABLE 125. UAE AEROSPACE AVIONICS MARKET, BY FIT, 2022-2032 ($BILLION)
- TABLE 126. UAE AEROSPACE AVIONICS MARKET, BY PLATFORM, 2022-2032 ($BILLION)
- TABLE 127. UAE AEROSPACE AVIONICS MARKET, BY END-USE, 2022-2032 ($BILLION)
- TABLE 128. ISRAEL AEROSPACE AVIONICS MARKET, BY SUB-SYSTEM, 2022-2032 ($BILLION)
- TABLE 129. ISRAEL AEROSPACE AVIONICS MARKET, BY FIT, 2022-2032 ($BILLION)
- TABLE 130. ISRAEL AEROSPACE AVIONICS MARKET, BY PLATFORM, 2022-2032 ($BILLION)
- TABLE 131. ISRAEL AEROSPACE AVIONICS MARKET, BY END-USE, 2022-2032 ($BILLION)
- TABLE 132. AFRICA AEROSPACE AVIONICS MARKET, BY SUB-SYSTEM, 2022-2032 ($BILLION)
- TABLE 133. AFRICA AEROSPACE AVIONICS MARKET, BY FIT, 2022-2032 ($BILLION)
- TABLE 134. AFRICA AEROSPACE AVIONICS MARKET, BY PLATFORM, 2022-2032 ($BILLION)
- TABLE 135. AFRICA AEROSPACE AVIONICS MARKET, BY END-USE, 2022-2032 ($BILLION)
- TABLE 136. RAYTHEON TECHNOLOGIES CORPORATION: KEY EXECUTIVES
- TABLE 137. RAYTHEON TECHNOLOGIES CORPORATION: COMPANY SNAPSHOT
- TABLE 138. RAYTHEON TECHNOLOGIES CORPORATION: PRODUCT SEGMENTS
- TABLE 139. RAYTHEON TECHNOLOGIES CORPORATION: SERVICE SEGMENTS
- TABLE 140. RAYTHEON TECHNOLOGIES CORPORATION: PRODUCT PORTFOLIO
- TABLE 141. RAYTHEON TECHNOLOGIES CORPORATION: KEY STRATERGIES
- TABLE 142. HONEYWELL INTERNATIONAL INC.: KEY EXECUTIVES
- TABLE 143. HONEYWELL INTERNATIONAL INC.: COMPANY SNAPSHOT
- TABLE 144. HONEYWELL INTERNATIONAL INC.: PRODUCT SEGMENTS
- TABLE 145. HONEYWELL INTERNATIONAL INC.: SERVICE SEGMENTS
- TABLE 146. HONEYWELL INTERNATIONAL INC.: PRODUCT PORTFOLIO
- TABLE 147. HONEYWELL INTERNATIONAL INC.: KEY STRATERGIES
- TABLE 148. L3 HARRIS TECHNOLOGIES: KEY EXECUTIVES
- TABLE 149. L3 HARRIS TECHNOLOGIES: COMPANY SNAPSHOT
- TABLE 150. L3 HARRIS TECHNOLOGIES: PRODUCT SEGMENTS
- TABLE 151. L3 HARRIS TECHNOLOGIES: SERVICE SEGMENTS
- TABLE 152. L3 HARRIS TECHNOLOGIES: PRODUCT PORTFOLIO
- TABLE 153. L3 HARRIS TECHNOLOGIES: KEY STRATERGIES
- TABLE 154. BAE SYSTEMS: KEY EXECUTIVES
- TABLE 155. BAE SYSTEMS: COMPANY SNAPSHOT
- TABLE 156. BAE SYSTEMS: PRODUCT SEGMENTS
- TABLE 157. BAE SYSTEMS: SERVICE SEGMENTS
- TABLE 158. BAE SYSTEMS: PRODUCT PORTFOLIO
- TABLE 159. BAE SYSTEMS: KEY STRATERGIES
- TABLE 160. THALES GROUP: KEY EXECUTIVES
- TABLE 161. THALES GROUP: COMPANY SNAPSHOT
- TABLE 162. THALES GROUP: PRODUCT SEGMENTS
- TABLE 163. THALES GROUP: SERVICE SEGMENTS
- TABLE 164. THALES GROUP: PRODUCT PORTFOLIO
- TABLE 165. THALES GROUP: KEY STRATERGIES
- TABLE 166. CURTIS WRIGHT CORPORATION: KEY EXECUTIVES
- TABLE 167. CURTIS WRIGHT CORPORATION: COMPANY SNAPSHOT
- TABLE 168. CURTIS WRIGHT CORPORATION: PRODUCT SEGMENTS
- TABLE 169. CURTIS WRIGHT CORPORATION: SERVICE SEGMENTS
- TABLE 170. CURTIS WRIGHT CORPORATION: PRODUCT PORTFOLIO
- TABLE 171. CURTIS WRIGHT CORPORATION: KEY STRATERGIES
- TABLE 172. NORTHROP GRUMMAN: KEY EXECUTIVES
- TABLE 173. NORTHROP GRUMMAN: COMPANY SNAPSHOT
- TABLE 174. NORTHROP GRUMMAN: PRODUCT SEGMENTS
- TABLE 175. NORTHROP GRUMMAN: SERVICE SEGMENTS
- TABLE 176. NORTHROP GRUMMAN: PRODUCT PORTFOLIO
- TABLE 177. NORTHROP GRUMMAN: KEY STRATERGIES
- TABLE 178. SAFRAN SA: KEY EXECUTIVES
- TABLE 179. SAFRAN SA: COMPANY SNAPSHOT
- TABLE 180. SAFRAN SA: PRODUCT SEGMENTS
- TABLE 181. SAFRAN SA: SERVICE SEGMENTS
- TABLE 182. SAFRAN SA: PRODUCT PORTFOLIO
- TABLE 183. SAFRAN SA: KEY STRATERGIES
- TABLE 184. LEONARDO S.P.A: KEY EXECUTIVES
- TABLE 185. LEONARDO S.P.A: COMPANY SNAPSHOT
- TABLE 186. LEONARDO S.P.A: PRODUCT SEGMENTS
- TABLE 187. LEONARDO S.P.A: SERVICE SEGMENTS
- TABLE 188. LEONARDO S.P.A: PRODUCT PORTFOLIO
- TABLE 189. LEONARDO S.P.A: KEY STRATERGIES
- TABLE 190. ELBIT SYSTEMS LTD.: KEY EXECUTIVES
- TABLE 191. ELBIT SYSTEMS LTD.: COMPANY SNAPSHOT
- TABLE 192. ELBIT SYSTEMS LTD.: PRODUCT SEGMENTS
- TABLE 193. ELBIT SYSTEMS LTD.: SERVICE SEGMENTS
- TABLE 194. ELBIT SYSTEMS LTD.: PRODUCT PORTFOLIO
- TABLE 195. ELBIT SYSTEMS LTD.: KEY STRATERGIES
LIST OF FIGURES
- FIGURE 01. AEROSPACE AVIONICS MARKET, 2022-2032
- FIGURE 02. SEGMENTATION OF AEROSPACE AVIONICS MARKET,2022-2032
- FIGURE 03. TOP IMPACTING FACTORS IN AEROSPACE AVIONICS MARKET
- FIGURE 04. TOP INVESTMENT POCKETS IN AEROSPACE AVIONICS MARKET (2023-2032)
- FIGURE 05. BARGAINING POWER OF SUPPLIERS
- FIGURE 06. BARGAINING POWER OF BUYERS
- FIGURE 07. THREAT OF SUBSTITUTION
- FIGURE 08. THREAT OF SUBSTITUTION
- FIGURE 09. COMPETITIVE RIVALRY
- FIGURE 10. GLOBAL AEROSPACE AVIONICS MARKET:DRIVERS, RESTRAINTS AND OPPORTUNITIES
- FIGURE 11. AEROSPACE AVIONICS MARKET, BY SUB-SYSTEM, 2022 AND 2032(%)
- FIGURE 12. COMPARATIVE SHARE ANALYSIS OF AEROSPACE AVIONICS MARKET FOR FLIGHT MANAGEMENT SYSTEMS, BY COUNTRY 2022 AND 2032(%)
- FIGURE 13. COMPARATIVE SHARE ANALYSIS OF AEROSPACE AVIONICS MARKET FOR FLIGHT CONTROL SYSTEMS, BY COUNTRY 2022 AND 2032(%)
- FIGURE 14. COMPARATIVE SHARE ANALYSIS OF AEROSPACE AVIONICS MARKET FOR HEALTH MONITORING SYSTEMS, BY COUNTRY 2022 AND 2032(%)
- FIGURE 15. COMPARATIVE SHARE ANALYSIS OF AEROSPACE AVIONICS MARKET FOR ELECTRICAL AND EMERGENCY SYSTEMS, BY COUNTRY 2022 AND 2032(%)
- FIGURE 16. COMPARATIVE SHARE ANALYSIS OF AEROSPACE AVIONICS MARKET FOR COMMUNICATION, NAVIGATION, AND SURVEILLANCE SYSTEMS, BY COUNTRY 2022 AND 2032(%)
- FIGURE 17. AEROSPACE AVIONICS MARKET, BY FIT, 2022 AND 2032(%)
- FIGURE 18. COMPARATIVE SHARE ANALYSIS OF AEROSPACE AVIONICS MARKET FOR RETROFIT, BY COUNTRY 2022 AND 2032(%)
- FIGURE 19. COMPARATIVE SHARE ANALYSIS OF AEROSPACE AVIONICS MARKET FOR FORWARD FIT, BY COUNTRY 2022 AND 2032(%)
- FIGURE 20. AEROSPACE AVIONICS MARKET, BY PLATFORM, 2022 AND 2032(%)
- FIGURE 21. COMPARATIVE SHARE ANALYSIS OF AEROSPACE AVIONICS MARKET FOR COMMERICAL AVIATION, BY COUNTRY 2022 AND 2032(%)
- FIGURE 22. COMPARATIVE SHARE ANALYSIS OF AEROSPACE AVIONICS MARKET FOR MILITARY AVIATION, BY COUNTRY 2022 AND 2032(%)
- FIGURE 23. COMPARATIVE SHARE ANALYSIS OF AEROSPACE AVIONICS MARKET FOR SPECIAL MISSION AVIATION, BY COUNTRY 2022 AND 2032(%)
- FIGURE 24. COMPARATIVE SHARE ANALYSIS OF AEROSPACE AVIONICS MARKET FOR GENERAL AVIATION, BY COUNTRY 2022 AND 2032(%)
- FIGURE 25. AEROSPACE AVIONICS MARKET, BY END-USE, 2022 AND 2032(%)
- FIGURE 26. COMPARATIVE SHARE ANALYSIS OF AEROSPACE AVIONICS MARKET FOR OEM, BY COUNTRY 2022 AND 2032(%)
- FIGURE 27. COMPARATIVE SHARE ANALYSIS OF AEROSPACE AVIONICS MARKET FOR AFTERMARKET, BY COUNTRY 2022 AND 2032(%)
- FIGURE 28. AEROSPACE AVIONICS MARKET BY REGION, 2022 AND 2032(%)
- FIGURE 29. U.S. AEROSPACE AVIONICS MARKET, 2022-2032 ($BILLION)
- FIGURE 30. CANADA AEROSPACE AVIONICS MARKET, 2022-2032 ($BILLION)
- FIGURE 31. MEXICO AEROSPACE AVIONICS MARKET, 2022-2032 ($BILLION)
- FIGURE 32. UK AEROSPACE AVIONICS MARKET, 2022-2032 ($BILLION)
- FIGURE 33. GERMANY AEROSPACE AVIONICS MARKET, 2022-2032 ($BILLION)
- FIGURE 34. FRANCE AEROSPACE AVIONICS MARKET, 2022-2032 ($BILLION)
- FIGURE 35. RUSSIA AEROSPACE AVIONICS MARKET, 2022-2032 ($BILLION)
- FIGURE 36. ITALY AEROSPACE AVIONICS MARKET, 2022-2032 ($BILLION)
- FIGURE 37. SPAIN AEROSPACE AVIONICS MARKET, 2022-2032 ($BILLION)
- FIGURE 38. REST OF EUROPE AEROSPACE AVIONICS MARKET, 2022-2032 ($BILLION)
- FIGURE 39. CHINA AEROSPACE AVIONICS MARKET, 2022-2032 ($BILLION)
- FIGURE 40. INDIA AEROSPACE AVIONICS MARKET, 2022-2032 ($BILLION)
- FIGURE 41. JAPAN AEROSPACE AVIONICS MARKET, 2022-2032 ($BILLION)
- FIGURE 42. AUSTRALIA AEROSPACE AVIONICS MARKET, 2022-2032 ($BILLION)
- FIGURE 43. SOUTH KOREA AEROSPACE AVIONICS MARKET, 2022-2032 ($BILLION)
- FIGURE 44. REST OF ASIA-PACIFIC AEROSPACE AVIONICS MARKET, 2022-2032 ($BILLION)
- FIGURE 45. BRAZIL AEROSPACE AVIONICS MARKET, 2022-2032 ($BILLION)
- FIGURE 46. ARGENTINA AEROSPACE AVIONICS MARKET, 2022-2032 ($BILLION)
- FIGURE 47. REST OF LATIN AMERICA AEROSPACE AVIONICS MARKET, 2022-2032 ($BILLION)
- FIGURE 48. SAUDI ARABIA AEROSPACE AVIONICS MARKET, 2022-2032 ($BILLION)
- FIGURE 49. UAE AEROSPACE AVIONICS MARKET, 2022-2032 ($BILLION)
- FIGURE 50. ISRAEL AEROSPACE AVIONICS MARKET, 2022-2032 ($BILLION)
- FIGURE 51. AFRICA AEROSPACE AVIONICS MARKET, 2022-2032 ($BILLION)
- FIGURE 52. TOP WINNING STRATEGIES, BY YEAR
- FIGURE 53. TOP WINNING STRATEGIES, BY DEVELOPMENT
- FIGURE 54. TOP WINNING STRATEGIES, BY COMPANY
- FIGURE 55. PRODUCT MAPPING OF TOP 10 PLAYERS
- FIGURE 56. COMPETITIVE DASHBOARD
- FIGURE 57. COMPETITIVE HEATMAP: AEROSPACE AVIONICS MARKET
- FIGURE 58. TOP PLAYER POSITIONING, 2022

