
PUBLISHER: Allied Market Research | PRODUCT CODE: 1472225

PUBLISHER: Allied Market Research | PRODUCT CODE: 1472225
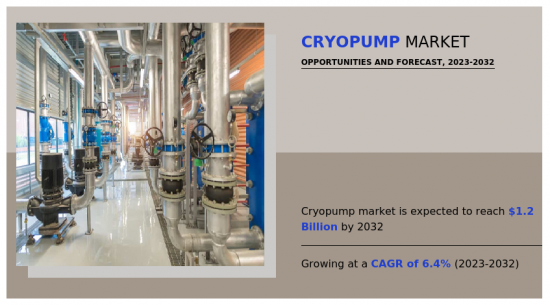
Cryopump Market By Configuration, By Cooldown Duration, By Crossover Rating : Global Opportunity Analysis and Industry Forecast, 2023-2032
The Cryopump market was valued at $580.2 million in 2020 and is projected to reach $1,239.3 million by 2032, registering a CAGR of 6.4% from 2023 to 2032. A cryopump is a kind of vacuum pump used to acquire and keep extremely-high vacuum (UHV) in engineering and scientific research sectors, as well as manufacturing industry. A cryopump works at the principle of cryogenic cooling, condensing and receiving air from a vacuum chamber at very low temperatures. Cryopumps are highly suitable for a wide range of applications requiring vacuum state ranging from 10-3 Pa to 1-9 Pa, especially in environments where oil-free and rapid gas extraction are paramount.
The growth in the market is primarily due to the rapid growth in semiconductor production facilities, medical facilities, and research facilities. The electronics industry is evolving rapidly as public and private entities are increasing investments in developing new and improved electronic components. For instance, in June 2022, Samsung began production of 3-nanometer chips. Similarly, in August 2022, Taiwan Semiconductor Manufacturing Company Limited announced that it would also start production of 3-nanometer chips, and had already started R&D on 1.4-nanometer chip technology. In addition, the integration of semiconductor components in a chip is also evolving, to reduce the IC size, while making it more power efficient. the U.S. government under President Biden's administration has brought in the Innovation and Competition Act and intends to spend $52 billion on the semiconductors sector. Similarly, the Indian government in December 2021 approved a $10 billion package for the semiconductor industry.
Furthermore, governments in developed countries allocate significant funds towards research and development (R&D) to position themselves as leaders in various industrial domains. In recent years, there has been a growing recognition of the importance of having a robust R&D infrastructure, prompting many developing nations to allocate substantial resources towards its development. This trend has subsequently driven the demand for cryopumps. For instance, in India, the Gross Expenditure on Research and Development (GERD) has shown a consistent upward trajectory, increasing from $133.7 billion in 2010-2011 to $155.34 billion in 2020-2021. Similarly, China has witnessed a steady rise in research and development expenditure. In 2022, China's investment in R&D continued to grow, surpassing $421 billion, with an annual increase of over 10%, as reported by the National Bureau of Statistics.Cryopumps play a crucial role in various research activities across industries such as pharmaceuticals, semiconductors, and physics. In healthcare, cryopumps are utilized in medical imaging equipment that requires vacuum environments. As these industries evolve and R&D spending increases, the demand for cryopumps is expected to rise accordingly.
The Cryopump market is segmented on the basis of configuration, cooldown duration, and crossover rating. By configuration, the market is categorized into straight and flat. On the basis of cooldown duration, it is bifurcated into 90 minutes and less, and More than 90 minutes. As per crossover rating, the market is categorized into less than 250 Torr-Liter, 250-500 Torr-Liter, and More than 500 Torr-Liter. Region wise, the market is analyzed across North America, Europe, Asia-Pacific, Latin America, and Middle East & Africa. The major players that operate in the global market have adopted key strategies such as product launch and product development to strengthen their market outreach and sustain the stiff competition in the market. For example, in February 2023, Atlas Copco acquired service and sales distributor Zeus Co Ltd. in South Korea. This move will help Atlas to further expand its foothold in the country in a more efficient manner.
Competition Analysis
Competitive analysis and profiles of the major players in the Cryopump market, such as SHI Cryogenics Group, Trillium, Leybold Products GmbH, Edward Vacuum (Atlas Copco), Ulvac Cryogenics, Inc., Pfeiffer Vacuum GmbH, Vacree Technologies Co.,Ltd, Ebra Corporation, Nikkiso, and Elliott Group, are provided in this report.
Key benefits for stakeholders
- The report provides an extensive analysis of the current and emerging global Cryopump market trends.
- In-depth global Cryopump market analysis is conducted by constructing market estimations for key market segments between 2020 and 2032.
- Extensive analysis of the global Cryopump market is conducted by following key product positioning and monitoring of top competitors within the market framework.
- A comprehensive analysis of all the regions is provided to determine the prevailing opportunities.
- The global Cryopump market revenue and volume forecast analysis from 2023 to 2032 is included in the report.
- The key players within the global Cryopump market are profiled in this report and their strategies are analyzed thoroughly, which helps understand the competitive outlook of the global Cryopump industry.
Additional benefits you will get with this purchase are:
- Quarterly Update and* (only available with a corporate license, on listed price)
- 5 additional Company Profile of client Choice pre- or Post-purchase, as a free update.
- Free Upcoming Version on the Purchase of Five and Enterprise User License.
- 16 analyst hours of support* (post-purchase, if you find additional data requirements upon review of the report, you may receive support amounting to 16 analyst hours to solve questions, and post-sale queries)
- 15% Free Customization* (in case the scope or segment of the report does not match your requirements, 15% is equivalent to 3 working days of free work, applicable once)
- Free data Pack on the Five and Enterprise User License. (Excel version of the report)
- Free Updated report if the report is 6-12 months old or older.
- 24-hour priority response*
- Free Industry updates and white papers.
Possible Customization with this report (with additional cost and timeline, please talk to the sales executive to know more)
- Manufacturing Capacity
- Go To Market Strategy
- Market share analysis of players by products/segments
- New Product Development/ Product Matrix of Key Players
- Additional company profiles with specific to client's interest
- Additional country or region analysis- market size and forecast
- Average Selling Price Analysis / Price Point Analysis
- Brands Share Analysis
- Criss-cross segment analysis- market size and forecast
- Expanded list for Company Profiles
- Historic market data
- Import Export Analysis/Data
- Key player details (including location, contact details, supplier/vendor network etc. in excel format)
- List of customers/consumers/raw material suppliers- value chain analysis
- Market share analysis of players at global/region/country level
- SWOT Analysis
- Volume Market Size and Forecast
Key Market Segments
By Configuration
- Straight
- Flat
By Cooldown Duration
- 90 Minutes or Less
- More than 90 Minutes
By Crossover Rating
- Less Than 250 Torr-Liters
- 250-500 Torr-Liters
- More than 500 Torr-Liters
By Region
- North America
- U.S.
- Canada
- Mexico
- Europe
- Germany
- France
- UK
- Italy
- Rest of Europe
- Asia-Pacific
- China
- Japan
- South Korea
- India
- Rest of Asia-Pacific
- Latin America
- Brazil
- Argentina
- Colombia
- Rest of Latin America
- Middle East and Africa
- Saudi Arabia
- UAE
- Nigeria
- Egypt
- Rest of Middle East And Africa
Key Market Players:
- SHI Cryogenics Group
- Trillium
- Leybold Products GmbH
- Atlas Copco AB
- Ulvac Cryogenics, Inc.
- Pfeiffer Vacuum GmbH
- Vacree Technologies Co.,Ltd
- Ebra Corporation
- Nikkiso
- Nikkiso Co., Ltd
- Elliott Group, LLC.
TABLE OF CONTENTS
CHAPTER 1: INTRODUCTION
- 1.1. Report description
- 1.2. Key market segments
- 1.3. Key benefits to the stakeholders
- 1.4. Research methodology
- 1.4.1. Primary research
- 1.4.2. Secondary research
- 1.4.3. Analyst tools and models
CHAPTER 2: EXECUTIVE SUMMARY
- 2.1. CXO perspective
CHAPTER 3: MARKET OVERVIEW
- 3.1. Market definition and scope
- 3.2. Key findings
- 3.2.1. Top impacting factors
- 3.2.2. Top investment pockets
- 3.3. Porter's five forces analysis
- 3.4. Market dynamics
- 3.4.1. Drivers
- 3.4.2. Restraints
- 3.4.3. Opportunities
CHAPTER 4: CRYOPUMP MARKET, BY CONFIGURATION
- 4.1. Overview
- 4.1.1. Market size and forecast
- 4.2. Straight
- 4.2.1. Key market trends, growth factors and opportunities
- 4.2.2. Market size and forecast, by region
- 4.2.3. Market share analysis by country
- 4.3. Flat
- 4.3.1. Key market trends, growth factors and opportunities
- 4.3.2. Market size and forecast, by region
- 4.3.3. Market share analysis by country
CHAPTER 5: CRYOPUMP MARKET, BY COOLDOWN DURATION
- 5.1. Overview
- 5.1.1. Market size and forecast
- 5.2. 90 Minutes or Less
- 5.2.1. Key market trends, growth factors and opportunities
- 5.2.2. Market size and forecast, by region
- 5.2.3. Market share analysis by country
- 5.3. More than 90 Minutes
- 5.3.1. Key market trends, growth factors and opportunities
- 5.3.2. Market size and forecast, by region
- 5.3.3. Market share analysis by country
CHAPTER 6: CRYOPUMP MARKET, BY CROSSOVER RATING
- 6.1. Overview
- 6.1.1. Market size and forecast
- 6.2. Less Than 250 Torr-Liters
- 6.2.1. Key market trends, growth factors and opportunities
- 6.2.2. Market size and forecast, by region
- 6.2.3. Market share analysis by country
- 6.3. 250-500 Torr-Liters
- 6.3.1. Key market trends, growth factors and opportunities
- 6.3.2. Market size and forecast, by region
- 6.3.3. Market share analysis by country
- 6.4. More than 500 Torr-Liters
- 6.4.1. Key market trends, growth factors and opportunities
- 6.4.2. Market size and forecast, by region
- 6.4.3. Market share analysis by country
CHAPTER 7: CRYOPUMP MARKET, BY REGION
- 7.1. Overview
- 7.1.1. Market size and forecast By Region
- 7.2. North America
- 7.2.1. Key market trends, growth factors and opportunities
- 7.2.2. Market size and forecast, by Configuration
- 7.2.3. Market size and forecast, by Cooldown Duration
- 7.2.4. Market size and forecast, by Crossover Rating
- 7.2.5. Market size and forecast, by country
- 7.2.5.1. U.S.
- 7.2.5.1.1. Market size and forecast, by Configuration
- 7.2.5.1.2. Market size and forecast, by Cooldown Duration
- 7.2.5.1.3. Market size and forecast, by Crossover Rating
- 7.2.5.2. Canada
- 7.2.5.2.1. Market size and forecast, by Configuration
- 7.2.5.2.2. Market size and forecast, by Cooldown Duration
- 7.2.5.2.3. Market size and forecast, by Crossover Rating
- 7.2.5.3. Mexico
- 7.2.5.3.1. Market size and forecast, by Configuration
- 7.2.5.3.2. Market size and forecast, by Cooldown Duration
- 7.2.5.3.3. Market size and forecast, by Crossover Rating
- 7.3. Europe
- 7.3.1. Key market trends, growth factors and opportunities
- 7.3.2. Market size and forecast, by Configuration
- 7.3.3. Market size and forecast, by Cooldown Duration
- 7.3.4. Market size and forecast, by Crossover Rating
- 7.3.5. Market size and forecast, by country
- 7.3.5.1. Germany
- 7.3.5.1.1. Market size and forecast, by Configuration
- 7.3.5.1.2. Market size and forecast, by Cooldown Duration
- 7.3.5.1.3. Market size and forecast, by Crossover Rating
- 7.3.5.2. France
- 7.3.5.2.1. Market size and forecast, by Configuration
- 7.3.5.2.2. Market size and forecast, by Cooldown Duration
- 7.3.5.2.3. Market size and forecast, by Crossover Rating
- 7.3.5.3. UK
- 7.3.5.3.1. Market size and forecast, by Configuration
- 7.3.5.3.2. Market size and forecast, by Cooldown Duration
- 7.3.5.3.3. Market size and forecast, by Crossover Rating
- 7.3.5.4. Italy
- 7.3.5.4.1. Market size and forecast, by Configuration
- 7.3.5.4.2. Market size and forecast, by Cooldown Duration
- 7.3.5.4.3. Market size and forecast, by Crossover Rating
- 7.3.5.5. Rest of Europe
- 7.3.5.5.1. Market size and forecast, by Configuration
- 7.3.5.5.2. Market size and forecast, by Cooldown Duration
- 7.3.5.5.3. Market size and forecast, by Crossover Rating
- 7.4. Asia-Pacific
- 7.4.1. Key market trends, growth factors and opportunities
- 7.4.2. Market size and forecast, by Configuration
- 7.4.3. Market size and forecast, by Cooldown Duration
- 7.4.4. Market size and forecast, by Crossover Rating
- 7.4.5. Market size and forecast, by country
- 7.4.5.1. China
- 7.4.5.1.1. Market size and forecast, by Configuration
- 7.4.5.1.2. Market size and forecast, by Cooldown Duration
- 7.4.5.1.3. Market size and forecast, by Crossover Rating
- 7.4.5.2. Japan
- 7.4.5.2.1. Market size and forecast, by Configuration
- 7.4.5.2.2. Market size and forecast, by Cooldown Duration
- 7.4.5.2.3. Market size and forecast, by Crossover Rating
- 7.4.5.3. South Korea
- 7.4.5.3.1. Market size and forecast, by Configuration
- 7.4.5.3.2. Market size and forecast, by Cooldown Duration
- 7.4.5.3.3. Market size and forecast, by Crossover Rating
- 7.4.5.4. India
- 7.4.5.4.1. Market size and forecast, by Configuration
- 7.4.5.4.2. Market size and forecast, by Cooldown Duration
- 7.4.5.4.3. Market size and forecast, by Crossover Rating
- 7.4.5.5. Rest of Asia-Pacific
- 7.4.5.5.1. Market size and forecast, by Configuration
- 7.4.5.5.2. Market size and forecast, by Cooldown Duration
- 7.4.5.5.3. Market size and forecast, by Crossover Rating
- 7.5. Latin America
- 7.5.1. Key market trends, growth factors and opportunities
- 7.5.2. Market size and forecast, by Configuration
- 7.5.3. Market size and forecast, by Cooldown Duration
- 7.5.4. Market size and forecast, by Crossover Rating
- 7.5.5. Market size and forecast, by country
- 7.5.5.1. Brazil
- 7.5.5.1.1. Market size and forecast, by Configuration
- 7.5.5.1.2. Market size and forecast, by Cooldown Duration
- 7.5.5.1.3. Market size and forecast, by Crossover Rating
- 7.5.5.2. Argentina
- 7.5.5.2.1. Market size and forecast, by Configuration
- 7.5.5.2.2. Market size and forecast, by Cooldown Duration
- 7.5.5.2.3. Market size and forecast, by Crossover Rating
- 7.5.5.3. Colombia
- 7.5.5.3.1. Market size and forecast, by Configuration
- 7.5.5.3.2. Market size and forecast, by Cooldown Duration
- 7.5.5.3.3. Market size and forecast, by Crossover Rating
- 7.5.5.4. Rest of Latin America
- 7.5.5.4.1. Market size and forecast, by Configuration
- 7.5.5.4.2. Market size and forecast, by Cooldown Duration
- 7.5.5.4.3. Market size and forecast, by Crossover Rating
- 7.6. Middle East and Africa
- 7.6.1. Key market trends, growth factors and opportunities
- 7.6.2. Market size and forecast, by Configuration
- 7.6.3. Market size and forecast, by Cooldown Duration
- 7.6.4. Market size and forecast, by Crossover Rating
- 7.6.5. Market size and forecast, by country
- 7.6.5.1. Saudi Arabia
- 7.6.5.1.1. Market size and forecast, by Configuration
- 7.6.5.1.2. Market size and forecast, by Cooldown Duration
- 7.6.5.1.3. Market size and forecast, by Crossover Rating
- 7.6.5.2. UAE
- 7.6.5.2.1. Market size and forecast, by Configuration
- 7.6.5.2.2. Market size and forecast, by Cooldown Duration
- 7.6.5.2.3. Market size and forecast, by Crossover Rating
- 7.6.5.3. Nigeria
- 7.6.5.3.1. Market size and forecast, by Configuration
- 7.6.5.3.2. Market size and forecast, by Cooldown Duration
- 7.6.5.3.3. Market size and forecast, by Crossover Rating
- 7.6.5.4. Egypt
- 7.6.5.4.1. Market size and forecast, by Configuration
- 7.6.5.4.2. Market size and forecast, by Cooldown Duration
- 7.6.5.4.3. Market size and forecast, by Crossover Rating
- 7.6.5.5. Rest of Middle East And Africa
- 7.6.5.5.1. Market size and forecast, by Configuration
- 7.6.5.5.2. Market size and forecast, by Cooldown Duration
- 7.6.5.5.3. Market size and forecast, by Crossover Rating
CHAPTER 8: COMPETITIVE LANDSCAPE
- 8.1. Introduction
- 8.2. Top winning strategies
- 8.3. Product mapping of top 10 player
- 8.4. Competitive dashboard
- 8.5. Competitive heatmap
- 8.6. Top player positioning, 2020
CHAPTER 9: COMPANY PROFILES
- 9.1. SHI Cryogenics Group
- 9.1.1. Company overview
- 9.1.2. Key executives
- 9.1.3. Company snapshot
- 9.1.4. Operating business segments
- 9.1.5. Product portfolio
- 9.1.6. Business performance
- 9.1.7. Key strategic moves and developments
- 9.2. Trillium
- 9.2.1. Company overview
- 9.2.2. Key executives
- 9.2.3. Company snapshot
- 9.2.4. Operating business segments
- 9.2.5. Product portfolio
- 9.2.6. Business performance
- 9.2.7. Key strategic moves and developments
- 9.3. Leybold Products GmbH
- 9.3.1. Company overview
- 9.3.2. Key executives
- 9.3.3. Company snapshot
- 9.3.4. Operating business segments
- 9.3.5. Product portfolio
- 9.3.6. Business performance
- 9.3.7. Key strategic moves and developments
- 9.4. Atlas Copco AB
- 9.4.1. Company overview
- 9.4.2. Key executives
- 9.4.3. Company snapshot
- 9.4.4. Operating business segments
- 9.4.5. Product portfolio
- 9.4.6. Business performance
- 9.4.7. Key strategic moves and developments
- 9.5. Ulvac Cryogenics, Inc.
- 9.5.1. Company overview
- 9.5.2. Key executives
- 9.5.3. Company snapshot
- 9.5.4. Operating business segments
- 9.5.5. Product portfolio
- 9.5.6. Business performance
- 9.5.7. Key strategic moves and developments
- 9.6. Pfeiffer Vacuum GmbH
- 9.6.1. Company overview
- 9.6.2. Key executives
- 9.6.3. Company snapshot
- 9.6.4. Operating business segments
- 9.6.5. Product portfolio
- 9.6.6. Business performance
- 9.6.7. Key strategic moves and developments
- 9.7. Vacree Technologies Co.,Ltd
- 9.7.1. Company overview
- 9.7.2. Key executives
- 9.7.3. Company snapshot
- 9.7.4. Operating business segments
- 9.7.5. Product portfolio
- 9.7.6. Business performance
- 9.7.7. Key strategic moves and developments
- 9.8. Ebra Corporation
- 9.8.1. Company overview
- 9.8.2. Key executives
- 9.8.3. Company snapshot
- 9.8.4. Operating business segments
- 9.8.5. Product portfolio
- 9.8.6. Business performance
- 9.8.7. Key strategic moves and developments
- 9.9. Nikkiso
- 9.9.1. Company overview
- 9.9.2. Key executives
- 9.9.3. Company snapshot
- 9.9.4. Operating business segments
- 9.9.5. Product portfolio
- 9.9.6. Business performance
- 9.9.7. Key strategic moves and developments
- 9.10. Nikkiso Co., Ltd
- 9.10.1. Company overview
- 9.10.2. Key executives
- 9.10.3. Company snapshot
- 9.10.4. Operating business segments
- 9.10.5. Product portfolio
- 9.10.6. Business performance
- 9.10.7. Key strategic moves and developments
- 9.11. Elliott Group, LLC.
- 9.11.1. Company overview
- 9.11.2. Key executives
- 9.11.3. Company snapshot
- 9.11.4. Operating business segments
- 9.11.5. Product portfolio
- 9.11.6. Business performance
- 9.11.7. Key strategic moves and developments
LIST OF TABLES
- TABLE 01. GLOBAL CRYOPUMP MARKET, BY CONFIGURATION, 2020-2032 ($MILLION)
- TABLE 02. CRYOPUMP MARKET FOR STRAIGHT, BY REGION, 2020-2032 ($MILLION)
- TABLE 03. CRYOPUMP MARKET FOR FLAT, BY REGION, 2020-2032 ($MILLION)
- TABLE 04. GLOBAL CRYOPUMP MARKET, BY COOLDOWN DURATION, 2020-2032 ($MILLION)
- TABLE 05. CRYOPUMP MARKET FOR 90 MINUTES OR LESS, BY REGION, 2020-2032 ($MILLION)
- TABLE 06. CRYOPUMP MARKET FOR MORE THAN 90 MINUTES, BY REGION, 2020-2032 ($MILLION)
- TABLE 07. GLOBAL CRYOPUMP MARKET, BY CROSSOVER RATING, 2020-2032 ($MILLION)
- TABLE 08. CRYOPUMP MARKET FOR LESS THAN 250 TORR-LITERS, BY REGION, 2020-2032 ($MILLION)
- TABLE 09. CRYOPUMP MARKET FOR 250-500 TORR-LITERS, BY REGION, 2020-2032 ($MILLION)
- TABLE 10. CRYOPUMP MARKET FOR MORE THAN 500 TORR-LITERS, BY REGION, 2020-2032 ($MILLION)
- TABLE 11. CRYOPUMP MARKET, BY REGION, 2020-2032 ($MILLION)
- TABLE 12. NORTH AMERICA CRYOPUMP MARKET, BY CONFIGURATION, 2020-2032 ($MILLION)
- TABLE 13. NORTH AMERICA CRYOPUMP MARKET, BY COOLDOWN DURATION, 2020-2032 ($MILLION)
- TABLE 14. NORTH AMERICA CRYOPUMP MARKET, BY CROSSOVER RATING, 2020-2032 ($MILLION)
- TABLE 15. NORTH AMERICA CRYOPUMP MARKET, BY COUNTRY, 2020-2032 ($MILLION)
- TABLE 16. U.S. CRYOPUMP MARKET, BY CONFIGURATION, 2020-2032 ($MILLION)
- TABLE 17. U.S. CRYOPUMP MARKET, BY COOLDOWN DURATION, 2020-2032 ($MILLION)
- TABLE 18. U.S. CRYOPUMP MARKET, BY CROSSOVER RATING, 2020-2032 ($MILLION)
- TABLE 19. CANADA CRYOPUMP MARKET, BY CONFIGURATION, 2020-2032 ($MILLION)
- TABLE 20. CANADA CRYOPUMP MARKET, BY COOLDOWN DURATION, 2020-2032 ($MILLION)
- TABLE 21. CANADA CRYOPUMP MARKET, BY CROSSOVER RATING, 2020-2032 ($MILLION)
- TABLE 22. MEXICO CRYOPUMP MARKET, BY CONFIGURATION, 2020-2032 ($MILLION)
- TABLE 23. MEXICO CRYOPUMP MARKET, BY COOLDOWN DURATION, 2020-2032 ($MILLION)
- TABLE 24. MEXICO CRYOPUMP MARKET, BY CROSSOVER RATING, 2020-2032 ($MILLION)
- TABLE 25. EUROPE CRYOPUMP MARKET, BY CONFIGURATION, 2020-2032 ($MILLION)
- TABLE 26. EUROPE CRYOPUMP MARKET, BY COOLDOWN DURATION, 2020-2032 ($MILLION)
- TABLE 27. EUROPE CRYOPUMP MARKET, BY CROSSOVER RATING, 2020-2032 ($MILLION)
- TABLE 28. EUROPE CRYOPUMP MARKET, BY COUNTRY, 2020-2032 ($MILLION)
- TABLE 29. GERMANY CRYOPUMP MARKET, BY CONFIGURATION, 2020-2032 ($MILLION)
- TABLE 30. GERMANY CRYOPUMP MARKET, BY COOLDOWN DURATION, 2020-2032 ($MILLION)
- TABLE 31. GERMANY CRYOPUMP MARKET, BY CROSSOVER RATING, 2020-2032 ($MILLION)
- TABLE 32. FRANCE CRYOPUMP MARKET, BY CONFIGURATION, 2020-2032 ($MILLION)
- TABLE 33. FRANCE CRYOPUMP MARKET, BY COOLDOWN DURATION, 2020-2032 ($MILLION)
- TABLE 34. FRANCE CRYOPUMP MARKET, BY CROSSOVER RATING, 2020-2032 ($MILLION)
- TABLE 35. UK CRYOPUMP MARKET, BY CONFIGURATION, 2020-2032 ($MILLION)
- TABLE 36. UK CRYOPUMP MARKET, BY COOLDOWN DURATION, 2020-2032 ($MILLION)
- TABLE 37. UK CRYOPUMP MARKET, BY CROSSOVER RATING, 2020-2032 ($MILLION)
- TABLE 38. ITALY CRYOPUMP MARKET, BY CONFIGURATION, 2020-2032 ($MILLION)
- TABLE 39. ITALY CRYOPUMP MARKET, BY COOLDOWN DURATION, 2020-2032 ($MILLION)
- TABLE 40. ITALY CRYOPUMP MARKET, BY CROSSOVER RATING, 2020-2032 ($MILLION)
- TABLE 41. REST OF EUROPE CRYOPUMP MARKET, BY CONFIGURATION, 2020-2032 ($MILLION)
- TABLE 42. REST OF EUROPE CRYOPUMP MARKET, BY COOLDOWN DURATION, 2020-2032 ($MILLION)
- TABLE 43. REST OF EUROPE CRYOPUMP MARKET, BY CROSSOVER RATING, 2020-2032 ($MILLION)
- TABLE 44. ASIA-PACIFIC CRYOPUMP MARKET, BY CONFIGURATION, 2020-2032 ($MILLION)
- TABLE 45. ASIA-PACIFIC CRYOPUMP MARKET, BY COOLDOWN DURATION, 2020-2032 ($MILLION)
- TABLE 46. ASIA-PACIFIC CRYOPUMP MARKET, BY CROSSOVER RATING, 2020-2032 ($MILLION)
- TABLE 47. ASIA-PACIFIC CRYOPUMP MARKET, BY COUNTRY, 2020-2032 ($MILLION)
- TABLE 48. CHINA CRYOPUMP MARKET, BY CONFIGURATION, 2020-2032 ($MILLION)
- TABLE 49. CHINA CRYOPUMP MARKET, BY COOLDOWN DURATION, 2020-2032 ($MILLION)
- TABLE 50. CHINA CRYOPUMP MARKET, BY CROSSOVER RATING, 2020-2032 ($MILLION)
- TABLE 51. JAPAN CRYOPUMP MARKET, BY CONFIGURATION, 2020-2032 ($MILLION)
- TABLE 52. JAPAN CRYOPUMP MARKET, BY COOLDOWN DURATION, 2020-2032 ($MILLION)
- TABLE 53. JAPAN CRYOPUMP MARKET, BY CROSSOVER RATING, 2020-2032 ($MILLION)
- TABLE 54. SOUTH KOREA CRYOPUMP MARKET, BY CONFIGURATION, 2020-2032 ($MILLION)
- TABLE 55. SOUTH KOREA CRYOPUMP MARKET, BY COOLDOWN DURATION, 2020-2032 ($MILLION)
- TABLE 56. SOUTH KOREA CRYOPUMP MARKET, BY CROSSOVER RATING, 2020-2032 ($MILLION)
- TABLE 57. INDIA CRYOPUMP MARKET, BY CONFIGURATION, 2020-2032 ($MILLION)
- TABLE 58. INDIA CRYOPUMP MARKET, BY COOLDOWN DURATION, 2020-2032 ($MILLION)
- TABLE 59. INDIA CRYOPUMP MARKET, BY CROSSOVER RATING, 2020-2032 ($MILLION)
- TABLE 60. REST OF ASIA-PACIFIC CRYOPUMP MARKET, BY CONFIGURATION, 2020-2032 ($MILLION)
- TABLE 61. REST OF ASIA-PACIFIC CRYOPUMP MARKET, BY COOLDOWN DURATION, 2020-2032 ($MILLION)
- TABLE 62. REST OF ASIA-PACIFIC CRYOPUMP MARKET, BY CROSSOVER RATING, 2020-2032 ($MILLION)
- TABLE 63. LATIN AMERICA CRYOPUMP MARKET, BY CONFIGURATION, 2020-2032 ($MILLION)
- TABLE 64. LATIN AMERICA CRYOPUMP MARKET, BY COOLDOWN DURATION, 2020-2032 ($MILLION)
- TABLE 65. LATIN AMERICA CRYOPUMP MARKET, BY CROSSOVER RATING, 2020-2032 ($MILLION)
- TABLE 66. LATIN AMERICA CRYOPUMP MARKET, BY COUNTRY, 2020-2032 ($MILLION)
- TABLE 67. BRAZIL CRYOPUMP MARKET, BY CONFIGURATION, 2020-2032 ($MILLION)
- TABLE 68. BRAZIL CRYOPUMP MARKET, BY COOLDOWN DURATION, 2020-2032 ($MILLION)
- TABLE 69. BRAZIL CRYOPUMP MARKET, BY CROSSOVER RATING, 2020-2032 ($MILLION)
- TABLE 70. ARGENTINA CRYOPUMP MARKET, BY CONFIGURATION, 2020-2032 ($MILLION)
- TABLE 71. ARGENTINA CRYOPUMP MARKET, BY COOLDOWN DURATION, 2020-2032 ($MILLION)
- TABLE 72. ARGENTINA CRYOPUMP MARKET, BY CROSSOVER RATING, 2020-2032 ($MILLION)
- TABLE 73. COLOMBIA CRYOPUMP MARKET, BY CONFIGURATION, 2020-2032 ($MILLION)
- TABLE 74. COLOMBIA CRYOPUMP MARKET, BY COOLDOWN DURATION, 2020-2032 ($MILLION)
- TABLE 75. COLOMBIA CRYOPUMP MARKET, BY CROSSOVER RATING, 2020-2032 ($MILLION)
- TABLE 76. REST OF LATIN AMERICA CRYOPUMP MARKET, BY CONFIGURATION, 2020-2032 ($MILLION)
- TABLE 77. REST OF LATIN AMERICA CRYOPUMP MARKET, BY COOLDOWN DURATION, 2020-2032 ($MILLION)
- TABLE 78. REST OF LATIN AMERICA CRYOPUMP MARKET, BY CROSSOVER RATING, 2020-2032 ($MILLION)
- TABLE 79. MIDDLE EAST AND AFRICA CRYOPUMP MARKET, BY CONFIGURATION, 2020-2032 ($MILLION)
- TABLE 80. MIDDLE EAST AND AFRICA CRYOPUMP MARKET, BY COOLDOWN DURATION, 2020-2032 ($MILLION)
- TABLE 81. MIDDLE EAST AND AFRICA CRYOPUMP MARKET, BY CROSSOVER RATING, 2020-2032 ($MILLION)
- TABLE 82. MIDDLE EAST AND AFRICA CRYOPUMP MARKET, BY COUNTRY, 2020-2032 ($MILLION)
- TABLE 83. SAUDI ARABIA CRYOPUMP MARKET, BY CONFIGURATION, 2020-2032 ($MILLION)
- TABLE 84. SAUDI ARABIA CRYOPUMP MARKET, BY COOLDOWN DURATION, 2020-2032 ($MILLION)
- TABLE 85. SAUDI ARABIA CRYOPUMP MARKET, BY CROSSOVER RATING, 2020-2032 ($MILLION)
- TABLE 86. UAE CRYOPUMP MARKET, BY CONFIGURATION, 2020-2032 ($MILLION)
- TABLE 87. UAE CRYOPUMP MARKET, BY COOLDOWN DURATION, 2020-2032 ($MILLION)
- TABLE 88. UAE CRYOPUMP MARKET, BY CROSSOVER RATING, 2020-2032 ($MILLION)
- TABLE 89. NIGERIA CRYOPUMP MARKET, BY CONFIGURATION, 2020-2032 ($MILLION)
- TABLE 90. NIGERIA CRYOPUMP MARKET, BY COOLDOWN DURATION, 2020-2032 ($MILLION)
- TABLE 91. NIGERIA CRYOPUMP MARKET, BY CROSSOVER RATING, 2020-2032 ($MILLION)
- TABLE 92. EGYPT CRYOPUMP MARKET, BY CONFIGURATION, 2020-2032 ($MILLION)
- TABLE 93. EGYPT CRYOPUMP MARKET, BY COOLDOWN DURATION, 2020-2032 ($MILLION)
- TABLE 94. EGYPT CRYOPUMP MARKET, BY CROSSOVER RATING, 2020-2032 ($MILLION)
- TABLE 95. REST OF MIDDLE EAST AND AFRICA CRYOPUMP MARKET, BY CONFIGURATION, 2020-2032 ($MILLION)
- TABLE 96. REST OF MIDDLE EAST AND AFRICA CRYOPUMP MARKET, BY COOLDOWN DURATION, 2020-2032 ($MILLION)
- TABLE 97. REST OF MIDDLE EAST AND AFRICA CRYOPUMP MARKET, BY CROSSOVER RATING, 2020-2032 ($MILLION)
- TABLE 98. SHI CRYOGENICS GROUP: KEY EXECUTIVES
- TABLE 99. SHI CRYOGENICS GROUP: COMPANY SNAPSHOT
- TABLE 100. SHI CRYOGENICS GROUP: PRODUCT SEGMENTS
- TABLE 101. SHI CRYOGENICS GROUP: SERVICE SEGMENTS
- TABLE 102. SHI CRYOGENICS GROUP: PRODUCT PORTFOLIO
- TABLE 103. SHI CRYOGENICS GROUP: KEY STRATERGIES
- TABLE 104. TRILLIUM: KEY EXECUTIVES
- TABLE 105. TRILLIUM: COMPANY SNAPSHOT
- TABLE 106. TRILLIUM: PRODUCT SEGMENTS
- TABLE 107. TRILLIUM: SERVICE SEGMENTS
- TABLE 108. TRILLIUM: PRODUCT PORTFOLIO
- TABLE 109. TRILLIUM: KEY STRATERGIES
- TABLE 110. LEYBOLD PRODUCTS GMBH: KEY EXECUTIVES
- TABLE 111. LEYBOLD PRODUCTS GMBH: COMPANY SNAPSHOT
- TABLE 112. LEYBOLD PRODUCTS GMBH: PRODUCT SEGMENTS
- TABLE 113. LEYBOLD PRODUCTS GMBH: SERVICE SEGMENTS
- TABLE 114. LEYBOLD PRODUCTS GMBH: PRODUCT PORTFOLIO
- TABLE 115. LEYBOLD PRODUCTS GMBH: KEY STRATERGIES
- TABLE 116. ATLAS COPCO AB: KEY EXECUTIVES
- TABLE 117. ATLAS COPCO AB: COMPANY SNAPSHOT
- TABLE 118. ATLAS COPCO AB: PRODUCT SEGMENTS
- TABLE 119. ATLAS COPCO AB: SERVICE SEGMENTS
- TABLE 120. ATLAS COPCO AB: PRODUCT PORTFOLIO
- TABLE 121. ATLAS COPCO AB: KEY STRATERGIES
- TABLE 122. ULVAC CRYOGENICS, INC.: KEY EXECUTIVES
- TABLE 123. ULVAC CRYOGENICS, INC.: COMPANY SNAPSHOT
- TABLE 124. ULVAC CRYOGENICS, INC.: PRODUCT SEGMENTS
- TABLE 125. ULVAC CRYOGENICS, INC.: SERVICE SEGMENTS
- TABLE 126. ULVAC CRYOGENICS, INC.: PRODUCT PORTFOLIO
- TABLE 127. ULVAC CRYOGENICS, INC.: KEY STRATERGIES
- TABLE 128. PFEIFFER VACUUM GMBH: KEY EXECUTIVES
- TABLE 129. PFEIFFER VACUUM GMBH: COMPANY SNAPSHOT
- TABLE 130. PFEIFFER VACUUM GMBH: PRODUCT SEGMENTS
- TABLE 131. PFEIFFER VACUUM GMBH: SERVICE SEGMENTS
- TABLE 132. PFEIFFER VACUUM GMBH: PRODUCT PORTFOLIO
- TABLE 133. PFEIFFER VACUUM GMBH: KEY STRATERGIES
- TABLE 134. VACREE TECHNOLOGIES CO.,LTD: KEY EXECUTIVES
- TABLE 135. VACREE TECHNOLOGIES CO.,LTD: COMPANY SNAPSHOT
- TABLE 136. VACREE TECHNOLOGIES CO.,LTD: PRODUCT SEGMENTS
- TABLE 137. VACREE TECHNOLOGIES CO.,LTD: SERVICE SEGMENTS
- TABLE 138. VACREE TECHNOLOGIES CO.,LTD: PRODUCT PORTFOLIO
- TABLE 139. VACREE TECHNOLOGIES CO.,LTD: KEY STRATERGIES
- TABLE 140. EBRA CORPORATION: KEY EXECUTIVES
- TABLE 141. EBRA CORPORATION: COMPANY SNAPSHOT
- TABLE 142. EBRA CORPORATION: PRODUCT SEGMENTS
- TABLE 143. EBRA CORPORATION: SERVICE SEGMENTS
- TABLE 144. EBRA CORPORATION: PRODUCT PORTFOLIO
- TABLE 145. EBRA CORPORATION: KEY STRATERGIES
- TABLE 146. NIKKISO: KEY EXECUTIVES
- TABLE 147. NIKKISO: COMPANY SNAPSHOT
- TABLE 148. NIKKISO: PRODUCT SEGMENTS
- TABLE 149. NIKKISO: SERVICE SEGMENTS
- TABLE 150. NIKKISO: PRODUCT PORTFOLIO
- TABLE 151. NIKKISO: KEY STRATERGIES
- TABLE 152. NIKKISO CO., LTD: KEY EXECUTIVES
- TABLE 153. NIKKISO CO., LTD: COMPANY SNAPSHOT
- TABLE 154. NIKKISO CO., LTD: PRODUCT SEGMENTS
- TABLE 155. NIKKISO CO., LTD: SERVICE SEGMENTS
- TABLE 156. NIKKISO CO., LTD: PRODUCT PORTFOLIO
- TABLE 157. NIKKISO CO., LTD: KEY STRATERGIES
- TABLE 158. ELLIOTT GROUP, LLC.: KEY EXECUTIVES
- TABLE 159. ELLIOTT GROUP, LLC.: COMPANY SNAPSHOT
- TABLE 160. ELLIOTT GROUP, LLC.: PRODUCT SEGMENTS
- TABLE 161. ELLIOTT GROUP, LLC.: SERVICE SEGMENTS
- TABLE 162. ELLIOTT GROUP, LLC.: PRODUCT PORTFOLIO
- TABLE 163. ELLIOTT GROUP, LLC.: KEY STRATERGIES
LIST OF FIGURES
- FIGURE 01. CRYOPUMP MARKET, 2020-2032
- FIGURE 02. SEGMENTATION OF CRYOPUMP MARKET,2020-2032
- FIGURE 03. TOP IMPACTING FACTORS IN CRYOPUMP MARKET
- FIGURE 04. TOP INVESTMENT POCKETS IN CRYOPUMP MARKET (2023-2032)
- FIGURE 05. BARGAINING POWER OF SUPPLIERS
- FIGURE 06. BARGAINING POWER OF BUYERS
- FIGURE 07. THREAT OF SUBSTITUTION
- FIGURE 08. THREAT OF SUBSTITUTION
- FIGURE 09. COMPETITIVE RIVALRY
- FIGURE 10. GLOBAL CRYOPUMP MARKET:DRIVERS, RESTRAINTS AND OPPORTUNITIES
- FIGURE 11. CRYOPUMP MARKET, BY CONFIGURATION, 2020 AND 2032(%)
- FIGURE 12. COMPARATIVE SHARE ANALYSIS OF CRYOPUMP MARKET FOR STRAIGHT, BY COUNTRY 2020 AND 2032(%)
- FIGURE 13. COMPARATIVE SHARE ANALYSIS OF CRYOPUMP MARKET FOR FLAT, BY COUNTRY 2020 AND 2032(%)
- FIGURE 14. CRYOPUMP MARKET, BY COOLDOWN DURATION, 2020 AND 2032(%)
- FIGURE 15. COMPARATIVE SHARE ANALYSIS OF CRYOPUMP MARKET FOR 90 MINUTES OR LESS, BY COUNTRY 2020 AND 2032(%)
- FIGURE 16. COMPARATIVE SHARE ANALYSIS OF CRYOPUMP MARKET FOR MORE THAN 90 MINUTES, BY COUNTRY 2020 AND 2032(%)
- FIGURE 17. CRYOPUMP MARKET, BY CROSSOVER RATING, 2020 AND 2032(%)
- FIGURE 18. COMPARATIVE SHARE ANALYSIS OF CRYOPUMP MARKET FOR LESS THAN 250 TORR-LITERS, BY COUNTRY 2020 AND 2032(%)
- FIGURE 19. COMPARATIVE SHARE ANALYSIS OF CRYOPUMP MARKET FOR 250-500 TORR-LITERS, BY COUNTRY 2020 AND 2032(%)
- FIGURE 20. COMPARATIVE SHARE ANALYSIS OF CRYOPUMP MARKET FOR MORE THAN 500 TORR-LITERS, BY COUNTRY 2020 AND 2032(%)
- FIGURE 21. CRYOPUMP MARKET BY REGION, 2020 AND 2032(%)
- FIGURE 22. U.S. CRYOPUMP MARKET, 2020-2032 ($MILLION)
- FIGURE 23. CANADA CRYOPUMP MARKET, 2020-2032 ($MILLION)
- FIGURE 24. MEXICO CRYOPUMP MARKET, 2020-2032 ($MILLION)
- FIGURE 25. GERMANY CRYOPUMP MARKET, 2020-2032 ($MILLION)
- FIGURE 26. FRANCE CRYOPUMP MARKET, 2020-2032 ($MILLION)
- FIGURE 27. UK CRYOPUMP MARKET, 2020-2032 ($MILLION)
- FIGURE 28. ITALY CRYOPUMP MARKET, 2020-2032 ($MILLION)
- FIGURE 29. REST OF EUROPE CRYOPUMP MARKET, 2020-2032 ($MILLION)
- FIGURE 30. CHINA CRYOPUMP MARKET, 2020-2032 ($MILLION)
- FIGURE 31. JAPAN CRYOPUMP MARKET, 2020-2032 ($MILLION)
- FIGURE 32. SOUTH KOREA CRYOPUMP MARKET, 2020-2032 ($MILLION)
- FIGURE 33. INDIA CRYOPUMP MARKET, 2020-2032 ($MILLION)
- FIGURE 34. REST OF ASIA-PACIFIC CRYOPUMP MARKET, 2020-2032 ($MILLION)
- FIGURE 35. BRAZIL CRYOPUMP MARKET, 2020-2032 ($MILLION)
- FIGURE 36. ARGENTINA CRYOPUMP MARKET, 2020-2032 ($MILLION)
- FIGURE 37. COLOMBIA CRYOPUMP MARKET, 2020-2032 ($MILLION)
- FIGURE 38. REST OF LATIN AMERICA CRYOPUMP MARKET, 2020-2032 ($MILLION)
- FIGURE 39. SAUDI ARABIA CRYOPUMP MARKET, 2020-2032 ($MILLION)
- FIGURE 40. UAE CRYOPUMP MARKET, 2020-2032 ($MILLION)
- FIGURE 41. NIGERIA CRYOPUMP MARKET, 2020-2032 ($MILLION)
- FIGURE 42. EGYPT CRYOPUMP MARKET, 2020-2032 ($MILLION)
- FIGURE 43. REST OF MIDDLE EAST AND AFRICA CRYOPUMP MARKET, 2020-2032 ($MILLION)
- FIGURE 44. TOP WINNING STRATEGIES, BY YEAR
- FIGURE 45. TOP WINNING STRATEGIES, BY DEVELOPMENT
- FIGURE 46. TOP WINNING STRATEGIES, BY COMPANY
- FIGURE 47. PRODUCT MAPPING OF TOP 10 PLAYERS
- FIGURE 48. COMPETITIVE DASHBOARD
- FIGURE 49. COMPETITIVE HEATMAP: CRYOPUMP MARKET
- FIGURE 50. TOP PLAYER POSITIONING, 2020

