
PUBLISHER: Allied Market Research | PRODUCT CODE: 1472215

PUBLISHER: Allied Market Research | PRODUCT CODE: 1472215
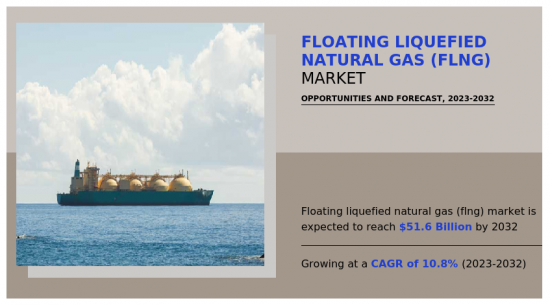
Floating Liquefied Natural Gas (FLNG) Market By Technology (LNG FPSO, FSRU, Others), By Capacity (Small/Mid-Scale, Large Scale, Others): Global Opportunity Analysis and Industry Forecast, 2023-2032
The floating liquefied natural gas (FLNG) market was valued at $19.2 billion in 2022 and is estimated to reach $51.6 billion by 2032, exhibiting a CAGR of 10.8% from 2023 to 2032.
Floating Liquefied Natural Gas (FLNG) is a technology that enables the processing, liquefaction, storage, and offloading of natural gas directly from offshore gas fields, using a floating facility rather than traditional onshore infrastructure. FLNG technology is designed to operate in remote or challenging offshore environments, providing a flexible solution for the development and monetization of natural gas reserves. FLNG is a viable option for monetizing stranded or remote gas fields. Apart from larger-scale FLNG export projects, there is surge in interest in small-scale LNG production and bunkering facilities. These facilities cater to regional demand for LNG as a cleaner marine fuel. Environmental regulations and considerations play a significant role in the development of FLNG projects. Environmental impact assessments and adherence to regulatory standards are crucial for obtaining approvals.
LNG market dynamics, including global demand, pricing trends, and competition, influence the development of FLNG projects. The ability to offer flexible and cost-effective LNG supply solutions contributes to market competitiveness. Ongoing advancements in FLNG technology, including improvements in liquefaction efficiency and safety features, impact the attractiveness of FLNG solutions in the market. FLNG projects contribute to the global LNG market, meeting the demand from various regions. Many countries aim to enhance their competitiveness in the global LNG market through FLNG projects. The ability to provide reliable and cost-effective LNG supply is crucial for market competitiveness. Ongoing advancements in FLNG technology, including improvements in liquefaction efficiency and safety features, influence the attractiveness of FLNG solutions in the market.
FLNG projects face environmental challenges, and their adherence to stringent environmental standards is crucial. Environmental impact assessments are conducted for project approvals. The financing of FLNG projects involves significant capital investments. Securing financing for these large-scale projects is a key consideration. Countries in the world are exploring opportunities to expand their FLNG activities and capture a larger share of the global LNG market. The floating liquefied natural gas market is segmented on the basis of technology, capacity, and region. Depending on the technology, the market is categorized into LNG FPSO, FSRU, and others. The FSRU segment dominated the floating liquefied natural gas (FLNG) market and is projected to dominate the market growth during forecast period. By capacity, the market is classified into small/mid-scale, large scale, and others. The large scale segments is projected to dominate the market growth during projection years. By region, the floating liquefied natural gas market is analyzed across North America, Europe, Asia-Pacific, and LAMEA (Latin America, the Middle East, and Africa). Asia-Pacific garnered highest market share in terms of revenue. The same is projected to maintain its dominance during the forecast period.
The major players operating in the floating liquefied natural gas market are Eni S.p.A., Shell plc, Hoegh LNG, Golar LNG Limited., EXMAR, Woodside Energy Group Ltd., Mitsui O.S.K. Lines., Excelerate Energy, Inc., BASF SE, ABB Ltd., and Petroliam Nasional Berhad (PETRONAS). The companies adopted key strategies such as collaboration and expansion to increase their market share. The report offers a thorough analysis of the floating liquefied natural gas market with detailed study of various aspects of the market such as market dynamics, vital segments, major geographies, key players, and competitive landscape. The report provides a clear picture of the current market situation and future trends of the Floating liquefied natural gas market based on the impact of various market dynamics and vital forces influencing the market.
The drivers and opportunities in the market contributing to market growth are acknowledged in the market dynamics. Besides, challenges and restraints that hold potential to hamper market growth are also premeditated in the floating liquefied natural gas market. Porter's five forces analysis is delivered through the report which precisely highlights the effects of key forces on the floating liquefied natural gas market. The report offers market size and estimations analyzing floating liquefied natural gas market through various segments.
In addition, the report includes geographical market analysis of these segments. Each segment entailed in the report is studied at regional and country level as well to provide complete coverage of floating liquefied natural gas market. The report categorizes the floating liquefied natural gas market into four major geographies including North America, Europe, Asia-Pacific, and LAMEA. These geographies are further sub-categorized into countries to cover floating liquefied natural gas market scenario across respective regions. Furthermore, the report covers the competitive scenario of the floating liquefied natural gas market. The key players operating in the floating liquefied natural gas market are studied in the report to understand their current market position and competitive strengths in the industry.
The report profiles 10 key companies. Moreover, the company profiles include various data-points such as company overview, company executives, recent financials of the company, major growth strategies espoused by company, new initiatives, and advancements by company to sustain and mend their position in the floating liquefied natural gas market, and others.
Key Benefits For Stakeholders
- This report provides a quantitative analysis of the market segments, current trends, estimations, and dynamics of the floating liquefied natural gas (flng) market analysis from 2022 to 2032 to identify the prevailing floating liquefied natural gas (flng) market opportunities.
- The market research is offered along with information related to key drivers, restraints, and opportunities.
- Porter's five forces analysis highlights the potency of buyers and suppliers to enable stakeholders make profit-oriented business decisions and strengthen their supplier-buyer network.
- In-depth analysis of the floating liquefied natural gas (flng) market segmentation assists to determine the prevailing market opportunities.
- Major countries in each region are mapped according to their revenue contribution to the global market.
- Market player positioning facilitates benchmarking and provides a clear understanding of the present position of the market players.
- The report includes the analysis of the regional as well as global floating liquefied natural gas (flng) market trends, key players, market segments, application areas, and market growth strategies.
Additional benefits you will get with this purchase are:
- Quarterly Update and* (only available with a corporate license, on listed price)
- 5 additional Company Profile of client Choice pre- or Post-purchase, as a free update.
- Free Upcoming Version on the Purchase of Five and Enterprise User License.
- 16 analyst hours of support* (post-purchase, if you find additional data requirements upon review of the report, you may receive support amounting to 16 analyst hours to solve questions, and post-sale queries)
- 15% Free Customization* (in case the scope or segment of the report does not match your requirements, 15% is equivalent to 3 working days of free work, applicable once)
- Free data Pack on the Five and Enterprise User License. (Excel version of the report)
- Free Updated report if the report is 6-12 months old or older.
- 24-hour priority response*
- Free Industry updates and white papers.
Possible Customization with this report (with additional cost and timeline, please talk to the sales executive to know more)
- Additional company profiles with specific to client's interest
- Additional country or region analysis- market size and forecast
Key Market Segments
By Technology
- LNG FPSO
- FSRU
- Others
By Capacity
- Small/Mid-Scale
- Large Scale
- Others
By Region
- North America
- U.S.
- Canada
- Mexico
- Europe
- Russia
- Germany
- UK
- France
- Italy
- Spain
- Rest of Europe
- Asia-Pacific
- Australia
- China
- Japan
- India
- South Korea
- Indonesia
- Thailand
- Malaysia
- Rest of Asia-Pacific
- LAMEA
- Brazil
- Saudi Arabia
- South Africa
- UAE
- Argentina
- Rest of LAMEA
Key Market Players:
- EXMAR
- Hoegh LNG
- Woodside Energy Group Ltd
- Golar LNG Limited
- Eni S.p.A.
- Petroliam Nasional Berhad (PETRONAS)
- BASF SE
- Excelerate Energy, Inc.
- Mitsui O.S.K.Lines
- ABB Ltd.
- Shell plc
TABLE OF CONTENTS
CHAPTER 1: INTRODUCTION
- 1.1. Report description
- 1.2. Key market segments
- 1.3. Key benefits to the stakeholders
- 1.4. Research methodology
- 1.4.1. Primary research
- 1.4.2. Secondary research
- 1.4.3. Analyst tools and models
CHAPTER 2: EXECUTIVE SUMMARY
- 2.1. CXO perspective
CHAPTER 3: MARKET OVERVIEW
- 3.1. Market definition and scope
- 3.2. Key findings
- 3.2.1. Top impacting factors
- 3.2.2. Top investment pockets
- 3.3. Porter's five forces analysis
- 3.3.1. Low bargaining power of suppliers
- 3.3.2. Low threat of new entrants
- 3.3.3. Low threat of substitutes
- 3.3.4. Low intensity of rivalry
- 3.3.5. Low bargaining power of buyers
- 3.4. Market dynamics
- 3.4.1. Drivers
- 3.4.1.1. Monetization of offshore gas
- 3.4.1.2. Flexibility and mobility
- 3.4.2. Restraints
- 3.4.2.1. High capital investments and limited technological advances
- 3.4.2.2. Operational and safety challenges due to lack of infrastructure
- 3.4.3. Opportunities
- 3.4.3.1. Growing market for LNG and unlocking gas reserves
- 3.4.1. Drivers
- 3.5. Value Chain Analysis
- 3.6. Patent Landscape
CHAPTER 4: FLOATING LIQUEFIED NATURAL GAS (FLNG) MARKET, BY TECHNOLOGY
- 4.1. Overview
- 4.1.1. Market size and forecast
- 4.2. LNG FPSO
- 4.2.1. Key market trends, growth factors and opportunities
- 4.2.2. Market size and forecast, by region
- 4.2.3. Market share analysis by country
- 4.3. FSRU
- 4.3.1. Key market trends, growth factors and opportunities
- 4.3.2. Market size and forecast, by region
- 4.3.3. Market share analysis by country
- 4.4. Others
- 4.4.1. Key market trends, growth factors and opportunities
- 4.4.2. Market size and forecast, by region
- 4.4.3. Market share analysis by country
CHAPTER 5: FLOATING LIQUEFIED NATURAL GAS (FLNG) MARKET, BY CAPACITY
- 5.1. Overview
- 5.1.1. Market size and forecast
- 5.2. Small/Mid-Scale
- 5.2.1. Key market trends, growth factors and opportunities
- 5.2.2. Market size and forecast, by region
- 5.2.3. Market share analysis by country
- 5.3. Large Scale
- 5.3.1. Key market trends, growth factors and opportunities
- 5.3.2. Market size and forecast, by region
- 5.3.3. Market share analysis by country
- 5.4. Others
- 5.4.1. Key market trends, growth factors and opportunities
- 5.4.2. Market size and forecast, by region
- 5.4.3. Market share analysis by country
CHAPTER 6: FLOATING LIQUEFIED NATURAL GAS (FLNG) MARKET, BY REGION
- 6.1. Overview
- 6.1.1. Market size and forecast By Region
- 6.2. North America
- 6.2.1. Key market trends, growth factors and opportunities
- 6.2.2. Market size and forecast, by Technology
- 6.2.3. Market size and forecast, by Capacity
- 6.2.4. Market size and forecast, by country
- 6.2.4.1. U.S.
- 6.2.4.1.1. Market size and forecast, by Technology
- 6.2.4.1.2. Market size and forecast, by Capacity
- 6.2.4.2. Canada
- 6.2.4.2.1. Market size and forecast, by Technology
- 6.2.4.2.2. Market size and forecast, by Capacity
- 6.2.4.3. Mexico
- 6.2.4.3.1. Market size and forecast, by Technology
- 6.2.4.3.2. Market size and forecast, by Capacity
- 6.3. Europe
- 6.3.1. Key market trends, growth factors and opportunities
- 6.3.2. Market size and forecast, by Technology
- 6.3.3. Market size and forecast, by Capacity
- 6.3.4. Market size and forecast, by country
- 6.3.4.1. Russia
- 6.3.4.1.1. Market size and forecast, by Technology
- 6.3.4.1.2. Market size and forecast, by Capacity
- 6.3.4.2. Germany
- 6.3.4.2.1. Market size and forecast, by Technology
- 6.3.4.2.2. Market size and forecast, by Capacity
- 6.3.4.3. UK
- 6.3.4.3.1. Market size and forecast, by Technology
- 6.3.4.3.2. Market size and forecast, by Capacity
- 6.3.4.4. France
- 6.3.4.4.1. Market size and forecast, by Technology
- 6.3.4.4.2. Market size and forecast, by Capacity
- 6.3.4.5. Italy
- 6.3.4.5.1. Market size and forecast, by Technology
- 6.3.4.5.2. Market size and forecast, by Capacity
- 6.3.4.6. Spain
- 6.3.4.6.1. Market size and forecast, by Technology
- 6.3.4.6.2. Market size and forecast, by Capacity
- 6.3.4.7. Rest of Europe
- 6.3.4.7.1. Market size and forecast, by Technology
- 6.3.4.7.2. Market size and forecast, by Capacity
- 6.4. Asia-Pacific
- 6.4.1. Key market trends, growth factors and opportunities
- 6.4.2. Market size and forecast, by Technology
- 6.4.3. Market size and forecast, by Capacity
- 6.4.4. Market size and forecast, by country
- 6.4.4.1. Australia
- 6.4.4.1.1. Market size and forecast, by Technology
- 6.4.4.1.2. Market size and forecast, by Capacity
- 6.4.4.2. China
- 6.4.4.2.1. Market size and forecast, by Technology
- 6.4.4.2.2. Market size and forecast, by Capacity
- 6.4.4.3. Japan
- 6.4.4.3.1. Market size and forecast, by Technology
- 6.4.4.3.2. Market size and forecast, by Capacity
- 6.4.4.4. India
- 6.4.4.4.1. Market size and forecast, by Technology
- 6.4.4.4.2. Market size and forecast, by Capacity
- 6.4.4.5. South Korea
- 6.4.4.5.1. Market size and forecast, by Technology
- 6.4.4.5.2. Market size and forecast, by Capacity
- 6.4.4.6. Indonesia
- 6.4.4.6.1. Market size and forecast, by Technology
- 6.4.4.6.2. Market size and forecast, by Capacity
- 6.4.4.7. Thailand
- 6.4.4.7.1. Market size and forecast, by Technology
- 6.4.4.7.2. Market size and forecast, by Capacity
- 6.4.4.8. Malaysia
- 6.4.4.8.1. Market size and forecast, by Technology
- 6.4.4.8.2. Market size and forecast, by Capacity
- 6.4.4.9. Rest of Asia-Pacific
- 6.4.4.9.1. Market size and forecast, by Technology
- 6.4.4.9.2. Market size and forecast, by Capacity
- 6.5. LAMEA
- 6.5.1. Key market trends, growth factors and opportunities
- 6.5.2. Market size and forecast, by Technology
- 6.5.3. Market size and forecast, by Capacity
- 6.5.4. Market size and forecast, by country
- 6.5.4.1. Brazil
- 6.5.4.1.1. Market size and forecast, by Technology
- 6.5.4.1.2. Market size and forecast, by Capacity
- 6.5.4.2. Saudi Arabia
- 6.5.4.2.1. Market size and forecast, by Technology
- 6.5.4.2.2. Market size and forecast, by Capacity
- 6.5.4.3. South Africa
- 6.5.4.3.1. Market size and forecast, by Technology
- 6.5.4.3.2. Market size and forecast, by Capacity
- 6.5.4.4. UAE
- 6.5.4.4.1. Market size and forecast, by Technology
- 6.5.4.4.2. Market size and forecast, by Capacity
- 6.5.4.5. Argentina
- 6.5.4.5.1. Market size and forecast, by Technology
- 6.5.4.5.2. Market size and forecast, by Capacity
- 6.5.4.6. Rest of LAMEA
- 6.5.4.6.1. Market size and forecast, by Technology
- 6.5.4.6.2. Market size and forecast, by Capacity
CHAPTER 7: COMPETITIVE LANDSCAPE
- 7.1. Introduction
- 7.2. Top winning strategies
- 7.3. Product mapping of top 10 player
- 7.4. Competitive dashboard
- 7.5. Competitive heatmap
- 7.6. Top player positioning, 2022
CHAPTER 8: COMPANY PROFILES
- 8.1. Hoegh LNG
- 8.1.1. Company overview
- 8.1.2. Key executives
- 8.1.3. Company snapshot
- 8.1.4. Operating business segments
- 8.1.5. Product portfolio
- 8.1.6. Business performance
- 8.2. Golar LNG Limited
- 8.2.1. Company overview
- 8.2.2. Key executives
- 8.2.3. Company snapshot
- 8.2.4. Operating business segments
- 8.2.5. Product portfolio
- 8.2.6. Business performance
- 8.3. Excelerate Energy, Inc.
- 8.3.1. Company overview
- 8.3.2. Key executives
- 8.3.3. Company snapshot
- 8.3.4. Operating business segments
- 8.3.5. Product portfolio
- 8.3.6. Business performance
- 8.3.7. Key strategic moves and developments
- 8.4. Eni S.p.A.
- 8.4.1. Company overview
- 8.4.2. Key executives
- 8.4.3. Company snapshot
- 8.4.4. Operating business segments
- 8.4.5. Product portfolio
- 8.4.6. Business performance
- 8.5. Mitsui O.S.K.Lines
- 8.5.1. Company overview
- 8.5.2. Key executives
- 8.5.3. Company snapshot
- 8.5.4. Operating business segments
- 8.5.5. Product portfolio
- 8.5.6. Business performance
- 8.5.7. Key strategic moves and developments
- 8.6. Shell plc
- 8.6.1. Company overview
- 8.6.2. Key executives
- 8.6.3. Company snapshot
- 8.6.4. Operating business segments
- 8.6.5. Product portfolio
- 8.6.6. Business performance
- 8.7. Petroliam Nasional Berhad (PETRONAS)
- 8.7.1. Company overview
- 8.7.2. Key executives
- 8.7.3. Company snapshot
- 8.7.4. Operating business segments
- 8.7.5. Product portfolio
- 8.7.6. Business performance
- 8.8. EXMAR
- 8.8.1. Company overview
- 8.8.2. Key executives
- 8.8.3. Company snapshot
- 8.8.4. Operating business segments
- 8.8.5. Product portfolio
- 8.8.6. Business performance
- 8.9. Woodside Energy Group Ltd
- 8.9.1. Company overview
- 8.9.2. Key executives
- 8.9.3. Company snapshot
- 8.9.4. Operating business segments
- 8.9.5. Product portfolio
- 8.9.6. Business performance
- 8.10. BASF SE
- 8.10.1. Company overview
- 8.10.2. Key executives
- 8.10.3. Company snapshot
- 8.10.4. Operating business segments
- 8.10.5. Product portfolio
- 8.10.6. Business performance
- 8.11. ABB Ltd.
- 8.11.1. Company overview
- 8.11.2. Key executives
- 8.11.3. Company snapshot
- 8.11.4. Operating business segments
- 8.11.5. Product portfolio
- 8.11.6. Business performance
LIST OF TABLES
- TABLE 01. GLOBAL FLOATING LIQUEFIED NATURAL GAS (FLNG) MARKET, BY TECHNOLOGY, 2022-2032 ($MILLION)
- TABLE 02. FLOATING LIQUEFIED NATURAL GAS (FLNG) MARKET FOR LNG FPSO, BY REGION, 2022-2032 ($MILLION)
- TABLE 03. FLOATING LIQUEFIED NATURAL GAS (FLNG) MARKET FOR FSRU, BY REGION, 2022-2032 ($MILLION)
- TABLE 04. FLOATING LIQUEFIED NATURAL GAS (FLNG) MARKET FOR OTHERS, BY REGION, 2022-2032 ($MILLION)
- TABLE 05. GLOBAL FLOATING LIQUEFIED NATURAL GAS (FLNG) MARKET, BY CAPACITY, 2022-2032 ($MILLION)
- TABLE 06. FLOATING LIQUEFIED NATURAL GAS (FLNG) MARKET FOR SMALL/MID-SCALE, BY REGION, 2022-2032 ($MILLION)
- TABLE 07. FLOATING LIQUEFIED NATURAL GAS (FLNG) MARKET FOR LARGE SCALE, BY REGION, 2022-2032 ($MILLION)
- TABLE 08. FLOATING LIQUEFIED NATURAL GAS (FLNG) MARKET FOR OTHERS, BY REGION, 2022-2032 ($MILLION)
- TABLE 09. FLOATING LIQUEFIED NATURAL GAS (FLNG) MARKET, BY REGION, 2022-2032 ($MILLION)
- TABLE 10. NORTH AMERICA FLOATING LIQUEFIED NATURAL GAS (FLNG) MARKET, BY TECHNOLOGY, 2022-2032 ($MILLION)
- TABLE 11. NORTH AMERICA FLOATING LIQUEFIED NATURAL GAS (FLNG) MARKET, BY CAPACITY, 2022-2032 ($MILLION)
- TABLE 12. NORTH AMERICA FLOATING LIQUEFIED NATURAL GAS (FLNG) MARKET, BY COUNTRY, 2022-2032 ($MILLION)
- TABLE 13. U.S. FLOATING LIQUEFIED NATURAL GAS (FLNG) MARKET, BY TECHNOLOGY, 2022-2032 ($MILLION)
- TABLE 14. U.S. FLOATING LIQUEFIED NATURAL GAS (FLNG) MARKET, BY CAPACITY, 2022-2032 ($MILLION)
- TABLE 15. CANADA FLOATING LIQUEFIED NATURAL GAS (FLNG) MARKET, BY TECHNOLOGY, 2022-2032 ($MILLION)
- TABLE 16. CANADA FLOATING LIQUEFIED NATURAL GAS (FLNG) MARKET, BY CAPACITY, 2022-2032 ($MILLION)
- TABLE 17. MEXICO FLOATING LIQUEFIED NATURAL GAS (FLNG) MARKET, BY TECHNOLOGY, 2022-2032 ($MILLION)
- TABLE 18. MEXICO FLOATING LIQUEFIED NATURAL GAS (FLNG) MARKET, BY CAPACITY, 2022-2032 ($MILLION)
- TABLE 19. EUROPE FLOATING LIQUEFIED NATURAL GAS (FLNG) MARKET, BY TECHNOLOGY, 2022-2032 ($MILLION)
- TABLE 20. EUROPE FLOATING LIQUEFIED NATURAL GAS (FLNG) MARKET, BY CAPACITY, 2022-2032 ($MILLION)
- TABLE 21. EUROPE FLOATING LIQUEFIED NATURAL GAS (FLNG) MARKET, BY COUNTRY, 2022-2032 ($MILLION)
- TABLE 22. RUSSIA FLOATING LIQUEFIED NATURAL GAS (FLNG) MARKET, BY TECHNOLOGY, 2022-2032 ($MILLION)
- TABLE 23. RUSSIA FLOATING LIQUEFIED NATURAL GAS (FLNG) MARKET, BY CAPACITY, 2022-2032 ($MILLION)
- TABLE 24. GERMANY FLOATING LIQUEFIED NATURAL GAS (FLNG) MARKET, BY TECHNOLOGY, 2022-2032 ($MILLION)
- TABLE 25. GERMANY FLOATING LIQUEFIED NATURAL GAS (FLNG) MARKET, BY CAPACITY, 2022-2032 ($MILLION)
- TABLE 26. UK FLOATING LIQUEFIED NATURAL GAS (FLNG) MARKET, BY TECHNOLOGY, 2022-2032 ($MILLION)
- TABLE 27. UK FLOATING LIQUEFIED NATURAL GAS (FLNG) MARKET, BY CAPACITY, 2022-2032 ($MILLION)
- TABLE 28. FRANCE FLOATING LIQUEFIED NATURAL GAS (FLNG) MARKET, BY TECHNOLOGY, 2022-2032 ($MILLION)
- TABLE 29. FRANCE FLOATING LIQUEFIED NATURAL GAS (FLNG) MARKET, BY CAPACITY, 2022-2032 ($MILLION)
- TABLE 30. ITALY FLOATING LIQUEFIED NATURAL GAS (FLNG) MARKET, BY TECHNOLOGY, 2022-2032 ($MILLION)
- TABLE 31. ITALY FLOATING LIQUEFIED NATURAL GAS (FLNG) MARKET, BY CAPACITY, 2022-2032 ($MILLION)
- TABLE 32. SPAIN FLOATING LIQUEFIED NATURAL GAS (FLNG) MARKET, BY TECHNOLOGY, 2022-2032 ($MILLION)
- TABLE 33. SPAIN FLOATING LIQUEFIED NATURAL GAS (FLNG) MARKET, BY CAPACITY, 2022-2032 ($MILLION)
- TABLE 34. REST OF EUROPE FLOATING LIQUEFIED NATURAL GAS (FLNG) MARKET, BY TECHNOLOGY, 2022-2032 ($MILLION)
- TABLE 35. REST OF EUROPE FLOATING LIQUEFIED NATURAL GAS (FLNG) MARKET, BY CAPACITY, 2022-2032 ($MILLION)
- TABLE 36. ASIA-PACIFIC FLOATING LIQUEFIED NATURAL GAS (FLNG) MARKET, BY TECHNOLOGY, 2022-2032 ($MILLION)
- TABLE 37. ASIA-PACIFIC FLOATING LIQUEFIED NATURAL GAS (FLNG) MARKET, BY CAPACITY, 2022-2032 ($MILLION)
- TABLE 38. ASIA-PACIFIC FLOATING LIQUEFIED NATURAL GAS (FLNG) MARKET, BY COUNTRY, 2022-2032 ($MILLION)
- TABLE 39. AUSTRALIA FLOATING LIQUEFIED NATURAL GAS (FLNG) MARKET, BY TECHNOLOGY, 2022-2032 ($MILLION)
- TABLE 40. AUSTRALIA FLOATING LIQUEFIED NATURAL GAS (FLNG) MARKET, BY CAPACITY, 2022-2032 ($MILLION)
- TABLE 41. CHINA FLOATING LIQUEFIED NATURAL GAS (FLNG) MARKET, BY TECHNOLOGY, 2022-2032 ($MILLION)
- TABLE 42. CHINA FLOATING LIQUEFIED NATURAL GAS (FLNG) MARKET, BY CAPACITY, 2022-2032 ($MILLION)
- TABLE 43. JAPAN FLOATING LIQUEFIED NATURAL GAS (FLNG) MARKET, BY TECHNOLOGY, 2022-2032 ($MILLION)
- TABLE 44. JAPAN FLOATING LIQUEFIED NATURAL GAS (FLNG) MARKET, BY CAPACITY, 2022-2032 ($MILLION)
- TABLE 45. INDIA FLOATING LIQUEFIED NATURAL GAS (FLNG) MARKET, BY TECHNOLOGY, 2022-2032 ($MILLION)
- TABLE 46. INDIA FLOATING LIQUEFIED NATURAL GAS (FLNG) MARKET, BY CAPACITY, 2022-2032 ($MILLION)
- TABLE 47. SOUTH KOREA FLOATING LIQUEFIED NATURAL GAS (FLNG) MARKET, BY TECHNOLOGY, 2022-2032 ($MILLION)
- TABLE 48. SOUTH KOREA FLOATING LIQUEFIED NATURAL GAS (FLNG) MARKET, BY CAPACITY, 2022-2032 ($MILLION)
- TABLE 49. INDONESIA FLOATING LIQUEFIED NATURAL GAS (FLNG) MARKET, BY TECHNOLOGY, 2022-2032 ($MILLION)
- TABLE 50. INDONESIA FLOATING LIQUEFIED NATURAL GAS (FLNG) MARKET, BY CAPACITY, 2022-2032 ($MILLION)
- TABLE 51. THAILAND FLOATING LIQUEFIED NATURAL GAS (FLNG) MARKET, BY TECHNOLOGY, 2022-2032 ($MILLION)
- TABLE 52. THAILAND FLOATING LIQUEFIED NATURAL GAS (FLNG) MARKET, BY CAPACITY, 2022-2032 ($MILLION)
- TABLE 53. MALAYSIA FLOATING LIQUEFIED NATURAL GAS (FLNG) MARKET, BY TECHNOLOGY, 2022-2032 ($MILLION)
- TABLE 54. MALAYSIA FLOATING LIQUEFIED NATURAL GAS (FLNG) MARKET, BY CAPACITY, 2022-2032 ($MILLION)
- TABLE 55. REST OF ASIA-PACIFIC FLOATING LIQUEFIED NATURAL GAS (FLNG) MARKET, BY TECHNOLOGY, 2022-2032 ($MILLION)
- TABLE 56. REST OF ASIA-PACIFIC FLOATING LIQUEFIED NATURAL GAS (FLNG) MARKET, BY CAPACITY, 2022-2032 ($MILLION)
- TABLE 57. LAMEA FLOATING LIQUEFIED NATURAL GAS (FLNG) MARKET, BY TECHNOLOGY, 2022-2032 ($MILLION)
- TABLE 58. LAMEA FLOATING LIQUEFIED NATURAL GAS (FLNG) MARKET, BY CAPACITY, 2022-2032 ($MILLION)
- TABLE 59. LAMEA FLOATING LIQUEFIED NATURAL GAS (FLNG) MARKET, BY COUNTRY, 2022-2032 ($MILLION)
- TABLE 60. BRAZIL FLOATING LIQUEFIED NATURAL GAS (FLNG) MARKET, BY TECHNOLOGY, 2022-2032 ($MILLION)
- TABLE 61. BRAZIL FLOATING LIQUEFIED NATURAL GAS (FLNG) MARKET, BY CAPACITY, 2022-2032 ($MILLION)
- TABLE 62. SAUDI ARABIA FLOATING LIQUEFIED NATURAL GAS (FLNG) MARKET, BY TECHNOLOGY, 2022-2032 ($MILLION)
- TABLE 63. SAUDI ARABIA FLOATING LIQUEFIED NATURAL GAS (FLNG) MARKET, BY CAPACITY, 2022-2032 ($MILLION)
- TABLE 64. SOUTH AFRICA FLOATING LIQUEFIED NATURAL GAS (FLNG) MARKET, BY TECHNOLOGY, 2022-2032 ($MILLION)
- TABLE 65. SOUTH AFRICA FLOATING LIQUEFIED NATURAL GAS (FLNG) MARKET, BY CAPACITY, 2022-2032 ($MILLION)
- TABLE 66. UAE FLOATING LIQUEFIED NATURAL GAS (FLNG) MARKET, BY TECHNOLOGY, 2022-2032 ($MILLION)
- TABLE 67. UAE FLOATING LIQUEFIED NATURAL GAS (FLNG) MARKET, BY CAPACITY, 2022-2032 ($MILLION)
- TABLE 68. ARGENTINA FLOATING LIQUEFIED NATURAL GAS (FLNG) MARKET, BY TECHNOLOGY, 2022-2032 ($MILLION)
- TABLE 69. ARGENTINA FLOATING LIQUEFIED NATURAL GAS (FLNG) MARKET, BY CAPACITY, 2022-2032 ($MILLION)
- TABLE 70. REST OF LAMEA FLOATING LIQUEFIED NATURAL GAS (FLNG) MARKET, BY TECHNOLOGY, 2022-2032 ($MILLION)
- TABLE 71. REST OF LAMEA FLOATING LIQUEFIED NATURAL GAS (FLNG) MARKET, BY CAPACITY, 2022-2032 ($MILLION)
- TABLE 72. HOEGH LNG: KEY EXECUTIVES
- TABLE 73. HOEGH LNG: COMPANY SNAPSHOT
- TABLE 74. HOEGH LNG: PRODUCT SEGMENTS
- TABLE 75. HOEGH LNG: PRODUCT PORTFOLIO
- TABLE 76. GOLAR LNG LIMITED: KEY EXECUTIVES
- TABLE 77. GOLAR LNG LIMITED: COMPANY SNAPSHOT
- TABLE 78. GOLAR LNG LIMITED: PRODUCT SEGMENTS
- TABLE 79. GOLAR LNG LIMITED: PRODUCT PORTFOLIO
- TABLE 80. EXCELERATE ENERGY, INC.: KEY EXECUTIVES
- TABLE 81. EXCELERATE ENERGY, INC.: COMPANY SNAPSHOT
- TABLE 82. EXCELERATE ENERGY, INC.: PRODUCT SEGMENTS
- TABLE 83. EXCELERATE ENERGY, INC.: PRODUCT PORTFOLIO
- TABLE 84. EXCELERATE ENERGY, INC.: KEY STRATERGIES
- TABLE 85. ENI S.P.A.: KEY EXECUTIVES
- TABLE 86. ENI S.P.A.: COMPANY SNAPSHOT
- TABLE 87. ENI S.P.A.: PRODUCT SEGMENTS
- TABLE 88. ENI S.P.A.: PRODUCT PORTFOLIO
- TABLE 89. MITSUI O.S.K.LINES: KEY EXECUTIVES
- TABLE 90. MITSUI O.S.K.LINES: COMPANY SNAPSHOT
- TABLE 91. MITSUI O.S.K.LINES: PRODUCT SEGMENTS
- TABLE 92. MITSUI O.S.K.LINES: PRODUCT PORTFOLIO
- TABLE 93. MITSUI O.S.K.LINES: KEY STRATERGIES
- TABLE 94. SHELL PLC: KEY EXECUTIVES
- TABLE 95. SHELL PLC: COMPANY SNAPSHOT
- TABLE 96. SHELL PLC: PRODUCT SEGMENTS
- TABLE 97. SHELL PLC: PRODUCT PORTFOLIO
- TABLE 98. PETROLIAM NASIONAL BERHAD (PETRONAS): KEY EXECUTIVES
- TABLE 99. PETROLIAM NASIONAL BERHAD (PETRONAS): COMPANY SNAPSHOT
- TABLE 100. PETROLIAM NASIONAL BERHAD (PETRONAS): PRODUCT SEGMENTS
- TABLE 101. PETROLIAM NASIONAL BERHAD (PETRONAS): PRODUCT PORTFOLIO
- TABLE 102. EXMAR: KEY EXECUTIVES
- TABLE 103. EXMAR: COMPANY SNAPSHOT
- TABLE 104. EXMAR: PRODUCT SEGMENTS
- TABLE 105. EXMAR: PRODUCT PORTFOLIO
- TABLE 106. WOODSIDE ENERGY GROUP LTD: KEY EXECUTIVES
- TABLE 107. WOODSIDE ENERGY GROUP LTD: COMPANY SNAPSHOT
- TABLE 108. WOODSIDE ENERGY GROUP LTD: PRODUCT SEGMENTS
- TABLE 109. WOODSIDE ENERGY GROUP LTD: PRODUCT PORTFOLIO
- TABLE 110. BASF SE: KEY EXECUTIVES
- TABLE 111. BASF SE: COMPANY SNAPSHOT
- TABLE 112. BASF SE: PRODUCT SEGMENTS
- TABLE 113. BASF SE: PRODUCT PORTFOLIO
- TABLE 114. ABB LTD.: KEY EXECUTIVES
- TABLE 115. ABB LTD.: COMPANY SNAPSHOT
- TABLE 116. ABB LTD.: PRODUCT SEGMENTS
- TABLE 117. ABB LTD.: PRODUCT PORTFOLIO
LIST OF FIGURES
- FIGURE 01. FLOATING LIQUEFIED NATURAL GAS (FLNG) MARKET, 2022-2032
- FIGURE 02. SEGMENTATION OF FLOATING LIQUEFIED NATURAL GAS (FLNG) MARKET,2022-2032
- FIGURE 03. TOP IMPACTING FACTORS IN FLOATING LIQUEFIED NATURAL GAS (FLNG) MARKET (2022 TO 2032)
- FIGURE 04. TOP INVESTMENT POCKETS IN FLOATING LIQUEFIED NATURAL GAS (FLNG) MARKET (2023-2032)
- FIGURE 05. LOW BARGAINING POWER OF SUPPLIERS
- FIGURE 06. LOW THREAT OF NEW ENTRANTS
- FIGURE 07. LOW THREAT OF SUBSTITUTES
- FIGURE 08. LOW INTENSITY OF RIVALRY
- FIGURE 09. LOW BARGAINING POWER OF BUYERS
- FIGURE 10. GLOBAL FLOATING LIQUEFIED NATURAL GAS (FLNG) MARKET:DRIVERS, RESTRAINTS AND OPPORTUNITIES
- FIGURE 11. PATENT ANALYSIS BY COMPANY
- FIGURE 12. PATENT ANALYSIS BY COUNTRY
- FIGURE 13. FLOATING LIQUEFIED NATURAL GAS (FLNG) MARKET, BY TECHNOLOGY, 2022 AND 2032(%)
- FIGURE 14. COMPARATIVE SHARE ANALYSIS OF FLOATING LIQUEFIED NATURAL GAS (FLNG) MARKET FOR LNG FPSO, BY COUNTRY 2022 AND 2032(%)
- FIGURE 15. COMPARATIVE SHARE ANALYSIS OF FLOATING LIQUEFIED NATURAL GAS (FLNG) MARKET FOR FSRU, BY COUNTRY 2022 AND 2032(%)
- FIGURE 16. COMPARATIVE SHARE ANALYSIS OF FLOATING LIQUEFIED NATURAL GAS (FLNG) MARKET FOR OTHERS, BY COUNTRY 2022 AND 2032(%)
- FIGURE 17. FLOATING LIQUEFIED NATURAL GAS (FLNG) MARKET, BY CAPACITY, 2022 AND 2032(%)
- FIGURE 18. COMPARATIVE SHARE ANALYSIS OF FLOATING LIQUEFIED NATURAL GAS (FLNG) MARKET FOR SMALL/MID-SCALE, BY COUNTRY 2022 AND 2032(%)
- FIGURE 19. COMPARATIVE SHARE ANALYSIS OF FLOATING LIQUEFIED NATURAL GAS (FLNG) MARKET FOR LARGE SCALE, BY COUNTRY 2022 AND 2032(%)
- FIGURE 20. COMPARATIVE SHARE ANALYSIS OF FLOATING LIQUEFIED NATURAL GAS (FLNG) MARKET FOR OTHERS, BY COUNTRY 2022 AND 2032(%)
- FIGURE 21. FLOATING LIQUEFIED NATURAL GAS (FLNG) MARKET BY REGION, 2022 AND 2032(%)
- FIGURE 22. U.S. FLOATING LIQUEFIED NATURAL GAS (FLNG) MARKET, 2022-2032 ($MILLION)
- FIGURE 23. CANADA FLOATING LIQUEFIED NATURAL GAS (FLNG) MARKET, 2022-2032 ($MILLION)
- FIGURE 24. MEXICO FLOATING LIQUEFIED NATURAL GAS (FLNG) MARKET, 2022-2032 ($MILLION)
- FIGURE 25. RUSSIA FLOATING LIQUEFIED NATURAL GAS (FLNG) MARKET, 2022-2032 ($MILLION)
- FIGURE 26. GERMANY FLOATING LIQUEFIED NATURAL GAS (FLNG) MARKET, 2022-2032 ($MILLION)
- FIGURE 27. UK FLOATING LIQUEFIED NATURAL GAS (FLNG) MARKET, 2022-2032 ($MILLION)
- FIGURE 28. FRANCE FLOATING LIQUEFIED NATURAL GAS (FLNG) MARKET, 2022-2032 ($MILLION)
- FIGURE 29. ITALY FLOATING LIQUEFIED NATURAL GAS (FLNG) MARKET, 2022-2032 ($MILLION)
- FIGURE 30. SPAIN FLOATING LIQUEFIED NATURAL GAS (FLNG) MARKET, 2022-2032 ($MILLION)
- FIGURE 31. REST OF EUROPE FLOATING LIQUEFIED NATURAL GAS (FLNG) MARKET, 2022-2032 ($MILLION)
- FIGURE 32. AUSTRALIA FLOATING LIQUEFIED NATURAL GAS (FLNG) MARKET, 2022-2032 ($MILLION)
- FIGURE 33. CHINA FLOATING LIQUEFIED NATURAL GAS (FLNG) MARKET, 2022-2032 ($MILLION)
- FIGURE 34. JAPAN FLOATING LIQUEFIED NATURAL GAS (FLNG) MARKET, 2022-2032 ($MILLION)
- FIGURE 35. INDIA FLOATING LIQUEFIED NATURAL GAS (FLNG) MARKET, 2022-2032 ($MILLION)
- FIGURE 36. SOUTH KOREA FLOATING LIQUEFIED NATURAL GAS (FLNG) MARKET, 2022-2032 ($MILLION)
- FIGURE 37. INDONESIA FLOATING LIQUEFIED NATURAL GAS (FLNG) MARKET, 2022-2032 ($MILLION)
- FIGURE 38. THAILAND FLOATING LIQUEFIED NATURAL GAS (FLNG) MARKET, 2022-2032 ($MILLION)
- FIGURE 39. MALAYSIA FLOATING LIQUEFIED NATURAL GAS (FLNG) MARKET, 2022-2032 ($MILLION)
- FIGURE 40. REST OF ASIA-PACIFIC FLOATING LIQUEFIED NATURAL GAS (FLNG) MARKET, 2022-2032 ($MILLION)
- FIGURE 41. BRAZIL FLOATING LIQUEFIED NATURAL GAS (FLNG) MARKET, 2022-2032 ($MILLION)
- FIGURE 42. SAUDI ARABIA FLOATING LIQUEFIED NATURAL GAS (FLNG) MARKET, 2022-2032 ($MILLION)
- FIGURE 43. SOUTH AFRICA FLOATING LIQUEFIED NATURAL GAS (FLNG) MARKET, 2022-2032 ($MILLION)
- FIGURE 44. UAE FLOATING LIQUEFIED NATURAL GAS (FLNG) MARKET, 2022-2032 ($MILLION)
- FIGURE 45. ARGENTINA FLOATING LIQUEFIED NATURAL GAS (FLNG) MARKET, 2022-2032 ($MILLION)
- FIGURE 46. REST OF LAMEA FLOATING LIQUEFIED NATURAL GAS (FLNG) MARKET, 2022-2032 ($MILLION)
- FIGURE 47. TOP WINNING STRATEGIES, BY YEAR (2023-2023)
- FIGURE 48. TOP WINNING STRATEGIES, BY DEVELOPMENT (2023-2023)
- FIGURE 49. TOP WINNING STRATEGIES, BY COMPANY (2023-2023)
- FIGURE 50. PRODUCT MAPPING OF TOP 10 PLAYERS
- FIGURE 51. COMPETITIVE DASHBOARD
- FIGURE 52. COMPETITIVE HEATMAP: FLOATING LIQUEFIED NATURAL GAS (FLNG) MARKET
- FIGURE 53. TOP PLAYER POSITIONING, 2022
- FIGURE 54. HOEGH LNG: NET REVENUE, 2020-2022 ($MILLION)
- FIGURE 55. GOLAR LNG LIMITED: NET REVENUE, 2020-2022 ($MILLION)
- FIGURE 56. GOLAR LNG LIMITED: REVENUE SHARE BY SEGMENT, 2022 (%)
- FIGURE 57. EXCELERATE ENERGY, INC.: NET REVENUE, 2020-2022 ($MILLION)
- FIGURE 58. ENI S.P.A.: NET SALES, 2020-2022 ($MILLION)
- FIGURE 59. ENI S.P.A.: REVENUE SHARE BY SEGMENT, 2022 (%)
- FIGURE 60. ENI S.P.A.: REVENUE SHARE BY REGION, 2022 (%)
- FIGURE 61. MITSUI O.S.K.LINES: NET REVENUE, 2020-2022 ($MILLION)
- FIGURE 62. MITSUI O.S.K.LINES: REVENUE SHARE BY SEGMENT, 2022 (%)
- FIGURE 63. SHELL PLC: NET REVENUE, 2020-2022 ($MILLION)
- FIGURE 64. SHELL PLC: RESEARCH & DEVELOPMENT EXPENDITURE, 2020-2022 ($MILLION)
- FIGURE 65. SHELL PLC: REVENUE SHARE BY SEGMENT, 2022 (%)
- FIGURE 66. SHELL PLC: REVENUE SHARE BY REGION, 2022 (%)
- FIGURE 67. PETROLIAM NASIONAL BERHAD (PETRONAS): SALES REVENUE, 2020-2022 ($MILLION)
- FIGURE 68. EXMAR: NET REVENUE, 2020-2022 ($MILLION)
- FIGURE 69. EXMAR: REVENUE SHARE BY SEGMENT, 2022 (%)
- FIGURE 70. WOODSIDE ENERGY GROUP LTD: NET REVENUE, 2020-2022 ($MILLION)
- FIGURE 71. WOODSIDE ENERGY GROUP LTD: REVENUE SHARE BY REGION, 2022 (%)
- FIGURE 72. BASF SE: NET SALES, 2020-2022 ($MILLION)
- FIGURE 73. BASF SE: RESEARCH & DEVELOPMENT EXPENDITURE, 2020-2022 ($MILLION)
- FIGURE 74. BASF SE: REVENUE SHARE BY SEGMENT, 2022 (%)
- FIGURE 75. BASF SE: REVENUE SHARE BY REGION, 2022 (%)
- FIGURE 76. ABB LTD.: NET SALES, 2020-2022 ($MILLION)
- FIGURE 77. ABB LTD.: REVENUE SHARE BY SEGMENT, 2022 (%)
- FIGURE 78. ABB LTD.: REVENUE SHARE BY REGION, 2022 (%)

