
PUBLISHER: Allied Market Research | PRODUCT CODE: 1472200

PUBLISHER: Allied Market Research | PRODUCT CODE: 1472200
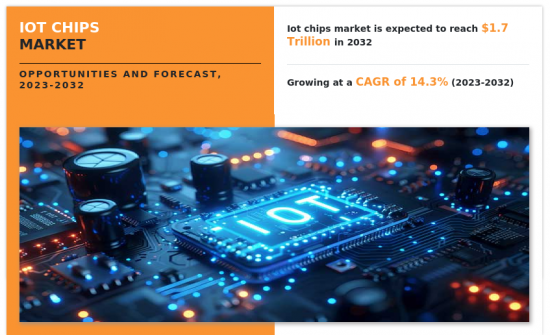
IoT Chips Market By Hardware, By Industry Vertical : Global Opportunity Analysis and Industry Forecast, 2023-2032
The IOT chip market was valued at $432.01 billion in 2022 and is estimated to reach $1.7 trillion by 2032, exhibiting a CAGR of 14.31% from 2023 to 2032.
IoT stands for a wireless network connecting physical devices within a specific location. These devices are equipped with sensors, software, and other technologies enabling wireless data transmission. Therefore, an IoT chip, a small electronic device embedded in various objects and machines, is essential for the IoT system to function effectively. Without it, the entire process would be futile. The advent of IoT has vastly broadened the scope of both personal and business opportunities, offering limitless potential for innovation and connectivity.
The IOT chip market is propelled by an increasing deployment of 5G technology. With its higher data speeds, lower latency, and greater capacity, 5G facilitates the seamless connectivity and real-time communication required for IoT devices to operate efficiently. This advanced network infrastructure enables IoT applications to transmit and process large volumes of data quickly and reliably, supporting a wide range of use cases across industries such as smart cities, healthcare, manufacturing, and transportation. As the adoption of 5G expands globally, the demand for IoT chips capable of leveraging the capabilities of this technology continues to rise, driving innovation and growth in the IoT chip market. However, the proliferation of IoT devices raises concerns about cybersecurity, including data breaches, privacy issues, and vulnerabilities in IoT chip designs, which hinder market growth. On the other hand, continuous technological innovation, including the development of smaller, more energy-efficient chips, novel sensor technologies, and improved wireless communication standards, opens up new opportunities for IoT chip manufacturers to address evolving market demands.
The IOT chip market is segmented on the basis of hardware, industry vertical, and region. On the basis of hardware, the market is divided into processor, sensor, connectivity IC, memory device, logic device, and others. On the basis of industry vertical, the market is classified into healthcare, consumer electronics, industrial, automotive, BFSI, retail, and others.
On the basis of region, it is analyzed across North America (the U.S., Canada, and Mexico), Europe (the UK, Germany, France, Italy, Spain, and the rest of Europe), Asia-Pacific (China, Japan, India, South Korea, Australia, and rest of Asia-Pacific), Latin America (Brazil, Argentina, and rest of Latin America), and Middle East and Africa (UAE, Saudi Arabia, Qatar, South Africa, and rest of Middle East & Africa).
The key players profiled in the report include Qualcomm Technologies Inc., STMicroelectronics NV, Samsung Electronics Co. Ltd, Analog Devices Inc., Intel Corporation, Texas Instruments Incorporated, NXP Semiconductors NV, Infineon Technologies AG, MediaTek Inc., and Microchip Technology Inc. These key players have adopted strategies such as product portfolio expansion, mergers & acquisitions, agreements, geographical expansion, and collaborations to enhance their market penetration.
Key Benefits For Stakeholders
- This report provides a quantitative analysis of the market segments, current trends, estimations, and dynamics of the iot chips market analysis from 2022 to 2032 to identify the prevailing iot chips market opportunities.
- The market research is offered along with information related to key drivers, restraints, and opportunities.
- Porter's five forces analysis highlights the potency of buyers and suppliers to enable stakeholders make profit-oriented business decisions and strengthen their supplier-buyer network.
- In-depth analysis of the iot chips market segmentation assists to determine the prevailing market opportunities.
- Major countries in each region are mapped according to their revenue contribution to the global market.
- Market player positioning facilitates benchmarking and provides a clear understanding of the present position of the market players.
- The report includes the analysis of the regional as well as global iot chips market trends, key players, market segments, application areas, and market growth strategies.
Additional benefits you will get with this purchase are:
- Quarterly Update and* (only available with a corporate license, on listed price)
- 5 additional Company Profile of client Choice pre- or Post-purchase, as a free update.
- Free Upcoming Version on the Purchase of Five and Enterprise User License.
- 16 analyst hours of support* (post-purchase, if you find additional data requirements upon review of the report, you may receive support amounting to 16 analyst hours to solve questions, and post-sale queries)
- 15% Free Customization* (in case the scope or segment of the report does not match your requirements, 15% is equivalent to 3 working days of free work, applicable once)
- Free data Pack on the Five and Enterprise User License. (Excel version of the report)
- Free Updated report if the report is 6-12 months old or older.
- 24-hour priority response*
- Free Industry updates and white papers.
Possible Customization with this report (with additional cost and timeline, please talk to the sales executive to know more)
- Product Life Cycles
- New Product Development/ Product Matrix of Key Players
- Additional company profiles with specific to client's interest
- Additional country or region analysis- market size and forecast
- Key player details (including location, contact details, supplier/vendor network etc. in excel format)
- Market share analysis of players at global/region/country level
- SWOT Analysis
Key Market Segments
By Hardware
- Processor
- Sensor
- Connectivity IC
- Memory Device
- Logic Device
- Others
By Industry Vertical
- Automotive
- Banking Financial Services and Insurance
- Retail
- Others
- Healthcare
- Consumer Electronics
- Industrial
By Region
- North America
- U.S.
- Canada
- Mexico
- Europe
- UK
- Germany
- France
- Italy
- Spain
- Rest of Europe
- Asia-Pacific
- China
- India
- Japan
- South Korea
- Australia
- Rest of Asia-Pacific
- Latin America
- Brazil
- Argentina
- Rest of Latin America
- Middle East and Africa
- UAE
- Saudi Arabia
- Qatar
- Rest of Middle East And Africa
Key Market Players:
- Qualcomm Technologies Inc.
- STMicroelectronics NV.
- Samsung Electronics Co. Ltd
- Analog Devices Inc.
- Intel Corporation
- Texas Instruments Incorporated
- NXP Semiconductors NV
- Infineon Technologies AG
- Microchip Technology Inc.
- MediaTek Inc.
TABLE OF CONTENTS
CHAPTER 1: INTRODUCTION
- 1.1. Report description
- 1.2. Key market segments
- 1.3. Key benefits to the stakeholders
- 1.4. Research methodology
- 1.4.1. Primary research
- 1.4.2. Secondary research
- 1.4.3. Analyst tools and models
CHAPTER 2: EXECUTIVE SUMMARY
- 2.1. CXO perspective
CHAPTER 3: MARKET OVERVIEW
- 3.1. Market definition and scope
- 3.2. Key findings
- 3.2.1. Top impacting factors
- 3.2.2. Top investment pockets
- 3.3. Porter's five forces analysis
- 3.4. Market dynamics
- 3.4.1. Drivers
- 3.4.2. Restraints
- 3.4.3. Opportunities
CHAPTER 4: IOT CHIPS MARKET, BY HARDWARE
- 4.1. Overview
- 4.1.1. Market size and forecast
- 4.2. Processor
- 4.2.1. Key market trends, growth factors and opportunities
- 4.2.2. Market size and forecast, by region
- 4.2.3. Market share analysis by country
- 4.3. Sensor
- 4.3.1. Key market trends, growth factors and opportunities
- 4.3.2. Market size and forecast, by region
- 4.3.3. Market share analysis by country
- 4.4. Connectivity IC
- 4.4.1. Key market trends, growth factors and opportunities
- 4.4.2. Market size and forecast, by region
- 4.4.3. Market share analysis by country
- 4.5. Memory Device
- 4.5.1. Key market trends, growth factors and opportunities
- 4.5.2. Market size and forecast, by region
- 4.5.3. Market share analysis by country
- 4.6. Logic Device
- 4.6.1. Key market trends, growth factors and opportunities
- 4.6.2. Market size and forecast, by region
- 4.6.3. Market share analysis by country
- 4.7. Others
- 4.7.1. Key market trends, growth factors and opportunities
- 4.7.2. Market size and forecast, by region
- 4.7.3. Market share analysis by country
CHAPTER 5: IOT CHIPS MARKET, BY INDUSTRY VERTICAL
- 5.1. Overview
- 5.1.1. Market size and forecast
- 5.2. Healthcare
- 5.2.1. Key market trends, growth factors and opportunities
- 5.2.2. Market size and forecast, by region
- 5.2.3. Market share analysis by country
- 5.3. Consumer Electronics
- 5.3.1. Key market trends, growth factors and opportunities
- 5.3.2. Market size and forecast, by region
- 5.3.3. Market share analysis by country
- 5.4. Industrial
- 5.4.1. Key market trends, growth factors and opportunities
- 5.4.2. Market size and forecast, by region
- 5.4.3. Market share analysis by country
- 5.5. Automotive
- 5.5.1. Key market trends, growth factors and opportunities
- 5.5.2. Market size and forecast, by region
- 5.5.3. Market share analysis by country
- 5.6. Banking Financial Services and Insurance
- 5.6.1. Key market trends, growth factors and opportunities
- 5.6.2. Market size and forecast, by region
- 5.6.3. Market share analysis by country
- 5.7. Retail
- 5.7.1. Key market trends, growth factors and opportunities
- 5.7.2. Market size and forecast, by region
- 5.7.3. Market share analysis by country
- 5.8. Others
- 5.8.1. Key market trends, growth factors and opportunities
- 5.8.2. Market size and forecast, by region
- 5.8.3. Market share analysis by country
CHAPTER 6: IOT CHIPS MARKET, BY REGION
- 6.1. Overview
- 6.1.1. Market size and forecast By Region
- 6.2. North America
- 6.2.1. Key market trends, growth factors and opportunities
- 6.2.2. Market size and forecast, by Hardware
- 6.2.3. Market size and forecast, by Industry Vertical
- 6.2.4. Market size and forecast, by country
- 6.2.4.1. U.S.
- 6.2.4.1.1. Market size and forecast, by Hardware
- 6.2.4.1.2. Market size and forecast, by Industry Vertical
- 6.2.4.2. Canada
- 6.2.4.2.1. Market size and forecast, by Hardware
- 6.2.4.2.2. Market size and forecast, by Industry Vertical
- 6.2.4.3. Mexico
- 6.2.4.3.1. Market size and forecast, by Hardware
- 6.2.4.3.2. Market size and forecast, by Industry Vertical
- 6.3. Europe
- 6.3.1. Key market trends, growth factors and opportunities
- 6.3.2. Market size and forecast, by Hardware
- 6.3.3. Market size and forecast, by Industry Vertical
- 6.3.4. Market size and forecast, by country
- 6.3.4.1. UK
- 6.3.4.1.1. Market size and forecast, by Hardware
- 6.3.4.1.2. Market size and forecast, by Industry Vertical
- 6.3.4.2. Germany
- 6.3.4.2.1. Market size and forecast, by Hardware
- 6.3.4.2.2. Market size and forecast, by Industry Vertical
- 6.3.4.3. France
- 6.3.4.3.1. Market size and forecast, by Hardware
- 6.3.4.3.2. Market size and forecast, by Industry Vertical
- 6.3.4.4. Italy
- 6.3.4.4.1. Market size and forecast, by Hardware
- 6.3.4.4.2. Market size and forecast, by Industry Vertical
- 6.3.4.5. Spain
- 6.3.4.5.1. Market size and forecast, by Hardware
- 6.3.4.5.2. Market size and forecast, by Industry Vertical
- 6.3.4.6. Rest of Europe
- 6.3.4.6.1. Market size and forecast, by Hardware
- 6.3.4.6.2. Market size and forecast, by Industry Vertical
- 6.4. Asia-Pacific
- 6.4.1. Key market trends, growth factors and opportunities
- 6.4.2. Market size and forecast, by Hardware
- 6.4.3. Market size and forecast, by Industry Vertical
- 6.4.4. Market size and forecast, by country
- 6.4.4.1. China
- 6.4.4.1.1. Market size and forecast, by Hardware
- 6.4.4.1.2. Market size and forecast, by Industry Vertical
- 6.4.4.2. India
- 6.4.4.2.1. Market size and forecast, by Hardware
- 6.4.4.2.2. Market size and forecast, by Industry Vertical
- 6.4.4.3. Japan
- 6.4.4.3.1. Market size and forecast, by Hardware
- 6.4.4.3.2. Market size and forecast, by Industry Vertical
- 6.4.4.4. South Korea
- 6.4.4.4.1. Market size and forecast, by Hardware
- 6.4.4.4.2. Market size and forecast, by Industry Vertical
- 6.4.4.5. Australia
- 6.4.4.5.1. Market size and forecast, by Hardware
- 6.4.4.5.2. Market size and forecast, by Industry Vertical
- 6.4.4.6. Rest of Asia-Pacific
- 6.4.4.6.1. Market size and forecast, by Hardware
- 6.4.4.6.2. Market size and forecast, by Industry Vertical
- 6.5. Latin America
- 6.5.1. Key market trends, growth factors and opportunities
- 6.5.2. Market size and forecast, by Hardware
- 6.5.3. Market size and forecast, by Industry Vertical
- 6.5.4. Market size and forecast, by country
- 6.5.4.1. Brazil
- 6.5.4.1.1. Market size and forecast, by Hardware
- 6.5.4.1.2. Market size and forecast, by Industry Vertical
- 6.5.4.2. Argentina
- 6.5.4.2.1. Market size and forecast, by Hardware
- 6.5.4.2.2. Market size and forecast, by Industry Vertical
- 6.5.4.3. Rest of Latin America
- 6.5.4.3.1. Market size and forecast, by Hardware
- 6.5.4.3.2. Market size and forecast, by Industry Vertical
- 6.6. Middle East and Africa
- 6.6.1. Key market trends, growth factors and opportunities
- 6.6.2. Market size and forecast, by Hardware
- 6.6.3. Market size and forecast, by Industry Vertical
- 6.6.4. Market size and forecast, by country
- 6.6.4.1. UAE
- 6.6.4.1.1. Market size and forecast, by Hardware
- 6.6.4.1.2. Market size and forecast, by Industry Vertical
- 6.6.4.2. Saudi Arabia
- 6.6.4.2.1. Market size and forecast, by Hardware
- 6.6.4.2.2. Market size and forecast, by Industry Vertical
- 6.6.4.3. Qatar
- 6.6.4.3.1. Market size and forecast, by Hardware
- 6.6.4.3.2. Market size and forecast, by Industry Vertical
- 6.6.4.4. Rest of Middle East And Africa
- 6.6.4.4.1. Market size and forecast, by Hardware
- 6.6.4.4.2. Market size and forecast, by Industry Vertical
CHAPTER 7: COMPETITIVE LANDSCAPE
- 7.1. Introduction
- 7.2. Top winning strategies
- 7.3. Product mapping of top 10 player
- 7.4. Competitive dashboard
- 7.5. Competitive heatmap
- 7.6. Top player positioning, 2022
CHAPTER 8: COMPANY PROFILES
- 8.1. Qualcomm Technologies Inc.
- 8.1.1. Company overview
- 8.1.2. Key executives
- 8.1.3. Company snapshot
- 8.1.4. Operating business segments
- 8.1.5. Product portfolio
- 8.1.6. Business performance
- 8.1.7. Key strategic moves and developments
- 8.2. STMicroelectronics NV.
- 8.2.1. Company overview
- 8.2.2. Key executives
- 8.2.3. Company snapshot
- 8.2.4. Operating business segments
- 8.2.5. Product portfolio
- 8.2.6. Business performance
- 8.2.7. Key strategic moves and developments
- 8.3. Samsung Electronics Co. Ltd
- 8.3.1. Company overview
- 8.3.2. Key executives
- 8.3.3. Company snapshot
- 8.3.4. Operating business segments
- 8.3.5. Product portfolio
- 8.3.6. Business performance
- 8.3.7. Key strategic moves and developments
- 8.4. Analog Devices Inc.
- 8.4.1. Company overview
- 8.4.2. Key executives
- 8.4.3. Company snapshot
- 8.4.4. Operating business segments
- 8.4.5. Product portfolio
- 8.4.6. Business performance
- 8.4.7. Key strategic moves and developments
- 8.5. Intel Corporation
- 8.5.1. Company overview
- 8.5.2. Key executives
- 8.5.3. Company snapshot
- 8.5.4. Operating business segments
- 8.5.5. Product portfolio
- 8.5.6. Business performance
- 8.5.7. Key strategic moves and developments
- 8.6. Texas Instruments Incorporated
- 8.6.1. Company overview
- 8.6.2. Key executives
- 8.6.3. Company snapshot
- 8.6.4. Operating business segments
- 8.6.5. Product portfolio
- 8.6.6. Business performance
- 8.6.7. Key strategic moves and developments
- 8.7. NXP Semiconductors NV
- 8.7.1. Company overview
- 8.7.2. Key executives
- 8.7.3. Company snapshot
- 8.7.4. Operating business segments
- 8.7.5. Product portfolio
- 8.7.6. Business performance
- 8.7.7. Key strategic moves and developments
- 8.8. Infineon Technologies AG
- 8.8.1. Company overview
- 8.8.2. Key executives
- 8.8.3. Company snapshot
- 8.8.4. Operating business segments
- 8.8.5. Product portfolio
- 8.8.6. Business performance
- 8.8.7. Key strategic moves and developments
- 8.9. Microchip Technology Inc.
- 8.9.1. Company overview
- 8.9.2. Key executives
- 8.9.3. Company snapshot
- 8.9.4. Operating business segments
- 8.9.5. Product portfolio
- 8.9.6. Business performance
- 8.9.7. Key strategic moves and developments
- 8.10. MediaTek Inc.
- 8.10.1. Company overview
- 8.10.2. Key executives
- 8.10.3. Company snapshot
- 8.10.4. Operating business segments
- 8.10.5. Product portfolio
- 8.10.6. Business performance
- 8.10.7. Key strategic moves and developments
LIST OF TABLES
- TABLE 01. GLOBAL IOT CHIPS MARKET, BY HARDWARE, 2022-2032 ($BILLION)
- TABLE 02. IOT CHIPS MARKET FOR PROCESSOR, BY REGION, 2022-2032 ($BILLION)
- TABLE 03. IOT CHIPS MARKET FOR SENSOR, BY REGION, 2022-2032 ($BILLION)
- TABLE 04. IOT CHIPS MARKET FOR CONNECTIVITY IC, BY REGION, 2022-2032 ($BILLION)
- TABLE 05. IOT CHIPS MARKET FOR MEMORY DEVICE, BY REGION, 2022-2032 ($BILLION)
- TABLE 06. IOT CHIPS MARKET FOR LOGIC DEVICE, BY REGION, 2022-2032 ($BILLION)
- TABLE 07. IOT CHIPS MARKET FOR OTHERS, BY REGION, 2022-2032 ($BILLION)
- TABLE 08. GLOBAL IOT CHIPS MARKET, BY INDUSTRY VERTICAL, 2022-2032 ($BILLION)
- TABLE 09. IOT CHIPS MARKET FOR HEALTHCARE, BY REGION, 2022-2032 ($BILLION)
- TABLE 10. IOT CHIPS MARKET FOR CONSUMER ELECTRONICS, BY REGION, 2022-2032 ($BILLION)
- TABLE 11. IOT CHIPS MARKET FOR INDUSTRIAL, BY REGION, 2022-2032 ($BILLION)
- TABLE 12. IOT CHIPS MARKET FOR AUTOMOTIVE, BY REGION, 2022-2032 ($BILLION)
- TABLE 13. IOT CHIPS MARKET FOR BANKING FINANCIAL SERVICES AND INSURANCE, BY REGION, 2022-2032 ($BILLION)
- TABLE 14. IOT CHIPS MARKET FOR RETAIL, BY REGION, 2022-2032 ($BILLION)
- TABLE 15. IOT CHIPS MARKET FOR OTHERS, BY REGION, 2022-2032 ($BILLION)
- TABLE 16. IOT CHIPS MARKET, BY REGION, 2022-2032 ($BILLION)
- TABLE 17. NORTH AMERICA IOT CHIPS MARKET, BY HARDWARE, 2022-2032 ($BILLION)
- TABLE 18. NORTH AMERICA IOT CHIPS MARKET, BY INDUSTRY VERTICAL, 2022-2032 ($BILLION)
- TABLE 19. NORTH AMERICA IOT CHIPS MARKET, BY COUNTRY, 2022-2032 ($BILLION)
- TABLE 20. U.S. IOT CHIPS MARKET, BY HARDWARE, 2022-2032 ($BILLION)
- TABLE 21. U.S. IOT CHIPS MARKET, BY INDUSTRY VERTICAL, 2022-2032 ($BILLION)
- TABLE 22. CANADA IOT CHIPS MARKET, BY HARDWARE, 2022-2032 ($BILLION)
- TABLE 23. CANADA IOT CHIPS MARKET, BY INDUSTRY VERTICAL, 2022-2032 ($BILLION)
- TABLE 24. MEXICO IOT CHIPS MARKET, BY HARDWARE, 2022-2032 ($BILLION)
- TABLE 25. MEXICO IOT CHIPS MARKET, BY INDUSTRY VERTICAL, 2022-2032 ($BILLION)
- TABLE 26. EUROPE IOT CHIPS MARKET, BY HARDWARE, 2022-2032 ($BILLION)
- TABLE 27. EUROPE IOT CHIPS MARKET, BY INDUSTRY VERTICAL, 2022-2032 ($BILLION)
- TABLE 28. EUROPE IOT CHIPS MARKET, BY COUNTRY, 2022-2032 ($BILLION)
- TABLE 29. UK IOT CHIPS MARKET, BY HARDWARE, 2022-2032 ($BILLION)
- TABLE 30. UK IOT CHIPS MARKET, BY INDUSTRY VERTICAL, 2022-2032 ($BILLION)
- TABLE 31. GERMANY IOT CHIPS MARKET, BY HARDWARE, 2022-2032 ($BILLION)
- TABLE 32. GERMANY IOT CHIPS MARKET, BY INDUSTRY VERTICAL, 2022-2032 ($BILLION)
- TABLE 33. FRANCE IOT CHIPS MARKET, BY HARDWARE, 2022-2032 ($BILLION)
- TABLE 34. FRANCE IOT CHIPS MARKET, BY INDUSTRY VERTICAL, 2022-2032 ($BILLION)
- TABLE 35. ITALY IOT CHIPS MARKET, BY HARDWARE, 2022-2032 ($BILLION)
- TABLE 36. ITALY IOT CHIPS MARKET, BY INDUSTRY VERTICAL, 2022-2032 ($BILLION)
- TABLE 37. SPAIN IOT CHIPS MARKET, BY HARDWARE, 2022-2032 ($BILLION)
- TABLE 38. SPAIN IOT CHIPS MARKET, BY INDUSTRY VERTICAL, 2022-2032 ($BILLION)
- TABLE 39. REST OF EUROPE IOT CHIPS MARKET, BY HARDWARE, 2022-2032 ($BILLION)
- TABLE 40. REST OF EUROPE IOT CHIPS MARKET, BY INDUSTRY VERTICAL, 2022-2032 ($BILLION)
- TABLE 41. ASIA-PACIFIC IOT CHIPS MARKET, BY HARDWARE, 2022-2032 ($BILLION)
- TABLE 42. ASIA-PACIFIC IOT CHIPS MARKET, BY INDUSTRY VERTICAL, 2022-2032 ($BILLION)
- TABLE 43. ASIA-PACIFIC IOT CHIPS MARKET, BY COUNTRY, 2022-2032 ($BILLION)
- TABLE 44. CHINA IOT CHIPS MARKET, BY HARDWARE, 2022-2032 ($BILLION)
- TABLE 45. CHINA IOT CHIPS MARKET, BY INDUSTRY VERTICAL, 2022-2032 ($BILLION)
- TABLE 46. INDIA IOT CHIPS MARKET, BY HARDWARE, 2022-2032 ($BILLION)
- TABLE 47. INDIA IOT CHIPS MARKET, BY INDUSTRY VERTICAL, 2022-2032 ($BILLION)
- TABLE 48. JAPAN IOT CHIPS MARKET, BY HARDWARE, 2022-2032 ($BILLION)
- TABLE 49. JAPAN IOT CHIPS MARKET, BY INDUSTRY VERTICAL, 2022-2032 ($BILLION)
- TABLE 50. SOUTH KOREA IOT CHIPS MARKET, BY HARDWARE, 2022-2032 ($BILLION)
- TABLE 51. SOUTH KOREA IOT CHIPS MARKET, BY INDUSTRY VERTICAL, 2022-2032 ($BILLION)
- TABLE 52. AUSTRALIA IOT CHIPS MARKET, BY HARDWARE, 2022-2032 ($BILLION)
- TABLE 53. AUSTRALIA IOT CHIPS MARKET, BY INDUSTRY VERTICAL, 2022-2032 ($BILLION)
- TABLE 54. REST OF ASIA-PACIFIC IOT CHIPS MARKET, BY HARDWARE, 2022-2032 ($BILLION)
- TABLE 55. REST OF ASIA-PACIFIC IOT CHIPS MARKET, BY INDUSTRY VERTICAL, 2022-2032 ($BILLION)
- TABLE 56. LATIN AMERICA IOT CHIPS MARKET, BY HARDWARE, 2022-2032 ($BILLION)
- TABLE 57. LATIN AMERICA IOT CHIPS MARKET, BY INDUSTRY VERTICAL, 2022-2032 ($BILLION)
- TABLE 58. LATIN AMERICA IOT CHIPS MARKET, BY COUNTRY, 2022-2032 ($BILLION)
- TABLE 59. BRAZIL IOT CHIPS MARKET, BY HARDWARE, 2022-2032 ($BILLION)
- TABLE 60. BRAZIL IOT CHIPS MARKET, BY INDUSTRY VERTICAL, 2022-2032 ($BILLION)
- TABLE 61. ARGENTINA IOT CHIPS MARKET, BY HARDWARE, 2022-2032 ($BILLION)
- TABLE 62. ARGENTINA IOT CHIPS MARKET, BY INDUSTRY VERTICAL, 2022-2032 ($BILLION)
- TABLE 63. REST OF LATIN AMERICA IOT CHIPS MARKET, BY HARDWARE, 2022-2032 ($BILLION)
- TABLE 64. REST OF LATIN AMERICA IOT CHIPS MARKET, BY INDUSTRY VERTICAL, 2022-2032 ($BILLION)
- TABLE 65. MIDDLE EAST AND AFRICA IOT CHIPS MARKET, BY HARDWARE, 2022-2032 ($BILLION)
- TABLE 66. MIDDLE EAST AND AFRICA IOT CHIPS MARKET, BY INDUSTRY VERTICAL, 2022-2032 ($BILLION)
- TABLE 67. MIDDLE EAST AND AFRICA IOT CHIPS MARKET, BY COUNTRY, 2022-2032 ($BILLION)
- TABLE 68. UAE IOT CHIPS MARKET, BY HARDWARE, 2022-2032 ($BILLION)
- TABLE 69. UAE IOT CHIPS MARKET, BY INDUSTRY VERTICAL, 2022-2032 ($BILLION)
- TABLE 70. SAUDI ARABIA IOT CHIPS MARKET, BY HARDWARE, 2022-2032 ($BILLION)
- TABLE 71. SAUDI ARABIA IOT CHIPS MARKET, BY INDUSTRY VERTICAL, 2022-2032 ($BILLION)
- TABLE 72. QATAR IOT CHIPS MARKET, BY HARDWARE, 2022-2032 ($BILLION)
- TABLE 73. QATAR IOT CHIPS MARKET, BY INDUSTRY VERTICAL, 2022-2032 ($BILLION)
- TABLE 74. REST OF MIDDLE EAST AND AFRICA IOT CHIPS MARKET, BY HARDWARE, 2022-2032 ($BILLION)
- TABLE 75. REST OF MIDDLE EAST AND AFRICA IOT CHIPS MARKET, BY INDUSTRY VERTICAL, 2022-2032 ($BILLION)
- TABLE 76. QUALCOMM TECHNOLOGIES INC.: KEY EXECUTIVES
- TABLE 77. QUALCOMM TECHNOLOGIES INC.: COMPANY SNAPSHOT
- TABLE 78. QUALCOMM TECHNOLOGIES INC.: PRODUCT SEGMENTS
- TABLE 79. QUALCOMM TECHNOLOGIES INC.: SERVICE SEGMENTS
- TABLE 80. QUALCOMM TECHNOLOGIES INC.: PRODUCT PORTFOLIO
- TABLE 81. QUALCOMM TECHNOLOGIES INC.: KEY STRATERGIES
- TABLE 82. STMICROELECTRONICS NV.: KEY EXECUTIVES
- TABLE 83. STMICROELECTRONICS NV.: COMPANY SNAPSHOT
- TABLE 84. STMICROELECTRONICS NV.: PRODUCT SEGMENTS
- TABLE 85. STMICROELECTRONICS NV.: SERVICE SEGMENTS
- TABLE 86. STMICROELECTRONICS NV.: PRODUCT PORTFOLIO
- TABLE 87. STMICROELECTRONICS NV.: KEY STRATERGIES
- TABLE 88. SAMSUNG ELECTRONICS CO. LTD: KEY EXECUTIVES
- TABLE 89. SAMSUNG ELECTRONICS CO. LTD: COMPANY SNAPSHOT
- TABLE 90. SAMSUNG ELECTRONICS CO. LTD: PRODUCT SEGMENTS
- TABLE 91. SAMSUNG ELECTRONICS CO. LTD: SERVICE SEGMENTS
- TABLE 92. SAMSUNG ELECTRONICS CO. LTD: PRODUCT PORTFOLIO
- TABLE 93. SAMSUNG ELECTRONICS CO. LTD: KEY STRATERGIES
- TABLE 94. ANALOG DEVICES INC.: KEY EXECUTIVES
- TABLE 95. ANALOG DEVICES INC.: COMPANY SNAPSHOT
- TABLE 96. ANALOG DEVICES INC.: PRODUCT SEGMENTS
- TABLE 97. ANALOG DEVICES INC.: SERVICE SEGMENTS
- TABLE 98. ANALOG DEVICES INC.: PRODUCT PORTFOLIO
- TABLE 99. ANALOG DEVICES INC.: KEY STRATERGIES
- TABLE 100. INTEL CORPORATION: KEY EXECUTIVES
- TABLE 101. INTEL CORPORATION: COMPANY SNAPSHOT
- TABLE 102. INTEL CORPORATION: PRODUCT SEGMENTS
- TABLE 103. INTEL CORPORATION: SERVICE SEGMENTS
- TABLE 104. INTEL CORPORATION: PRODUCT PORTFOLIO
- TABLE 105. INTEL CORPORATION: KEY STRATERGIES
- TABLE 106. TEXAS INSTRUMENTS INCORPORATED: KEY EXECUTIVES
- TABLE 107. TEXAS INSTRUMENTS INCORPORATED: COMPANY SNAPSHOT
- TABLE 108. TEXAS INSTRUMENTS INCORPORATED: PRODUCT SEGMENTS
- TABLE 109. TEXAS INSTRUMENTS INCORPORATED: SERVICE SEGMENTS
- TABLE 110. TEXAS INSTRUMENTS INCORPORATED: PRODUCT PORTFOLIO
- TABLE 111. TEXAS INSTRUMENTS INCORPORATED: KEY STRATERGIES
- TABLE 112. NXP SEMICONDUCTORS NV: KEY EXECUTIVES
- TABLE 113. NXP SEMICONDUCTORS NV: COMPANY SNAPSHOT
- TABLE 114. NXP SEMICONDUCTORS NV: PRODUCT SEGMENTS
- TABLE 115. NXP SEMICONDUCTORS NV: SERVICE SEGMENTS
- TABLE 116. NXP SEMICONDUCTORS NV: PRODUCT PORTFOLIO
- TABLE 117. NXP SEMICONDUCTORS NV: KEY STRATERGIES
- TABLE 118. INFINEON TECHNOLOGIES AG: KEY EXECUTIVES
- TABLE 119. INFINEON TECHNOLOGIES AG: COMPANY SNAPSHOT
- TABLE 120. INFINEON TECHNOLOGIES AG: PRODUCT SEGMENTS
- TABLE 121. INFINEON TECHNOLOGIES AG: SERVICE SEGMENTS
- TABLE 122. INFINEON TECHNOLOGIES AG: PRODUCT PORTFOLIO
- TABLE 123. INFINEON TECHNOLOGIES AG: KEY STRATERGIES
- TABLE 124. MICROCHIP TECHNOLOGY INC.: KEY EXECUTIVES
- TABLE 125. MICROCHIP TECHNOLOGY INC.: COMPANY SNAPSHOT
- TABLE 126. MICROCHIP TECHNOLOGY INC.: PRODUCT SEGMENTS
- TABLE 127. MICROCHIP TECHNOLOGY INC.: SERVICE SEGMENTS
- TABLE 128. MICROCHIP TECHNOLOGY INC.: PRODUCT PORTFOLIO
- TABLE 129. MICROCHIP TECHNOLOGY INC.: KEY STRATERGIES
- TABLE 130. MEDIATEK INC.: KEY EXECUTIVES
- TABLE 131. MEDIATEK INC.: COMPANY SNAPSHOT
- TABLE 132. MEDIATEK INC.: PRODUCT SEGMENTS
- TABLE 133. MEDIATEK INC.: SERVICE SEGMENTS
- TABLE 134. MEDIATEK INC.: PRODUCT PORTFOLIO
- TABLE 135. MEDIATEK INC.: KEY STRATERGIES
LIST OF FIGURES
- FIGURE 01. IOT CHIPS MARKET, 2022-2032
- FIGURE 02. SEGMENTATION OF IOT CHIPS MARKET,2022-2032
- FIGURE 03. TOP IMPACTING FACTORS IN IOT CHIPS MARKET
- FIGURE 04. TOP INVESTMENT POCKETS IN IOT CHIPS MARKET (2023-2032)
- FIGURE 05. BARGAINING POWER OF SUPPLIERS
- FIGURE 06. BARGAINING POWER OF BUYERS
- FIGURE 07. THREAT OF SUBSTITUTION
- FIGURE 08. THREAT OF SUBSTITUTION
- FIGURE 09. COMPETITIVE RIVALRY
- FIGURE 10. GLOBAL IOT CHIPS MARKET:DRIVERS, RESTRAINTS AND OPPORTUNITIES
- FIGURE 11. IOT CHIPS MARKET, BY HARDWARE, 2022 AND 2032(%)
- FIGURE 12. COMPARATIVE SHARE ANALYSIS OF IOT CHIPS MARKET FOR PROCESSOR, BY COUNTRY 2022 AND 2032(%)
- FIGURE 13. COMPARATIVE SHARE ANALYSIS OF IOT CHIPS MARKET FOR SENSOR, BY COUNTRY 2022 AND 2032(%)
- FIGURE 14. COMPARATIVE SHARE ANALYSIS OF IOT CHIPS MARKET FOR CONNECTIVITY IC, BY COUNTRY 2022 AND 2032(%)
- FIGURE 15. COMPARATIVE SHARE ANALYSIS OF IOT CHIPS MARKET FOR MEMORY DEVICE, BY COUNTRY 2022 AND 2032(%)
- FIGURE 16. COMPARATIVE SHARE ANALYSIS OF IOT CHIPS MARKET FOR LOGIC DEVICE, BY COUNTRY 2022 AND 2032(%)
- FIGURE 17. COMPARATIVE SHARE ANALYSIS OF IOT CHIPS MARKET FOR OTHERS, BY COUNTRY 2022 AND 2032(%)
- FIGURE 18. IOT CHIPS MARKET, BY INDUSTRY VERTICAL, 2022 AND 2032(%)
- FIGURE 19. COMPARATIVE SHARE ANALYSIS OF IOT CHIPS MARKET FOR HEALTHCARE, BY COUNTRY 2022 AND 2032(%)
- FIGURE 20. COMPARATIVE SHARE ANALYSIS OF IOT CHIPS MARKET FOR CONSUMER ELECTRONICS, BY COUNTRY 2022 AND 2032(%)
- FIGURE 21. COMPARATIVE SHARE ANALYSIS OF IOT CHIPS MARKET FOR INDUSTRIAL, BY COUNTRY 2022 AND 2032(%)
- FIGURE 22. COMPARATIVE SHARE ANALYSIS OF IOT CHIPS MARKET FOR AUTOMOTIVE, BY COUNTRY 2022 AND 2032(%)
- FIGURE 23. COMPARATIVE SHARE ANALYSIS OF IOT CHIPS MARKET FOR BANKING FINANCIAL SERVICES AND INSURANCE, BY COUNTRY 2022 AND 2032(%)
- FIGURE 24. COMPARATIVE SHARE ANALYSIS OF IOT CHIPS MARKET FOR RETAIL, BY COUNTRY 2022 AND 2032(%)
- FIGURE 25. COMPARATIVE SHARE ANALYSIS OF IOT CHIPS MARKET FOR OTHERS, BY COUNTRY 2022 AND 2032(%)
- FIGURE 26. IOT CHIPS MARKET BY REGION, 2022 AND 2032(%)
- FIGURE 27. U.S. IOT CHIPS MARKET, 2022-2032 ($BILLION)
- FIGURE 28. CANADA IOT CHIPS MARKET, 2022-2032 ($BILLION)
- FIGURE 29. MEXICO IOT CHIPS MARKET, 2022-2032 ($BILLION)
- FIGURE 30. UK IOT CHIPS MARKET, 2022-2032 ($BILLION)
- FIGURE 31. GERMANY IOT CHIPS MARKET, 2022-2032 ($BILLION)
- FIGURE 32. FRANCE IOT CHIPS MARKET, 2022-2032 ($BILLION)
- FIGURE 33. ITALY IOT CHIPS MARKET, 2022-2032 ($BILLION)
- FIGURE 34. SPAIN IOT CHIPS MARKET, 2022-2032 ($BILLION)
- FIGURE 35. REST OF EUROPE IOT CHIPS MARKET, 2022-2032 ($BILLION)
- FIGURE 36. CHINA IOT CHIPS MARKET, 2022-2032 ($BILLION)
- FIGURE 37. INDIA IOT CHIPS MARKET, 2022-2032 ($BILLION)
- FIGURE 38. JAPAN IOT CHIPS MARKET, 2022-2032 ($BILLION)
- FIGURE 39. SOUTH KOREA IOT CHIPS MARKET, 2022-2032 ($BILLION)
- FIGURE 40. AUSTRALIA IOT CHIPS MARKET, 2022-2032 ($BILLION)
- FIGURE 41. REST OF ASIA-PACIFIC IOT CHIPS MARKET, 2022-2032 ($BILLION)
- FIGURE 42. BRAZIL IOT CHIPS MARKET, 2022-2032 ($BILLION)
- FIGURE 43. ARGENTINA IOT CHIPS MARKET, 2022-2032 ($BILLION)
- FIGURE 44. REST OF LATIN AMERICA IOT CHIPS MARKET, 2022-2032 ($BILLION)
- FIGURE 45. UAE IOT CHIPS MARKET, 2022-2032 ($BILLION)
- FIGURE 46. SAUDI ARABIA IOT CHIPS MARKET, 2022-2032 ($BILLION)
- FIGURE 47. QATAR IOT CHIPS MARKET, 2022-2032 ($BILLION)
- FIGURE 48. REST OF MIDDLE EAST AND AFRICA IOT CHIPS MARKET, 2022-2032 ($BILLION)
- FIGURE 49. TOP WINNING STRATEGIES, BY YEAR
- FIGURE 50. TOP WINNING STRATEGIES, BY DEVELOPMENT
- FIGURE 51. TOP WINNING STRATEGIES, BY COMPANY
- FIGURE 52. PRODUCT MAPPING OF TOP 10 PLAYERS
- FIGURE 53. COMPETITIVE DASHBOARD
- FIGURE 54. COMPETITIVE HEATMAP: IOT CHIPS MARKET
- FIGURE 55. TOP PLAYER POSITIONING, 2022

