
PUBLISHER: Allied Market Research | PRODUCT CODE: 1472193

PUBLISHER: Allied Market Research | PRODUCT CODE: 1472193
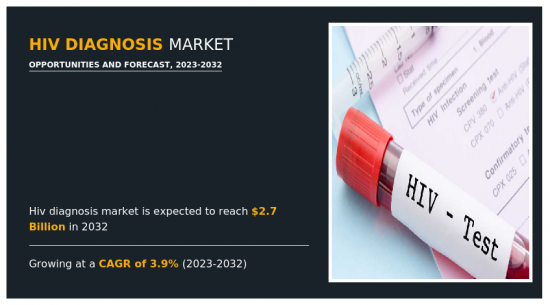
HIV Diagnosis Market By Mode, By Test Type, By End-use : Global Opportunity Analysis and Industry Forecast, 2023-2032
The global HIV diagnosis market was valued at $1.9 billion in 2022, and is projected to reach $2.7 billion by 2032, growing at a CAGR of 3.9% from 2023 to 2032.
It is a procedure that determines if a person has contracted the Human Immunodeficiency Virus (HIV), a virus that leads to acquired immunodeficiency syndrome (AIDS). Several approaches and methodologies are used in HIV testing to establish whether an individual has HIV antibodies, antigens, or gene (RNA or DNA) in his blood volumes, saliva, and urine. Essentially, the focus of HIV testing is aimed at detecting infected persons very early, offering them relevant medical attention as well as preventing others from acquiring the infection.
Trends in HIV diagnosis exhibit a diverse landscape shaped by factors including geographical location, demographics, prevention measures, and healthcare accessibility. Notably, several high-income countries with robust prevention and treatment programs have witnessed a decline in new HIV diagnoses due to heightened awareness, widespread testing, improved treatment access, and preventive strategies such as Pre-exposure prophylaxis (PrEP). For instance, in 2022, according to Organization for Economic Cooperation and Development (OECD) in Asia-Pacific, the prevalence of HIV infection varied importantly, ranging from less than 0.1% of adults aged 15 to 49 in Bangladesh, Mongolia, New Zealand, and Sri Lanka to 1% of adults aged 15 to 49 in Thailand in 2020. Although HIV prevalence was low, the absolute number of people living with HIV was high at more than 2.2 million in reporting countries and territories in 2021, owing to Asia-Pacific's large population.
Although there have been advancements in the prevention and treatment of HIV, it is important to note that some specific populations such as men who have sexual intercourse with other men (MSM), transgender people, and racial minorities continue to report high rates of HIV diagnoses. These disparities underscore prevailing inequalities in care. At the same time, new HIV epidemics are emerging within certain populations or regions, owing to factors such as injecting drugs and difficulties in accessing healthcare services. Young people also remain vulnerable in certain areas such as sub-Saharan Africa as they lack adequate sex education and limited access to health care.
The HIV diagnosis market is segmented into mode, test type, end use, and region. By mode, the market is segregated into self-test and lab based. By test type the market is segregated into antibody/antigen test, viral load test/nucleic acid test, CD4 test, and test for early infant diagnosis. Antibody/antigen test is further segregated into HIV-1 screening tests, HIV-1 antibody confirmatory tests, and HIV-2 & Group Of diagnostic tests. By end use, the market is segregated into diagnostic laboratories, hospitals & clinics, and home settings. By region, the HIV diagnosis market is segmented into North America, Europe, Asia-Pacific, and LAMEA.
Major companies operating in this market include Abbott, Gilead Sciences, Inc., Merck & Co. Inc., Beckman Coulter, Inc., Mylan N.V., F. Hoffman-La Roche Ltd., Siemens Healthcare GmbH, QIAGEN, Bio-Rad Laboratories, Inc., and Hologic. Key players have adopted product launch and collaboration as their key strategy to improve the product portfolio of the testosterone replacement therapy market.
Key Benefits For Stakeholders
- This report provides a quantitative analysis of the market segments, current trends, estimations, and dynamics of the hiv diagnosis market analysis from 2022 to 2032 to identify the prevailing hiv diagnosis market opportunities.
- The market research is offered along with information related to key drivers, restraints, and opportunities.
- Porter's five forces analysis highlights the potency of buyers and suppliers to enable stakeholders make profit-oriented business decisions and strengthen their supplier-buyer network.
- In-depth analysis of the hiv diagnosis market segmentation assists to determine the prevailing market opportunities.
- Major countries in each region are mapped according to their revenue contribution to the global market.
- Market player positioning facilitates benchmarking and provides a clear understanding of the present position of the market players.
- The report includes the analysis of the regional as well as global hiv diagnosis market trends, key players, market segments, application areas, and market growth strategies.
Additional benefits you will get with this purchase are:
- Quarterly Update and* (only available with a corporate license, on listed price)
- 5 additional Company Profile of client Choice pre- or Post-purchase, as a free update.
- Free Upcoming Version on the Purchase of Five and Enterprise User License.
- 16 analyst hours of support* (post-purchase, if you find additional data requirements upon review of the report, you may receive support amounting to 16 analyst hours to solve questions, and post-sale queries)
- 15% Free Customization* (in case the scope or segment of the report does not match your requirements, 15% is equivalent to 3 working days of free work, applicable once)
- Free data Pack on the Five and Enterprise User License. (Excel version of the report)
- Free Updated report if the report is 6-12 months old or older.
- 24-hour priority response*
- Free Industry updates and white papers.
Possible Customization with this report (with additional cost and timeline, please talk to the sales executive to know more)
- Additional company profiles with specific to client's interest
- Additional country or region analysis- market size and forecast
- Average Selling Price Analysis / Price Point Analysis
- Criss-cross segment analysis- market size and forecast
- Expanded list for Company Profiles
- Historic market data
- Key player details (including location, contact details, supplier/vendor network etc. in excel format)
- Market share analysis of players at global/region/country level
- SWOT Analysis
Key Market Segments
By Mode
- Self-test
- Lab-based
By Test Type
- Antibody/Antigen Test
- Type
- HIV-1 Screening Tests
- HIV-1 Antibody Confirmatory Tests
- HIV-2 and Group O Diagnostic Tests
- Viral load test/Nucleic Acid Test
- CD4 test
- Test for Early Infant Diagnosis
By End-use
- Diagnostic Laboratories
- Hospitals and Clinics
- Home Settings
By Region
- North America
- U.S.
- Canada
- Mexico
- Europe
- Germany
- France
- UK
- Italy
- Spain
- Rest of Europe
- Asia-Pacific
- Japan
- China
- Australia
- India
- South Korea
- Rest of Asia-Pacific
- LAMEA
- Brazil
- Saudi Arabia
- South Africa
- Rest of LAMEA
Key Market Players:
- Abbott Laboratories
- Gilead Sciences, Inc.
- Merck & Co. Inc.
- Danaher Corporation
- Mylan N.V.
- F Hoffman La Roche Ltd
- Siemens Healthcare Private Limited
- Qiagen NV.
- Bio-Rad Laboratories, Inc.
- Hologic Inc.
TABLE OF CONTENTS
CHAPTER 1: INTRODUCTION
- 1.1. Report description
- 1.2. Key market segments
- 1.3. Key benefits to the stakeholders
- 1.4. Research methodology
- 1.4.1. Primary research
- 1.4.2. Secondary research
- 1.4.3. Analyst tools and models
CHAPTER 2: EXECUTIVE SUMMARY
- 2.1. CXO perspective
CHAPTER 3: MARKET OVERVIEW
- 3.1. Market definition and scope
- 3.2. Key findings
- 3.2.1. Top impacting factors
- 3.2.2. Top investment pockets
- 3.3. Porter's five forces analysis
- 3.4. Market dynamics
- 3.4.1. Drivers
- 3.4.2. Restraints
- 3.4.3. Opportunities
CHAPTER 4: HIV DIAGNOSIS MARKET, BY MODE
- 4.1. Overview
- 4.1.1. Market size and forecast
- 4.2. Self-test
- 4.2.1. Key market trends, growth factors and opportunities
- 4.2.2. Market size and forecast, by region
- 4.2.3. Market share analysis by country
- 4.3. Lab-based
- 4.3.1. Key market trends, growth factors and opportunities
- 4.3.2. Market size and forecast, by region
- 4.3.3. Market share analysis by country
CHAPTER 5: HIV DIAGNOSIS MARKET, BY TEST TYPE
- 5.1. Overview
- 5.1.1. Market size and forecast
- 5.2. Antibody/Antigen Test
- 5.2.1. Key market trends, growth factors and opportunities
- 5.2.2. Market size and forecast, by region
- 5.2.3. Market share analysis by country
- 5.2.4. Antibody/Antigen Test HIV Diagnosis Market by Type
- 5.3. Viral load test/Nucleic Acid Test
- 5.3.1. Key market trends, growth factors and opportunities
- 5.3.2. Market size and forecast, by region
- 5.3.3. Market share analysis by country
- 5.4. CD4 test
- 5.4.1. Key market trends, growth factors and opportunities
- 5.4.2. Market size and forecast, by region
- 5.4.3. Market share analysis by country
- 5.5. Test for Early Infant Diagnosis
- 5.5.1. Key market trends, growth factors and opportunities
- 5.5.2. Market size and forecast, by region
- 5.5.3. Market share analysis by country
CHAPTER 6: HIV DIAGNOSIS MARKET, BY END-USE
- 6.1. Overview
- 6.1.1. Market size and forecast
- 6.2. Diagnostic Laboratories
- 6.2.1. Key market trends, growth factors and opportunities
- 6.2.2. Market size and forecast, by region
- 6.2.3. Market share analysis by country
- 6.3. Hospitals and Clinics
- 6.3.1. Key market trends, growth factors and opportunities
- 6.3.2. Market size and forecast, by region
- 6.3.3. Market share analysis by country
- 6.4. Home Settings
- 6.4.1. Key market trends, growth factors and opportunities
- 6.4.2. Market size and forecast, by region
- 6.4.3. Market share analysis by country
CHAPTER 7: HIV DIAGNOSIS MARKET, BY REGION
- 7.1. Overview
- 7.1.1. Market size and forecast By Region
- 7.2. North America
- 7.2.1. Key market trends, growth factors and opportunities
- 7.2.2. Market size and forecast, by Mode
- 7.2.3. Market size and forecast, by Test Type
- 7.2.4. Market size and forecast, by End-use
- 7.2.5. Market size and forecast, by country
- 7.2.5.1. U.S.
- 7.2.5.1.1. Market size and forecast, by Mode
- 7.2.5.1.2. Market size and forecast, by Test Type
- 7.2.5.1.3. Market size and forecast, by End-use
- 7.2.5.2. Canada
- 7.2.5.2.1. Market size and forecast, by Mode
- 7.2.5.2.2. Market size and forecast, by Test Type
- 7.2.5.2.3. Market size and forecast, by End-use
- 7.2.5.3. Mexico
- 7.2.5.3.1. Market size and forecast, by Mode
- 7.2.5.3.2. Market size and forecast, by Test Type
- 7.2.5.3.3. Market size and forecast, by End-use
- 7.3. Europe
- 7.3.1. Key market trends, growth factors and opportunities
- 7.3.2. Market size and forecast, by Mode
- 7.3.3. Market size and forecast, by Test Type
- 7.3.4. Market size and forecast, by End-use
- 7.3.5. Market size and forecast, by country
- 7.3.5.1. Germany
- 7.3.5.1.1. Market size and forecast, by Mode
- 7.3.5.1.2. Market size and forecast, by Test Type
- 7.3.5.1.3. Market size and forecast, by End-use
- 7.3.5.2. France
- 7.3.5.2.1. Market size and forecast, by Mode
- 7.3.5.2.2. Market size and forecast, by Test Type
- 7.3.5.2.3. Market size and forecast, by End-use
- 7.3.5.3. UK
- 7.3.5.3.1. Market size and forecast, by Mode
- 7.3.5.3.2. Market size and forecast, by Test Type
- 7.3.5.3.3. Market size and forecast, by End-use
- 7.3.5.4. Italy
- 7.3.5.4.1. Market size and forecast, by Mode
- 7.3.5.4.2. Market size and forecast, by Test Type
- 7.3.5.4.3. Market size and forecast, by End-use
- 7.3.5.5. Spain
- 7.3.5.5.1. Market size and forecast, by Mode
- 7.3.5.5.2. Market size and forecast, by Test Type
- 7.3.5.5.3. Market size and forecast, by End-use
- 7.3.5.6. Rest of Europe
- 7.3.5.6.1. Market size and forecast, by Mode
- 7.3.5.6.2. Market size and forecast, by Test Type
- 7.3.5.6.3. Market size and forecast, by End-use
- 7.4. Asia-Pacific
- 7.4.1. Key market trends, growth factors and opportunities
- 7.4.2. Market size and forecast, by Mode
- 7.4.3. Market size and forecast, by Test Type
- 7.4.4. Market size and forecast, by End-use
- 7.4.5. Market size and forecast, by country
- 7.4.5.1. Japan
- 7.4.5.1.1. Market size and forecast, by Mode
- 7.4.5.1.2. Market size and forecast, by Test Type
- 7.4.5.1.3. Market size and forecast, by End-use
- 7.4.5.2. China
- 7.4.5.2.1. Market size and forecast, by Mode
- 7.4.5.2.2. Market size and forecast, by Test Type
- 7.4.5.2.3. Market size and forecast, by End-use
- 7.4.5.3. Australia
- 7.4.5.3.1. Market size and forecast, by Mode
- 7.4.5.3.2. Market size and forecast, by Test Type
- 7.4.5.3.3. Market size and forecast, by End-use
- 7.4.5.4. India
- 7.4.5.4.1. Market size and forecast, by Mode
- 7.4.5.4.2. Market size and forecast, by Test Type
- 7.4.5.4.3. Market size and forecast, by End-use
- 7.4.5.5. South Korea
- 7.4.5.5.1. Market size and forecast, by Mode
- 7.4.5.5.2. Market size and forecast, by Test Type
- 7.4.5.5.3. Market size and forecast, by End-use
- 7.4.5.6. Rest of Asia-Pacific
- 7.4.5.6.1. Market size and forecast, by Mode
- 7.4.5.6.2. Market size and forecast, by Test Type
- 7.4.5.6.3. Market size and forecast, by End-use
- 7.5. LAMEA
- 7.5.1. Key market trends, growth factors and opportunities
- 7.5.2. Market size and forecast, by Mode
- 7.5.3. Market size and forecast, by Test Type
- 7.5.4. Market size and forecast, by End-use
- 7.5.5. Market size and forecast, by country
- 7.5.5.1. Brazil
- 7.5.5.1.1. Market size and forecast, by Mode
- 7.5.5.1.2. Market size and forecast, by Test Type
- 7.5.5.1.3. Market size and forecast, by End-use
- 7.5.5.2. Saudi Arabia
- 7.5.5.2.1. Market size and forecast, by Mode
- 7.5.5.2.2. Market size and forecast, by Test Type
- 7.5.5.2.3. Market size and forecast, by End-use
- 7.5.5.3. South Africa
- 7.5.5.3.1. Market size and forecast, by Mode
- 7.5.5.3.2. Market size and forecast, by Test Type
- 7.5.5.3.3. Market size and forecast, by End-use
- 7.5.5.4. Rest of LAMEA
- 7.5.5.4.1. Market size and forecast, by Mode
- 7.5.5.4.2. Market size and forecast, by Test Type
- 7.5.5.4.3. Market size and forecast, by End-use
CHAPTER 8: COMPETITIVE LANDSCAPE
- 8.1. Introduction
- 8.2. Top winning strategies
- 8.3. Product mapping of top 10 player
- 8.4. Competitive dashboard
- 8.5. Competitive heatmap
- 8.6. Top player positioning, 2022
CHAPTER 9: COMPANY PROFILES
- 9.1. Abbott Laboratories
- 9.1.1. Company overview
- 9.1.2. Key executives
- 9.1.3. Company snapshot
- 9.1.4. Operating business segments
- 9.1.5. Product portfolio
- 9.1.6. Business performance
- 9.1.7. Key strategic moves and developments
- 9.2. Gilead Sciences, Inc.
- 9.2.1. Company overview
- 9.2.2. Key executives
- 9.2.3. Company snapshot
- 9.2.4. Operating business segments
- 9.2.5. Product portfolio
- 9.2.6. Business performance
- 9.2.7. Key strategic moves and developments
- 9.3. Merck & Co. Inc.
- 9.3.1. Company overview
- 9.3.2. Key executives
- 9.3.3. Company snapshot
- 9.3.4. Operating business segments
- 9.3.5. Product portfolio
- 9.3.6. Business performance
- 9.3.7. Key strategic moves and developments
- 9.4. Danaher Corporation
- 9.4.1. Company overview
- 9.4.2. Key executives
- 9.4.3. Company snapshot
- 9.4.4. Operating business segments
- 9.4.5. Product portfolio
- 9.4.6. Business performance
- 9.4.7. Key strategic moves and developments
- 9.5. Mylan N.V.
- 9.5.1. Company overview
- 9.5.2. Key executives
- 9.5.3. Company snapshot
- 9.5.4. Operating business segments
- 9.5.5. Product portfolio
- 9.5.6. Business performance
- 9.5.7. Key strategic moves and developments
- 9.6. F Hoffman La Roche Ltd
- 9.6.1. Company overview
- 9.6.2. Key executives
- 9.6.3. Company snapshot
- 9.6.4. Operating business segments
- 9.6.5. Product portfolio
- 9.6.6. Business performance
- 9.6.7. Key strategic moves and developments
- 9.7. Siemens Healthcare Private Limited
- 9.7.1. Company overview
- 9.7.2. Key executives
- 9.7.3. Company snapshot
- 9.7.4. Operating business segments
- 9.7.5. Product portfolio
- 9.7.6. Business performance
- 9.7.7. Key strategic moves and developments
- 9.8. Qiagen NV.
- 9.8.1. Company overview
- 9.8.2. Key executives
- 9.8.3. Company snapshot
- 9.8.4. Operating business segments
- 9.8.5. Product portfolio
- 9.8.6. Business performance
- 9.8.7. Key strategic moves and developments
- 9.9. Bio-Rad Laboratories, Inc.
- 9.9.1. Company overview
- 9.9.2. Key executives
- 9.9.3. Company snapshot
- 9.9.4. Operating business segments
- 9.9.5. Product portfolio
- 9.9.6. Business performance
- 9.9.7. Key strategic moves and developments
- 9.10. Hologic Inc.
- 9.10.1. Company overview
- 9.10.2. Key executives
- 9.10.3. Company snapshot
- 9.10.4. Operating business segments
- 9.10.5. Product portfolio
- 9.10.6. Business performance
- 9.10.7. Key strategic moves and developments
LIST OF TABLES
- TABLE 01. GLOBAL HIV DIAGNOSIS MARKET, BY MODE, 2022-2032 ($MILLION)
- TABLE 02. HIV DIAGNOSIS MARKET FOR SELF-TEST, BY REGION, 2022-2032 ($MILLION)
- TABLE 03. HIV DIAGNOSIS MARKET FOR LAB-BASED, BY REGION, 2022-2032 ($MILLION)
- TABLE 04. GLOBAL HIV DIAGNOSIS MARKET, BY TEST TYPE, 2022-2032 ($MILLION)
- TABLE 05. HIV DIAGNOSIS MARKET FOR ANTIBODY/ANTIGEN TEST, BY REGION, 2022-2032 ($MILLION)
- TABLE 06. GLOBAL ANTIBODY/ANTIGEN TEST HIV DIAGNOSIS MARKET, BY TYPE, 2022-2032 ($MILLION)
- TABLE 07. HIV DIAGNOSIS MARKET FOR VIRAL LOAD TEST/NUCLEIC ACID TEST, BY REGION, 2022-2032 ($MILLION)
- TABLE 08. HIV DIAGNOSIS MARKET FOR CD4 TEST, BY REGION, 2022-2032 ($MILLION)
- TABLE 09. HIV DIAGNOSIS MARKET FOR TEST FOR EARLY INFANT DIAGNOSIS, BY REGION, 2022-2032 ($MILLION)
- TABLE 10. GLOBAL HIV DIAGNOSIS MARKET, BY END-USE, 2022-2032 ($MILLION)
- TABLE 11. HIV DIAGNOSIS MARKET FOR DIAGNOSTIC LABORATORIES, BY REGION, 2022-2032 ($MILLION)
- TABLE 12. HIV DIAGNOSIS MARKET FOR HOSPITALS AND CLINICS, BY REGION, 2022-2032 ($MILLION)
- TABLE 13. HIV DIAGNOSIS MARKET FOR HOME SETTINGS, BY REGION, 2022-2032 ($MILLION)
- TABLE 14. HIV DIAGNOSIS MARKET, BY REGION, 2022-2032 ($MILLION)
- TABLE 15. NORTH AMERICA HIV DIAGNOSIS MARKET, BY MODE, 2022-2032 ($MILLION)
- TABLE 16. NORTH AMERICA HIV DIAGNOSIS MARKET, BY TEST TYPE, 2022-2032 ($MILLION)
- TABLE 17. NORTH AMERICA HIV DIAGNOSIS MARKET, BY END-USE, 2022-2032 ($MILLION)
- TABLE 18. NORTH AMERICA HIV DIAGNOSIS MARKET, BY COUNTRY, 2022-2032 ($MILLION)
- TABLE 19. U.S. HIV DIAGNOSIS MARKET, BY MODE, 2022-2032 ($MILLION)
- TABLE 20. U.S. HIV DIAGNOSIS MARKET, BY TEST TYPE, 2022-2032 ($MILLION)
- TABLE 21. U.S. HIV DIAGNOSIS MARKET, BY END-USE, 2022-2032 ($MILLION)
- TABLE 22. CANADA HIV DIAGNOSIS MARKET, BY MODE, 2022-2032 ($MILLION)
- TABLE 23. CANADA HIV DIAGNOSIS MARKET, BY TEST TYPE, 2022-2032 ($MILLION)
- TABLE 24. CANADA HIV DIAGNOSIS MARKET, BY END-USE, 2022-2032 ($MILLION)
- TABLE 25. MEXICO HIV DIAGNOSIS MARKET, BY MODE, 2022-2032 ($MILLION)
- TABLE 26. MEXICO HIV DIAGNOSIS MARKET, BY TEST TYPE, 2022-2032 ($MILLION)
- TABLE 27. MEXICO HIV DIAGNOSIS MARKET, BY END-USE, 2022-2032 ($MILLION)
- TABLE 28. EUROPE HIV DIAGNOSIS MARKET, BY MODE, 2022-2032 ($MILLION)
- TABLE 29. EUROPE HIV DIAGNOSIS MARKET, BY TEST TYPE, 2022-2032 ($MILLION)
- TABLE 30. EUROPE HIV DIAGNOSIS MARKET, BY END-USE, 2022-2032 ($MILLION)
- TABLE 31. EUROPE HIV DIAGNOSIS MARKET, BY COUNTRY, 2022-2032 ($MILLION)
- TABLE 32. GERMANY HIV DIAGNOSIS MARKET, BY MODE, 2022-2032 ($MILLION)
- TABLE 33. GERMANY HIV DIAGNOSIS MARKET, BY TEST TYPE, 2022-2032 ($MILLION)
- TABLE 34. GERMANY HIV DIAGNOSIS MARKET, BY END-USE, 2022-2032 ($MILLION)
- TABLE 35. FRANCE HIV DIAGNOSIS MARKET, BY MODE, 2022-2032 ($MILLION)
- TABLE 36. FRANCE HIV DIAGNOSIS MARKET, BY TEST TYPE, 2022-2032 ($MILLION)
- TABLE 37. FRANCE HIV DIAGNOSIS MARKET, BY END-USE, 2022-2032 ($MILLION)
- TABLE 38. UK HIV DIAGNOSIS MARKET, BY MODE, 2022-2032 ($MILLION)
- TABLE 39. UK HIV DIAGNOSIS MARKET, BY TEST TYPE, 2022-2032 ($MILLION)
- TABLE 40. UK HIV DIAGNOSIS MARKET, BY END-USE, 2022-2032 ($MILLION)
- TABLE 41. ITALY HIV DIAGNOSIS MARKET, BY MODE, 2022-2032 ($MILLION)
- TABLE 42. ITALY HIV DIAGNOSIS MARKET, BY TEST TYPE, 2022-2032 ($MILLION)
- TABLE 43. ITALY HIV DIAGNOSIS MARKET, BY END-USE, 2022-2032 ($MILLION)
- TABLE 44. SPAIN HIV DIAGNOSIS MARKET, BY MODE, 2022-2032 ($MILLION)
- TABLE 45. SPAIN HIV DIAGNOSIS MARKET, BY TEST TYPE, 2022-2032 ($MILLION)
- TABLE 46. SPAIN HIV DIAGNOSIS MARKET, BY END-USE, 2022-2032 ($MILLION)
- TABLE 47. REST OF EUROPE HIV DIAGNOSIS MARKET, BY MODE, 2022-2032 ($MILLION)
- TABLE 48. REST OF EUROPE HIV DIAGNOSIS MARKET, BY TEST TYPE, 2022-2032 ($MILLION)
- TABLE 49. REST OF EUROPE HIV DIAGNOSIS MARKET, BY END-USE, 2022-2032 ($MILLION)
- TABLE 50. ASIA-PACIFIC HIV DIAGNOSIS MARKET, BY MODE, 2022-2032 ($MILLION)
- TABLE 51. ASIA-PACIFIC HIV DIAGNOSIS MARKET, BY TEST TYPE, 2022-2032 ($MILLION)
- TABLE 52. ASIA-PACIFIC HIV DIAGNOSIS MARKET, BY END-USE, 2022-2032 ($MILLION)
- TABLE 53. ASIA-PACIFIC HIV DIAGNOSIS MARKET, BY COUNTRY, 2022-2032 ($MILLION)
- TABLE 54. JAPAN HIV DIAGNOSIS MARKET, BY MODE, 2022-2032 ($MILLION)
- TABLE 55. JAPAN HIV DIAGNOSIS MARKET, BY TEST TYPE, 2022-2032 ($MILLION)
- TABLE 56. JAPAN HIV DIAGNOSIS MARKET, BY END-USE, 2022-2032 ($MILLION)
- TABLE 57. CHINA HIV DIAGNOSIS MARKET, BY MODE, 2022-2032 ($MILLION)
- TABLE 58. CHINA HIV DIAGNOSIS MARKET, BY TEST TYPE, 2022-2032 ($MILLION)
- TABLE 59. CHINA HIV DIAGNOSIS MARKET, BY END-USE, 2022-2032 ($MILLION)
- TABLE 60. AUSTRALIA HIV DIAGNOSIS MARKET, BY MODE, 2022-2032 ($MILLION)
- TABLE 61. AUSTRALIA HIV DIAGNOSIS MARKET, BY TEST TYPE, 2022-2032 ($MILLION)
- TABLE 62. AUSTRALIA HIV DIAGNOSIS MARKET, BY END-USE, 2022-2032 ($MILLION)
- TABLE 63. INDIA HIV DIAGNOSIS MARKET, BY MODE, 2022-2032 ($MILLION)
- TABLE 64. INDIA HIV DIAGNOSIS MARKET, BY TEST TYPE, 2022-2032 ($MILLION)
- TABLE 65. INDIA HIV DIAGNOSIS MARKET, BY END-USE, 2022-2032 ($MILLION)
- TABLE 66. SOUTH KOREA HIV DIAGNOSIS MARKET, BY MODE, 2022-2032 ($MILLION)
- TABLE 67. SOUTH KOREA HIV DIAGNOSIS MARKET, BY TEST TYPE, 2022-2032 ($MILLION)
- TABLE 68. SOUTH KOREA HIV DIAGNOSIS MARKET, BY END-USE, 2022-2032 ($MILLION)
- TABLE 69. REST OF ASIA-PACIFIC HIV DIAGNOSIS MARKET, BY MODE, 2022-2032 ($MILLION)
- TABLE 70. REST OF ASIA-PACIFIC HIV DIAGNOSIS MARKET, BY TEST TYPE, 2022-2032 ($MILLION)
- TABLE 71. REST OF ASIA-PACIFIC HIV DIAGNOSIS MARKET, BY END-USE, 2022-2032 ($MILLION)
- TABLE 72. LAMEA HIV DIAGNOSIS MARKET, BY MODE, 2022-2032 ($MILLION)
- TABLE 73. LAMEA HIV DIAGNOSIS MARKET, BY TEST TYPE, 2022-2032 ($MILLION)
- TABLE 74. LAMEA HIV DIAGNOSIS MARKET, BY END-USE, 2022-2032 ($MILLION)
- TABLE 75. LAMEA HIV DIAGNOSIS MARKET, BY COUNTRY, 2022-2032 ($MILLION)
- TABLE 76. BRAZIL HIV DIAGNOSIS MARKET, BY MODE, 2022-2032 ($MILLION)
- TABLE 77. BRAZIL HIV DIAGNOSIS MARKET, BY TEST TYPE, 2022-2032 ($MILLION)
- TABLE 78. BRAZIL HIV DIAGNOSIS MARKET, BY END-USE, 2022-2032 ($MILLION)
- TABLE 79. SAUDI ARABIA HIV DIAGNOSIS MARKET, BY MODE, 2022-2032 ($MILLION)
- TABLE 80. SAUDI ARABIA HIV DIAGNOSIS MARKET, BY TEST TYPE, 2022-2032 ($MILLION)
- TABLE 81. SAUDI ARABIA HIV DIAGNOSIS MARKET, BY END-USE, 2022-2032 ($MILLION)
- TABLE 82. SOUTH AFRICA HIV DIAGNOSIS MARKET, BY MODE, 2022-2032 ($MILLION)
- TABLE 83. SOUTH AFRICA HIV DIAGNOSIS MARKET, BY TEST TYPE, 2022-2032 ($MILLION)
- TABLE 84. SOUTH AFRICA HIV DIAGNOSIS MARKET, BY END-USE, 2022-2032 ($MILLION)
- TABLE 85. REST OF LAMEA HIV DIAGNOSIS MARKET, BY MODE, 2022-2032 ($MILLION)
- TABLE 86. REST OF LAMEA HIV DIAGNOSIS MARKET, BY TEST TYPE, 2022-2032 ($MILLION)
- TABLE 87. REST OF LAMEA HIV DIAGNOSIS MARKET, BY END-USE, 2022-2032 ($MILLION)
- TABLE 88. ABBOTT LABORATORIES: KEY EXECUTIVES
- TABLE 89. ABBOTT LABORATORIES: COMPANY SNAPSHOT
- TABLE 90. ABBOTT LABORATORIES: PRODUCT SEGMENTS
- TABLE 91. ABBOTT LABORATORIES: SERVICE SEGMENTS
- TABLE 92. ABBOTT LABORATORIES: PRODUCT PORTFOLIO
- TABLE 93. ABBOTT LABORATORIES: KEY STRATERGIES
- TABLE 94. GILEAD SCIENCES, INC.: KEY EXECUTIVES
- TABLE 95. GILEAD SCIENCES, INC.: COMPANY SNAPSHOT
- TABLE 96. GILEAD SCIENCES, INC.: PRODUCT SEGMENTS
- TABLE 97. GILEAD SCIENCES, INC.: SERVICE SEGMENTS
- TABLE 98. GILEAD SCIENCES, INC.: PRODUCT PORTFOLIO
- TABLE 99. GILEAD SCIENCES, INC.: KEY STRATERGIES
- TABLE 100. MERCK & CO. INC.: KEY EXECUTIVES
- TABLE 101. MERCK & CO. INC.: COMPANY SNAPSHOT
- TABLE 102. MERCK & CO. INC.: PRODUCT SEGMENTS
- TABLE 103. MERCK & CO. INC.: SERVICE SEGMENTS
- TABLE 104. MERCK & CO. INC.: PRODUCT PORTFOLIO
- TABLE 105. MERCK & CO. INC.: KEY STRATERGIES
- TABLE 106. DANAHER CORPORATION: KEY EXECUTIVES
- TABLE 107. DANAHER CORPORATION: COMPANY SNAPSHOT
- TABLE 108. DANAHER CORPORATION: PRODUCT SEGMENTS
- TABLE 109. DANAHER CORPORATION: SERVICE SEGMENTS
- TABLE 110. DANAHER CORPORATION: PRODUCT PORTFOLIO
- TABLE 111. DANAHER CORPORATION: KEY STRATERGIES
- TABLE 112. MYLAN N.V.: KEY EXECUTIVES
- TABLE 113. MYLAN N.V.: COMPANY SNAPSHOT
- TABLE 114. MYLAN N.V.: PRODUCT SEGMENTS
- TABLE 115. MYLAN N.V.: SERVICE SEGMENTS
- TABLE 116. MYLAN N.V.: PRODUCT PORTFOLIO
- TABLE 117. MYLAN N.V.: KEY STRATERGIES
- TABLE 118. F HOFFMAN LA ROCHE LTD: KEY EXECUTIVES
- TABLE 119. F HOFFMAN LA ROCHE LTD: COMPANY SNAPSHOT
- TABLE 120. F HOFFMAN LA ROCHE LTD: PRODUCT SEGMENTS
- TABLE 121. F HOFFMAN LA ROCHE LTD: SERVICE SEGMENTS
- TABLE 122. F HOFFMAN LA ROCHE LTD: PRODUCT PORTFOLIO
- TABLE 123. F HOFFMAN LA ROCHE LTD: KEY STRATERGIES
- TABLE 124. SIEMENS HEALTHCARE PRIVATE LIMITED: KEY EXECUTIVES
- TABLE 125. SIEMENS HEALTHCARE PRIVATE LIMITED: COMPANY SNAPSHOT
- TABLE 126. SIEMENS HEALTHCARE PRIVATE LIMITED: PRODUCT SEGMENTS
- TABLE 127. SIEMENS HEALTHCARE PRIVATE LIMITED: SERVICE SEGMENTS
- TABLE 128. SIEMENS HEALTHCARE PRIVATE LIMITED: PRODUCT PORTFOLIO
- TABLE 129. SIEMENS HEALTHCARE PRIVATE LIMITED: KEY STRATERGIES
- TABLE 130. QIAGEN NV.: KEY EXECUTIVES
- TABLE 131. QIAGEN NV.: COMPANY SNAPSHOT
- TABLE 132. QIAGEN NV.: PRODUCT SEGMENTS
- TABLE 133. QIAGEN NV.: SERVICE SEGMENTS
- TABLE 134. QIAGEN NV.: PRODUCT PORTFOLIO
- TABLE 135. QIAGEN NV.: KEY STRATERGIES
- TABLE 136. BIO-RAD LABORATORIES, INC. : KEY EXECUTIVES
- TABLE 137. BIO-RAD LABORATORIES, INC. : COMPANY SNAPSHOT
- TABLE 138. BIO-RAD LABORATORIES, INC. : PRODUCT SEGMENTS
- TABLE 139. BIO-RAD LABORATORIES, INC. : SERVICE SEGMENTS
- TABLE 140. BIO-RAD LABORATORIES, INC. : PRODUCT PORTFOLIO
- TABLE 141. BIO-RAD LABORATORIES, INC. : KEY STRATERGIES
- TABLE 142. HOLOGIC INC.: KEY EXECUTIVES
- TABLE 143. HOLOGIC INC.: COMPANY SNAPSHOT
- TABLE 144. HOLOGIC INC.: PRODUCT SEGMENTS
- TABLE 145. HOLOGIC INC.: SERVICE SEGMENTS
- TABLE 146. HOLOGIC INC.: PRODUCT PORTFOLIO
- TABLE 147. HOLOGIC INC.: KEY STRATERGIES
LIST OF FIGURES
- FIGURE 01. HIV DIAGNOSIS MARKET, 2022-2032
- FIGURE 02. SEGMENTATION OF HIV DIAGNOSIS MARKET,2022-2032
- FIGURE 03. TOP IMPACTING FACTORS IN HIV DIAGNOSIS MARKET
- FIGURE 04. TOP INVESTMENT POCKETS IN HIV DIAGNOSIS MARKET (2023-2032)
- FIGURE 05. BARGAINING POWER OF SUPPLIERS
- FIGURE 06. BARGAINING POWER OF BUYERS
- FIGURE 07. THREAT OF SUBSTITUTION
- FIGURE 08. THREAT OF SUBSTITUTION
- FIGURE 09. COMPETITIVE RIVALRY
- FIGURE 10. GLOBAL HIV DIAGNOSIS MARKET:DRIVERS, RESTRAINTS AND OPPORTUNITIES
- FIGURE 11. HIV DIAGNOSIS MARKET, BY MODE, 2022 AND 2032(%)
- FIGURE 12. COMPARATIVE SHARE ANALYSIS OF HIV DIAGNOSIS MARKET FOR SELF-TEST, BY COUNTRY 2022 AND 2032(%)
- FIGURE 13. COMPARATIVE SHARE ANALYSIS OF HIV DIAGNOSIS MARKET FOR LAB-BASED, BY COUNTRY 2022 AND 2032(%)
- FIGURE 14. HIV DIAGNOSIS MARKET, BY TEST TYPE, 2022 AND 2032(%)
- FIGURE 15. COMPARATIVE SHARE ANALYSIS OF HIV DIAGNOSIS MARKET FOR ANTIBODY/ANTIGEN TEST, BY COUNTRY 2022 AND 2032(%)
- FIGURE 16. COMPARATIVE SHARE ANALYSIS OF HIV DIAGNOSIS MARKET FOR VIRAL LOAD TEST/NUCLEIC ACID TEST, BY COUNTRY 2022 AND 2032(%)
- FIGURE 17. COMPARATIVE SHARE ANALYSIS OF HIV DIAGNOSIS MARKET FOR CD4 TEST, BY COUNTRY 2022 AND 2032(%)
- FIGURE 18. COMPARATIVE SHARE ANALYSIS OF HIV DIAGNOSIS MARKET FOR TEST FOR EARLY INFANT DIAGNOSIS, BY COUNTRY 2022 AND 2032(%)
- FIGURE 19. HIV DIAGNOSIS MARKET, BY END-USE, 2022 AND 2032(%)
- FIGURE 20. COMPARATIVE SHARE ANALYSIS OF HIV DIAGNOSIS MARKET FOR DIAGNOSTIC LABORATORIES, BY COUNTRY 2022 AND 2032(%)
- FIGURE 21. COMPARATIVE SHARE ANALYSIS OF HIV DIAGNOSIS MARKET FOR HOSPITALS AND CLINICS, BY COUNTRY 2022 AND 2032(%)
- FIGURE 22. COMPARATIVE SHARE ANALYSIS OF HIV DIAGNOSIS MARKET FOR HOME SETTINGS, BY COUNTRY 2022 AND 2032(%)
- FIGURE 23. HIV DIAGNOSIS MARKET BY REGION, 2022 AND 2032(%)
- FIGURE 24. U.S. HIV DIAGNOSIS MARKET, 2022-2032 ($MILLION)
- FIGURE 25. CANADA HIV DIAGNOSIS MARKET, 2022-2032 ($MILLION)
- FIGURE 26. MEXICO HIV DIAGNOSIS MARKET, 2022-2032 ($MILLION)
- FIGURE 27. GERMANY HIV DIAGNOSIS MARKET, 2022-2032 ($MILLION)
- FIGURE 28. FRANCE HIV DIAGNOSIS MARKET, 2022-2032 ($MILLION)
- FIGURE 29. UK HIV DIAGNOSIS MARKET, 2022-2032 ($MILLION)
- FIGURE 30. ITALY HIV DIAGNOSIS MARKET, 2022-2032 ($MILLION)
- FIGURE 31. SPAIN HIV DIAGNOSIS MARKET, 2022-2032 ($MILLION)
- FIGURE 32. REST OF EUROPE HIV DIAGNOSIS MARKET, 2022-2032 ($MILLION)
- FIGURE 33. JAPAN HIV DIAGNOSIS MARKET, 2022-2032 ($MILLION)
- FIGURE 34. CHINA HIV DIAGNOSIS MARKET, 2022-2032 ($MILLION)
- FIGURE 35. AUSTRALIA HIV DIAGNOSIS MARKET, 2022-2032 ($MILLION)
- FIGURE 36. INDIA HIV DIAGNOSIS MARKET, 2022-2032 ($MILLION)
- FIGURE 37. SOUTH KOREA HIV DIAGNOSIS MARKET, 2022-2032 ($MILLION)
- FIGURE 38. REST OF ASIA-PACIFIC HIV DIAGNOSIS MARKET, 2022-2032 ($MILLION)
- FIGURE 39. BRAZIL HIV DIAGNOSIS MARKET, 2022-2032 ($MILLION)
- FIGURE 40. SAUDI ARABIA HIV DIAGNOSIS MARKET, 2022-2032 ($MILLION)
- FIGURE 41. SOUTH AFRICA HIV DIAGNOSIS MARKET, 2022-2032 ($MILLION)
- FIGURE 42. REST OF LAMEA HIV DIAGNOSIS MARKET, 2022-2032 ($MILLION)
- FIGURE 43. TOP WINNING STRATEGIES, BY YEAR
- FIGURE 44. TOP WINNING STRATEGIES, BY DEVELOPMENT
- FIGURE 45. TOP WINNING STRATEGIES, BY COMPANY
- FIGURE 46. PRODUCT MAPPING OF TOP 10 PLAYERS
- FIGURE 47. COMPETITIVE DASHBOARD
- FIGURE 48. COMPETITIVE HEATMAP: HIV DIAGNOSIS MARKET
- FIGURE 49. TOP PLAYER POSITIONING, 2022

